Line Break Charts 101 (Three-Line Break Charts)
Contents
If you are interested in Japanese chart-style indicators that produce buy and sell signals, you may be interested in line break charts.
This is a type of chart that is based almost entirely on price. It may completely ignore some time intervals. At a glance, it looks a lot like a regular candlestick price chart, but it isn't. In this guide, we will explain exactly what the line break chart is, how it works, and how you can use it to spot trade entries in Forex and other financial markets.
What is a line break chart?
The line break chart is also referred to as a three-line break chart. When you plot it, you will see a series of bars on your chart with the bullish bars in one color (usually green) and the bearish bars in another (typically red).
Let's dispel some confusion you might have if you have already tried reading about line break charts. These bars are what people are referring to when they talk about "lines" in line break charts. They do not call them "bars," even though they look like bars. Sometimes, you will hear people refer to them as "blocks" as well.

- The green bars are referred to as up lines.
- The red bars are referred to as down lines.
In addition, certain types of lines on this type of chart have special names:
- Suit: A reversal up line.
- Shoe: A down line that is very short.
- Neck: A short up line right after a reversal up line.
If you have any experience using Renko charts or Kagi charts (also from Japan), it will be easier for you to understand line break charts because there are some similarities.
Just by the looks of it, you could mistake a line break chart for a regular Forex chart — but take a closer look. You will notice there are no wicks on any of the bars/lines. This is because they are not actually candlesticks based on time. Only the opening and closing of these "lines" is based on price.
The decision to draw a new line or a reversal, or nothing at all is based on the close of a new classic bar. As classic bars are time-based, we cannot say that line break charts are entirely time-independent. But the time scale of a line break chart is not linear and even. If there is no justification to add a new continuation line or a reversal, no line is drawn for that period, so it is omitted from the chart.
As a result, the time markets you see at the bottom of a line break chart may not always be evenly distributed the way they would be for a regular chart.
Key point: The line break chart is a Japanese chart that features "up lines" and "down lines" composed of bars that are based on price, not time. Dates and times for a line break chart can be unevenly distributed.
How a line break chart is built
Starting point
You can start a new line break chart with a classic bar of your liking at any point in time. You compare its Close with the previous bar's Close and draw the resulting line:
- If the current Close is above the previous Close, you draw an up line the length of the difference.
- If the current Close is below the previous Close, you draw a down line the length of the difference.
Continuation
A continuation of the current trend (new lines of the same color) is drawn based on the Close of each new classic bar on the chart's timeframe:
- If the new Close is above the previous up line's High, put a new up line the length of the difference.
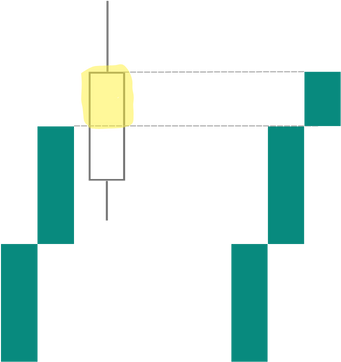
- If the new Close is below the previous down line's Low, put a new down line the length of the difference.

- If the new Close is within the range of the previous lines, don't put any lines.


Reversals
When you plot a line break chart, you will see a setting for Number of Line. The default setting is usually 3, but you can change this number if you want. The Number of Line setting determines which previous line's closing prices will be compared with the current line's closing price when determining a trend reversal.
So, for example, let's say, you leave the setting for Number of Line at 3. The indicator will compare the current line's closing price to that of the lines 2 periods prior.
Here is how to check for a trend reversal in a line break chart based on the new classic bar's Close price:
- If the line break chart is in a downtrend and the new Close is higher than the highs of the lines determined by the Number of Line setting, there is an upward reversal. The new up line's length is the difference between the new Close and the oldest line's High (determined by the Number of Line setting).
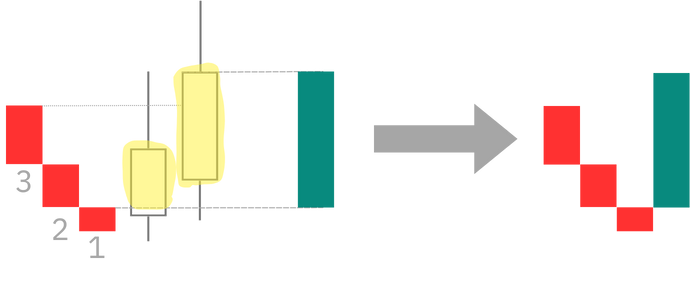
- If the line break chart is in an uptrend and the new Close is lower than the lows of the lines determined by the Number of Line setting, there is an upward reversal. The new up line's length is the difference between the new Close and the oldest line's Low (determined by the Number of Line setting).

Again, remember, when we say "lines," we are talking about the bar shapes you see on the chart.
Key point: The line break chart creates new lines or omits them based on a comparison between the current bar's closing price and the high or low of a prior line. Reversals depend on the line from the past based on your chart settings.
What does the line break chart show us?
When you are looking at a regular Forex chart, it is packed with information, but also a fair bit of noise. If that noise overwhelms you and makes it hard for you to visualize what is happening with price, you may like the cleaner picture painted by the line break chart.
As you examine the line break chart, you can detect regions of support or resistance with ease, which tells you where price has bounced back strongly.
That means you can also see when price breaks through support and resistance, and a breakout is occurring.
At times, you will also spot price action patterns, just as you would on a standard Forex chart.
Key point: The line break chart produces a "less noisy" look at what is happening directly with price.
How to add the line break chart
One thing you need to know about the line break chart is that it is not included among the standard indicators in a lot of western trading platforms. That includes MetaTrader 4.
MetaTrader 4
If you want to add the line break chart indicator to MT4, you will need to download it separately. Here is an example of a free line break chart indicator you can add to MT4.
MetaTrader 4 isn't really set up ideally for the line break chart. So, you need to take a few steps after installing the indicator to get it to display right:
- Display the main chart window as a line chart.
- Go to the chart properties (
F8 ), then Colors tab and select "None" for the line graph.
After you have taken care of the steps above, you can go ahead and add the line break chart indicator to the main chart window.
If you do not want to leave Number of Line set to the default value of 3, then you will need to change it in the indicator parameters box.
Your line break chart should now be set up and ready to use.
Here is an example of a line break chart generated by this MT4 indicator. It's built on a daily EUR/USD chart:
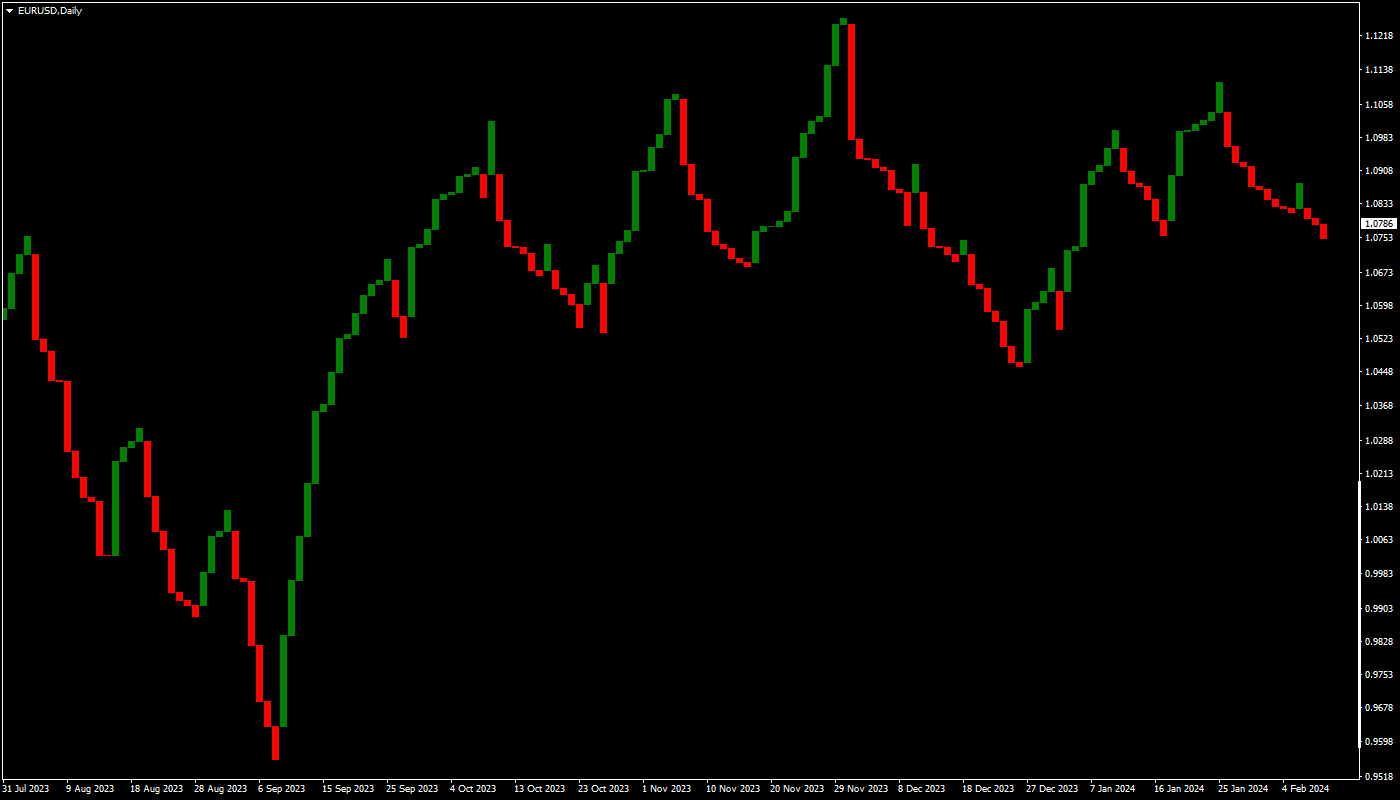
Note that the trough depicted in the left part of the chart is the one from September 2022 contrary to what the original MT4 time scale shows. This is because line times are different from classic bar times.
TradingView
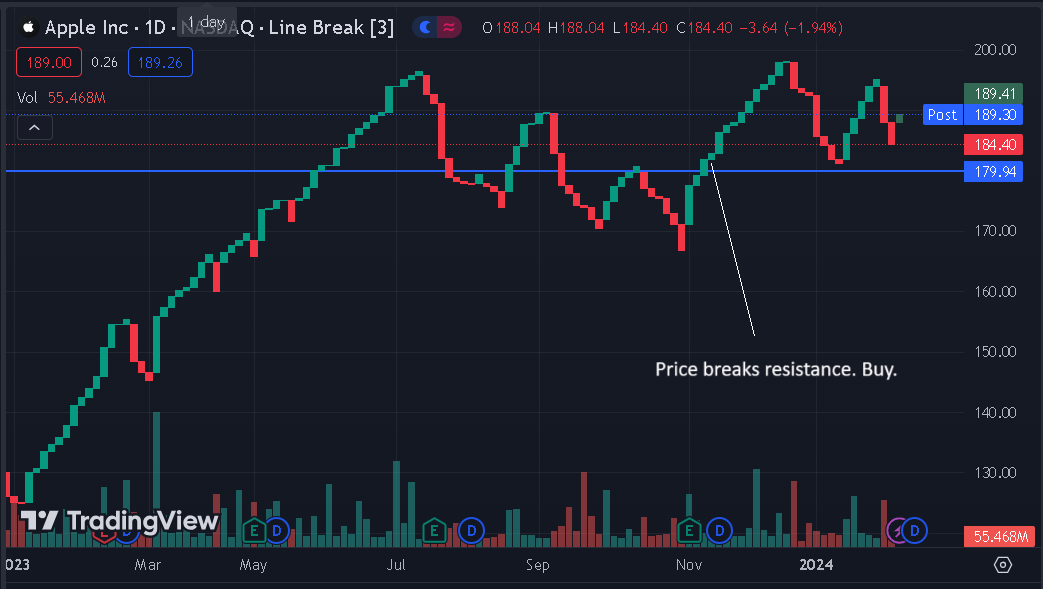
One charting platform that does have native support for line break charts is TradingView. The line break chart is just another chart type in TradingView. You can switch to it by clicking on the chart type icon in the top-left corner of the chart.
You can adjust the chart parameters (including the Number of Line setting) by double-clicking any line on the chart.
Key point: You must download a custom indicator if you want to use line break charts in MT4. It is not included among the standard indicators there. You can use the line break chart as one of the default chart types in TradingView.
How to use the line break chart for trading
What is great about the line break chart is that there are multiple ways you can use it for your trading, as is the case with regular chars.
Buy and sell signals
There are multiple ways that a line break chart can be used to spot entries to buy or sell:
- If you see the line break chart break through an area of support or resistance, then you can trade in the direction of the breakout.
- If you see three or more lines form in one direction, and then a new line forms in the reverse direction, you can try trading in the direction of the new line.
Areas of support and resistance
Identifying zones of support and resistance is easy with a price break chart; just look at spots where price has reversed or hesitated in the past. The more times those events occurred, the stronger the line of support or resistance is (especially when price has tested it but failed to break through).

Price action patterns
Just as price action patterns can appear on your regular Forex charts, they can also show up on the line break chart. Examples include formations like ascending and descending triangles, the head and shoulders pattern, and so forth. These patterns may offer you additional setups to get in on breakouts.
Combine with other indicators
While some indicators are out of context and not applicable when using the line break chart, others do work with it. You can utilize these indicators as part of a line break chart strategy to plan your trades. For example, you can add a moving average to a line break chart, but you have to make sure that it's calculated based on the line break chart data rather than the classic chart data. The same goes for other indicators.
Key point: The line break chart offers tremendous versatility for Forex traders. You can use it to make sense of market context and identify opportunities to buy and sell an asset when a classic chart is whipsawing.
General tips for using the line break chart
Here are some useful points to keep in mind when you are using the line break chart in Forex trading.
- Remember that in MT4, for example, the main chart window has dates and times at the bottom that are relevant to the regular price chart, not the line break chart, which is not based on time. If you have software that does have native support for the line break chart (like TradingView), you would see dates and times at the bottom as well, but their distribution would be uneven.
- Regular indicators may not work correctly with the line break chart. Remember, they were designed for normal price charts, which are created differently than the line break chart. But there are still indicators that can be used with line break charts, so a variety of strategies are possible using this type of chart.
- If you see up lines and down lines alternating frequently on the line break chart, there are no strong trends. You are looking at a market with strong reversals, and you will need to wait out those conditions until there is a chance to trade a breakout.
- As always, be sure to thoroughly test out any trading method you develop using the line break chart in demo mode before you use it for live trading with real money.
Key point: The line break chart takes some time getting used to; it looks similar to a regular chart, but you must never forget that it is built and functions differently.
Conclusion
The line break chart is a Japanese indicator that has gone somewhat overlooked in the western world. For that reason, you may not have much experience using it, and your charting software may not even include it.
But adding the line break chart to your charting platform can be well worth it. You will appreciate being able to view what is taking place with price with less noise, as well as the impressive versatility of this tool for spotting breakouts, support and resistance areas, and more.
If you want to get news of the most recent updates to our guides or anything else related to Forex trading, you can subscribe to our monthly newsletter.