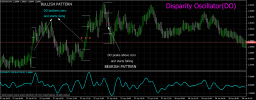
Disparity Oscillator is VertexFX indicator that is useful in identifying trend exhaustion and reversals.
The Disparity Oscillator (DO) uses a variation of the Relative Momentum (RM) indicator and the relative change in price to identify whether the current trend is still strong or is nearing exhaustion. Unlike the RM oscillator, the DOuses ananchor bar to calculate the relative momentum which is subsequently aggregated. The following steps are employed to calculated the DO,
a) In the first step we calculate the Disparity Period, which is 1.5 times the input PERIOD, rounded to the nearest integral value. The bar which is Disparity Periodcandles prior to the current (calculated) candles is termed as the Anchor Bar. Assuming the PERIOD is set to 10, then the Anchor Barvalue is 15.
b) In the second step we subtract the current Close from the Close of the Anchor Bar, and divide this by the Close of the Anchor Bar. This is called the Disparity Ratio.
c) This process is repeated for the recent PERIOD candles. Here, it should be noted that the Close of each candle is subtracted from the same Anchor Bar, which is DisparityPeriod candles ago for the current candle.
d) Finally, the sum of all the Disparity Ratios is calculated and divided by PERIOD to derive the DO value.
As the price and momentum slows down, the DO peaks (or bottoms) out in the direction of the trend. This indicates that the market has exhausted and the likelihood of a reversal is very high. As the price starts to move in the opposite direction the DO reverses thereby identifying a bullish or bearish setup.
The DO is a bounded oscillator with a range of -100 to +100. Values above zero are considered bullish and values below zero are considered bearish. Whenever the DO peaks and starts falling, the probability of price falling (bearish) is very high. When the DO bottoms out and starts rising it implies beginning of a bullish trend and the probability of price rising is very high.
Ideally, the DO should be used in conjunction with other trending or oscillator indicators like MACD or Stochastic Oscillators. The trading rule of thumb for using the DO is,
a) LONG – Enter LONG when the DO has bottomed out (two falling DO values, followed by two rising DO values) below zero. The stop-loss can be placed below the nearest Swing Low.
b) SHORT – Enter SHORT when the DO has peaked out (two rising DO values, followed by two
falling DO values) above zero. The stop-loss can be placed above the nearest Swing High.
https://www.hybridsolutions.com/plugins/client-vtl-plugins/free/disparity-oscillator-.html

