Sharing My Secret Trend Reversal Strategy with an 80% Win Rate

shanmugapradeep

Active Trader
Dec 18, 2020
131
7
34
39
Hello, I am sharing my strategy, which I am using for manual trading, and I am planning to build an EA based on this strategy soon. This strategy works for all currency pairs and timeframes, but the recommended timeframes are M1, M5, M15, and M30.

This strategy is currently giving me an 80% win rate, tested for almost three months. However, I am still experiencing minimal losses because a single losing trade wipes out the profits from 10 winning trades. I am in loss not because of my technical analysis settings but due to poor money management, risk management, and risk-to-reward ratio.

In this strategy, we use the RSI, Bollinger Bands, and Moving Average indicators:

  • RSI is used to identify overbought/oversold conditions.
  • Bollinger Bands help determine resistance/support levels.
  • Moving Averages are used to identify trend direction.

Buy Trade Setup:​

  1. RSI (Period 14) > 80 → Overbought condition.
  2. Current market price touches the Bollinger Bands (Period 30, Deviation 2) Upper Band/Resistance Line.
  3. Current market price is above the 200 EMA (High Price).
If all three conditions are met, take a buy trade.

Sell Trade Setup:​

  1. RSI (Period 14) < 20 → Oversold condition.
  2. Current market price touches the Bollinger Bands (Period 30, Deviation 2) Lower Band/Support Line.
  3. Current market price is below the 200 EMA (Low Price).
If all three conditions are met, take a sell trade.
These settings provide very few signals per day—just 2-3 per currency pair.

Alternative Settings for More Signals​

If you need more signals, you can adjust:
  • Bollinger Bands to Period 20, Deviation 2 (default settings).
  • 200 EMA based on Close Price instead of High/Low Price.
With these settings, you can get 5+ signals per day, but the win rate decreases to 70%.

Why Am I in Loss?​

I set my Take Profit (TP) to 100 and Stop Loss (SL) to 500. With a lot size of 0.01, I make $1 per winning trade. However, even if I win 5 trades and lose 1, my losing trade wipes out all my profits.

Example:
  • 8 winning trades (0.01 lot, 100 TP) = $8 profit
  • 2 losing trades (0.01 lot, 500 SL) = $10 loss
Even with a high win rate, my poor risk management keeps me in loss. I tried lowering the SL, but that significantly reduced the win rate, leading to even more losses.

I am sharing this strategy so you can try it as well, provide feedback, and share any ideas, new settings, or money management strategies.

Thank you!
 
the 200 ema is a good idea.....

you might want to give a second thought to buying in an over-bought and at resistance situation ..... or selling in an over-sold and at support situation.....

some might do the opposite...... of course your testing shows it will work sometime, and even without testing we know it will...... it's the other times that pull the rug......

the large stoploss is allowing you ride thru the first drawdown which hopefully will be followed by another move in the right direction.....

overbought, oversold , resistance and support lose some of their predictive value in a trending market.....
//-----

Why Am I in Loss?

perhaps try.....

Buy Trade Setup:​


RSI (Period 14) < 20 → Oversold condition.
Current market price touches the Bollinger Bands (Period 30, Deviation 2) Lower Band/Support Line.
Current market price is above the 200 EMA (High Price).


Sell Trade Setup:​

RSI (Period 14) > 80 → Overbought condition.
Current market price touches the Bollinger Bands (Period 30, Deviation 2) Upper Band/Resistance Line.
Current market price is below the 200 EMA (Low Price).


//-------

consider adding higher timeframe confirmations in your conditions...... in other words, if your trading the 1 minute, consider the 5 , 15 and 30 charts direction as added verification......

there is safety in numbers......h
 
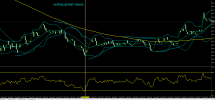
it helps me to write a indicator which will plot a vertical line at each signal matching the trade system rules...... imagine being able to scroll backwards and have every buy or sell signal clearly marked......

in the first chart below, the vertical yellow line is your sell trade setup conditions......

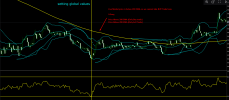
also, just as useful, consider writing a indicator which shows the higher timeframes conditions...... so on a 1 minute chart you can see in an accurate bar by bar representation of the higher timeframes at each 1 minute bar.......

the second chart still has your sell conditions but also a multi timeframe display for higher timeframe confirmation or not......

mq4 uses ibarshift........h
//------

Screenshot 2025-04-04 215236.png

//-----

Screenshot 2025-04-04 215151.png
 
consider adding higher timeframe confirmations in your conditions...... in other words, if your trading the 1 minute, consider the 5 , 15 and 30 charts direction as added verification......
I have already tried, if 2 timeframe match same condition take a trade but with 2 timeframe, i am getting 1 signal in 2-3 days.


it helps me to write a indicator which will plot a vertical line at each signal matching the trade system rules......
Can you share MQL4 Indicator source code?.

I myself tried to make indicator based on my strategy but i have never coded indicator before, it always giving me an error.

My Indicator Code :

MQL4:
//+------------------------------------------------------------------+
//| Custom Indicator based on RSI, Moving Average, and Bollinger Bands |
//+------------------------------------------------------------------+
#property indicator_chart_window
#property indicator_separate_window
#property indicator_buffers 5
#property indicator_color1 Red
#property indicator_color2 Blue
#property indicator_color3 White
#property indicator_color4 Green
#property indicator_color5 Red
 
 
input int RSI_Period = 14;
input double OverBought = 70;
input double OverSold = 30;
input int MA_Period = 50;
input int BB_Period = 20;
input double BB_Deviation = 2.0;
 
// Indicator Buffers
double SellSignalBuffer[];
double BuySignalBuffer[];
double RSI_Buffer[];
double MA_Buffer[];
double UpperBB_Buffer[];
double LowerBB_Buffer[];
 
//+------------------------------------------------------------------+
//| Custom indicator initialization function                         |
//+------------------------------------------------------------------+
int OnInit()
{
   IndicatorBuffers(5);
   SetIndexBuffer(0, SellSignalBuffer);
   SetIndexBuffer(1, BuySignalBuffer);
   // RSI should be in a separate window
SetIndexBuffer(2, RSI_Buffer);
   SetIndexBuffer(3, MA_Buffer);
   SetIndexBuffer(4, UpperBB_Buffer);
   SetIndexBuffer(5, LowerBB_Buffer);
 
   SetIndexStyle(0, DRAW_ARROW);
   SetIndexArrow(0, 233);
   SetIndexStyle(1, DRAW_ARROW);
   SetIndexArrow(1, 234);
 
   SetIndexStyle(2, DRAW_LINE, STYLE_SOLID, 2);
SetIndexLabel(2, "RSI");
PlotIndexSetInteger(2, PLOT_DRAW_TYPE, DRAW_LINE);
   SetIndexStyle(3, DRAW_LINE, STYLE_SOLID, 2);
SetIndexLabel(3, "Moving Average");
   SetIndexStyle(4, DRAW_LINE, STYLE_SOLID, 2);
SetIndexLabel(4, "Bollinger Bands Upper");
   SetIndexStyle(5, DRAW_LINE, STYLE_SOLID, 2);
SetIndexLabel(5, "Bollinger Bands Lower");
 
   IndicatorShortName("RSI BB MA Indicator");
 
   return(INIT_SUCCEEDED);
}
 
//+------------------------------------------------------------------+
//| Custom indicator iteration function                              |
//+------------------------------------------------------------------+
int OnCalculate(const int rates_total, const int prev_calculated,
                const datetime &time[], const double &open[],
                const double &high[], const double &low[], const double &close[],
                const long &tick_volume[], const long &volume[], const int &spread[])
{
   if (rates_total < MA_Period || rates_total < BB_Period || rates_total < RSI_Period)
      return 0;
 
   for (int i = prev_calculated; i < rates_total - 1; i++)
   {
      double rsi = iRSI(NULL, 0, RSI_Period, PRICE_CLOSE, i);
      double ma = iMA(NULL, 0, MA_Period, 0, MODE_SMA, PRICE_CLOSE, i);
      double upperBB = iBands(NULL, 0, BB_Period, BB_Deviation, 0, PRICE_CLOSE, MODE_UPPER, i);
      double lowerBB = iBands(NULL, 0, BB_Period, BB_Deviation, 0, PRICE_CLOSE, MODE_LOWER, i);
 
      double ask = SymbolInfoDouble(_Symbol, SYMBOL_ASK);
      double bid = SymbolInfoDouble(_Symbol, SYMBOL_BID);
 
      // Store indicator values
      RSI_Buffer[i] = rsi;
      MA_Buffer[i] = ma;
      UpperBB_Buffer[i] = upperBB;
      LowerBB_Buffer[i] = lowerBB;
 
      // Sell Condition
      if (rsi > OverBought && ask < ma && bid > upperBB)
         SellSignalBuffer[i] = ask;
      else
         SellSignalBuffer[i] = EMPTY_VALUE;
 
      // Buy Condition
      if (rsi < OverSold && bid > ma && ask < lowerBB)
         BuySignalBuffer[i] = bid;
      else
         BuySignalBuffer[i] = EMPTY_VALUE;
   }
 
   return(rates_total);
}

Reference from your screenshot :

1743823896464.png
 
I have already tried, if 2 timeframe match same condition take a trade but with 2 timeframe, i am getting 1 signal in 2-3 days.


Can you share MQL4 Indicator source code?.


Reference from your screenshot :
//-----

the chart is marking your sell trade conditions from your original post......

Sell Trade Setup:

  1. RSI (Period 14) < 20 → Oversold condition.
  2. Current market price touches the Bollinger Bands (Period 30, Deviation 2) Lower Band/Support Line.
  3. Current market price is below the 200 EMA (Low Price).
If all three conditions are met, take a sell trade.
//------

the price is below the 200, rsi is below 20 and bollinger is touching the lower support band..... the yellow line marks the sell signal.... your selling in a oversold condition at support......

your system is following the "cave in" concept..... it only works if the traders cave in......

the cave in concept relies on the thought that in oversold conditions, long positions give up and cave in...... they sell their long positions driving down the market down further.....

in overbought conditions, it relies on short positions caving in and covering their shorts which drives the market higher.....

it's a valid concept but the risk to reward is terrible...... that's why your stoploss is so large compared to profit target.....
//----

i'm only coding mq5 now...... when i moved to mq5 i bought all new computers...... i don't even have a mq4 platform on these computers now, nor do i have an account with anyone that carries mq4..........

somewhere in my attachments should be actually what your looking for..... this link might show my attachments, look far back for mq4...... i always post the source code......

//-----

I have already tried, if 2 timeframe match same condition take a trade but with 2 timeframe, i am getting 1 signal in 2-3 days. yes, that's often the case.....

the exact same conditions don't have to match on the higher timeframes...... the higher timeframes momentum type indicators and moving averages should match..... this somewhat verifies the trends.....

//------
try to code in the absolute simplest terms......

if you can't write the entire thing in your mind, make it simpler.....h