The Trend

Magician

Master Trader
Jun 2, 2010
30
1
69
Hi, this is my 1st post, 🙂

At the mo at the Demo level, regarding Forex Trading,
However I have a Q, to ask
Finding the trend, I check the Mthly, Wkly, evn the Daily, I input a EMA 20, but still I have my doubts, for instance Mthly Candle is Down, Ema Down, Wkly Candle is Up but with the EMA on the downward slope, Daily is Up EMA slightly Down Sloping.
Do I go with the Candles, and that would add there own problems, or do I go with the EMA sloping Downward.
This might be a daft question, but it is doing my head in 😡

Thanx In advance..
🙂
 
Thanx Enivid,

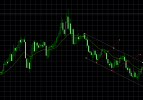
I have attached a picture of an example, I have used EMA 10 (Red), 20 (Yellow), 50 (Orange), 200 (Pink),
As you see there all down-trending in order, and that the trend according to the EMA is down, yet the Mthly Candle is up.

You read Trend Is Your Friend, only if you can find it 🙂

Lagging EMA, but if you look at the mthly Candles in general some are upward some are downward, yet the EMA is always downward (in the attached picture)
Do I go with the mthly candle for the trend, or the ema for the trend,
am I the only one confused with this ?

Again many Thanx
 

Attachments

  • USJY.jpg
    USJY.jpg
    59.1 KB · Views: 15
Last edited:
From your picture it can be easily said that the candles showed downtrend 4 periods before the EMAs crossed.

Thanx for your time, it's appreciated. 🙂

I guess what I am asking is should I go with the general view, I.E. EMA or do I go with the Mthly Candle, I understand the EMA are lagging, but when I see the up and down of the candles and in general the trend seems to be (in this case) down, I don't know what to look at, the candles or the ema.😕
Good point regarding 4 periods after the fact.
It would make perfect sense to go with the mthly candle after all it's where we are at the mo, then I read that you can find the trend using the "EMA formula" and this is where (for me) it went tits up. 🙁

Again Thanx
 
Do you apply EMAs to a monthly chart? Or do you apply them to some lower timeframe chart and then check the trend on the monthly chart by one candle? If second, then it's a rather crazy thing to do.

Nope, to both, all I am trying to do is read correctly the Trend direction, and finding is all a bit confusing, if you read the candle then the trend is up, yet over-all the trend is down, do you infact just read the chart in general seeing the over all trend is down thus the trend is then down, even though the forming candle says it up.
The "in general" reading would conform to the EMA's

Envid, re-reading this has confused me 😀
 
If you use a single timeframe then it's more accurate to detect trends by watching candles than watching EMAs. Of course, the trend isn't detected by watching just one (1) candle, you have to watch the chart and look for the properties of the trend - higher highs, lower lows, etc.
 
Trade with a bias direction using conflunces. use the conflunces on multitimeframe. m1-15-m30-h1-h4. only trade in direction of bias.
Draw equidistant channel and when that is pointing in bias direction. Enter trade on corrective moves with in the channel

M1.png
 
Last edited:
Bitcoin m1. if you look closely. You will see the impulse wave on the left becomes corrective and the corrective move become an impulse one. Change of direction on bitcoin. nice if this is in your bias direction. Also on the red trend lines. you can have a trend line ea attached on them diagaonals. entering a trade when price action crosses it. loads of ways i like using bots to negate the psychology
Great setup. Did you find the bot handles trendline breaks better than manual entries?
 
Great setup. Did you find the bot handles trendline breaks better than manual entries?
100 percent. It not only negates the psychology but also gives you precision and the breaks can be customised by a bot. Like sell on touch. Sell on break out (pip or close of candle) Sell on fake break out ect ect
 
Last edited:
  • 👍
Reactions: David79
I will tell anyone that will listen. Use ATR for risk management but learn to use it properly. You will never move your stop loss ever again in anger or emotion 😉 If scalping NERVER EVER move your stops. No trailers NOTHING. work it out then set using ATR values from different TIMEFRAMES or just a simple 1:1 set up. EXAMPLE. Gold could be M1 ATR trading m1 trends but Bitcoin could be M10 ATR trading m5 trends because of the spread
 
Last edited:
100 percent. It not only negates the psychology but also gives you precision and the breaks can be customised by a bot. Like sell on touch. Sell on break out (pip or close of candle) Sell on fake break out ect ect
it is correct! Automation can take the emotional side out and give more precision. Have you tried using bots for different strategies like fake breakouts?
 
it is correct! Automation can take the emotional side out and give more precision. Have you tried using bots for different strategies like fake breakouts?
Bots that trade breakouts imo are one of the best because they capture periods of high volatility which usually feature higher short-term returns though price moves becomes more erratic. The latter however still can be compensated by stricter money management.
 
  • 👍
Reactions: David79
Bots that trade breakouts imo are one of the best because they capture periods of high volatility which usually feature higher short-term returns though price moves becomes more erratic. The latter however still can be compensated by stricter money management.
Interesting! Do you find it tricky sometime to fine tune it for false breakouts?
 
I will tell anyone that will listen. Use ATR for risk management but learn to use it properly. You will never move your stop loss ever again in anger or emotion 😉 If scalping NERVER EVER move your stops. No trailers NOTHING. work it out then set using ATR values from different TIMEFRAMES or just a simple 1:1 set up. EXAMPLE. Gold could be M1 ATR trading m1 trends but Bitcoin could be M10 ATR trading m5 trends because of the spread
Adding to your point - sticking to the stop loss and not moving them emotionally. This is something I learned that hard way! Do you factor in ATR for take profits too, or is it just for the stop placement?
 
Volatility risk sometimes provides risk, price trends can change in a matter of minutes even in the short term. In my view, stop loss is very important as part of risk management, but the exit point is also an important point that determines the final result.
 
Hi, this is my 1st post, 🙂

At the mo at the Demo level, regarding Forex Trading,
However I have a Q, to ask
Finding the trend, I check the Mthly, Wkly, evn the Daily, I input a EMA 20, but still I have my doubts, for instance Mthly Candle is Down, Ema Down, Wkly Candle is Up but with the EMA on the downward slope, Daily is Up EMA slightly Down Sloping.
Do I go with the Candles, and that would add there own problems, or do I go with the EMA sloping Downward.
This might be a daft question, but it is doing my head in 😡

Thanx In advance..
🙂
It's not a daft question at all! When there are mixed signals, prioritize the higher timeframes for trend direction. If the monthly and weekly EMAs are down, it's likely that the broader trend is bearish, even if the daily shows some upward movement. The daily could be a correction or short-term bounce. Focus on the overall trend and look for pullbacks or reversals to align with it for more reliable setups.
 
Hi, this is my 1st post, 🙂

At the mo at the Demo level, regarding Forex Trading,
However I have a Q, to ask
Finding the trend, I check the Mthly, Wkly, evn the Daily, I input a EMA 20, but still I have my doubts, for instance Mthly Candle is Down, Ema Down, Wkly Candle is Up but with the EMA on the downward slope, Daily is Up EMA slightly Down Sloping.
Do I go with the Candles, and that would add there own problems, or do I go with the EMA sloping Downward.
This might be a daft question, but it is doing my head in 😡

Thanx In advance..
🙂
Hey, welcome to Forex trading! Your question is totally valid—it's tough when multiple timeframes show mixed signals. Here’s the thing: trading with multiple timeframes is about understanding the overall trend and using smaller timeframes to refine entries.

If the monthly and weekly trends are down (with EMA showing downward slopes), that suggests the overall market sentiment is bearish. Even if the daily shows a slight uptrend, it could just be a short-term correction within the larger downtrend.

You might want to focus on the higher timeframes (monthly and weekly) for the broader market direction and use the daily timeframe to find good entry points in line with the overall trend.

It’s not a daft question at all! It’s all about practice, patience, and finding a system that works for you. Keep learning and refining your strategy!