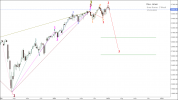
Graphs of changes in quotes of currency pairs, stock prices, index values carry much more information than is commonly believed. Few people know that on the chart you can also see its future dynamics.
The issue of modeling the future dynamics of the value of financial assets (currencies, stocks, indices, raw materials, etc.) by plotting graphs showing possible future dynamics is a cornerstone in the field of financial investment.
In this thread of the forum, I plan to share my thoughts on the future dynamics of the currencies of stocks, indices and other financial instruments for the short, medium and long term after reading their charts.
You can get acquainted with the reading technique by reading the article “When will Dow be Low?”.
In my opinion, the upcoming dynamics of the Dow Jones index for the next 3 months will be downward to the mark of 26,000 points.

Dow Jones, fractal structure (time frame 1 hour / 01/17/2022).
As of 01/17/2022, in the fractal structure on the Dow Jones index chart, the 3rd segment of the fractal is forming, which is indicated on the chart with a 1 hour timeframe in pink.
After this pink fractal is formed, and it will be the 1st segment of the fractal of a higher order, the decrease in the values of the Dow Jones index will continue as part of the formation of the 3rd segment of this fractal, which will begin to form after the 2nd segment.
After this pink fractal is formed, and it will be the 1st segment of the fractal of a higher order, the decrease in the values of the Dow Jones index will continue as part of the formation of the 3rd segment of this fractal, which will begin to form after the 2nd segment.
Dow Jones, fractal structure (time frame 1 hour / 01/20/2022).
As of January 21, 2022, the fractal marked in pink on the chart has completed its formation in the fine fractal structure of the Dow Jones Index chart.
All three segments of the pink fractal are completed.
The 1st segment of the pink fractal is marked with a dark brown fractal.
The 2nd segment of the pink fractal is indicated by the light brown fractal.
The 3rd segment of the pink fractal is indicated by the blue fractal.
Taking into account the existing fractal structure on the chart of the Dow Jones index, built with a time frame of 1 hour, it can be assumed that the fractal marked in pink is the 1st segment of the fractal of a higher order, which is marked in red on the chart.
In this case, with a high degree of probability, we can talk about the continuation of the downward dynamics of the index values within the formation of the 3rd segment of the red fractal.


