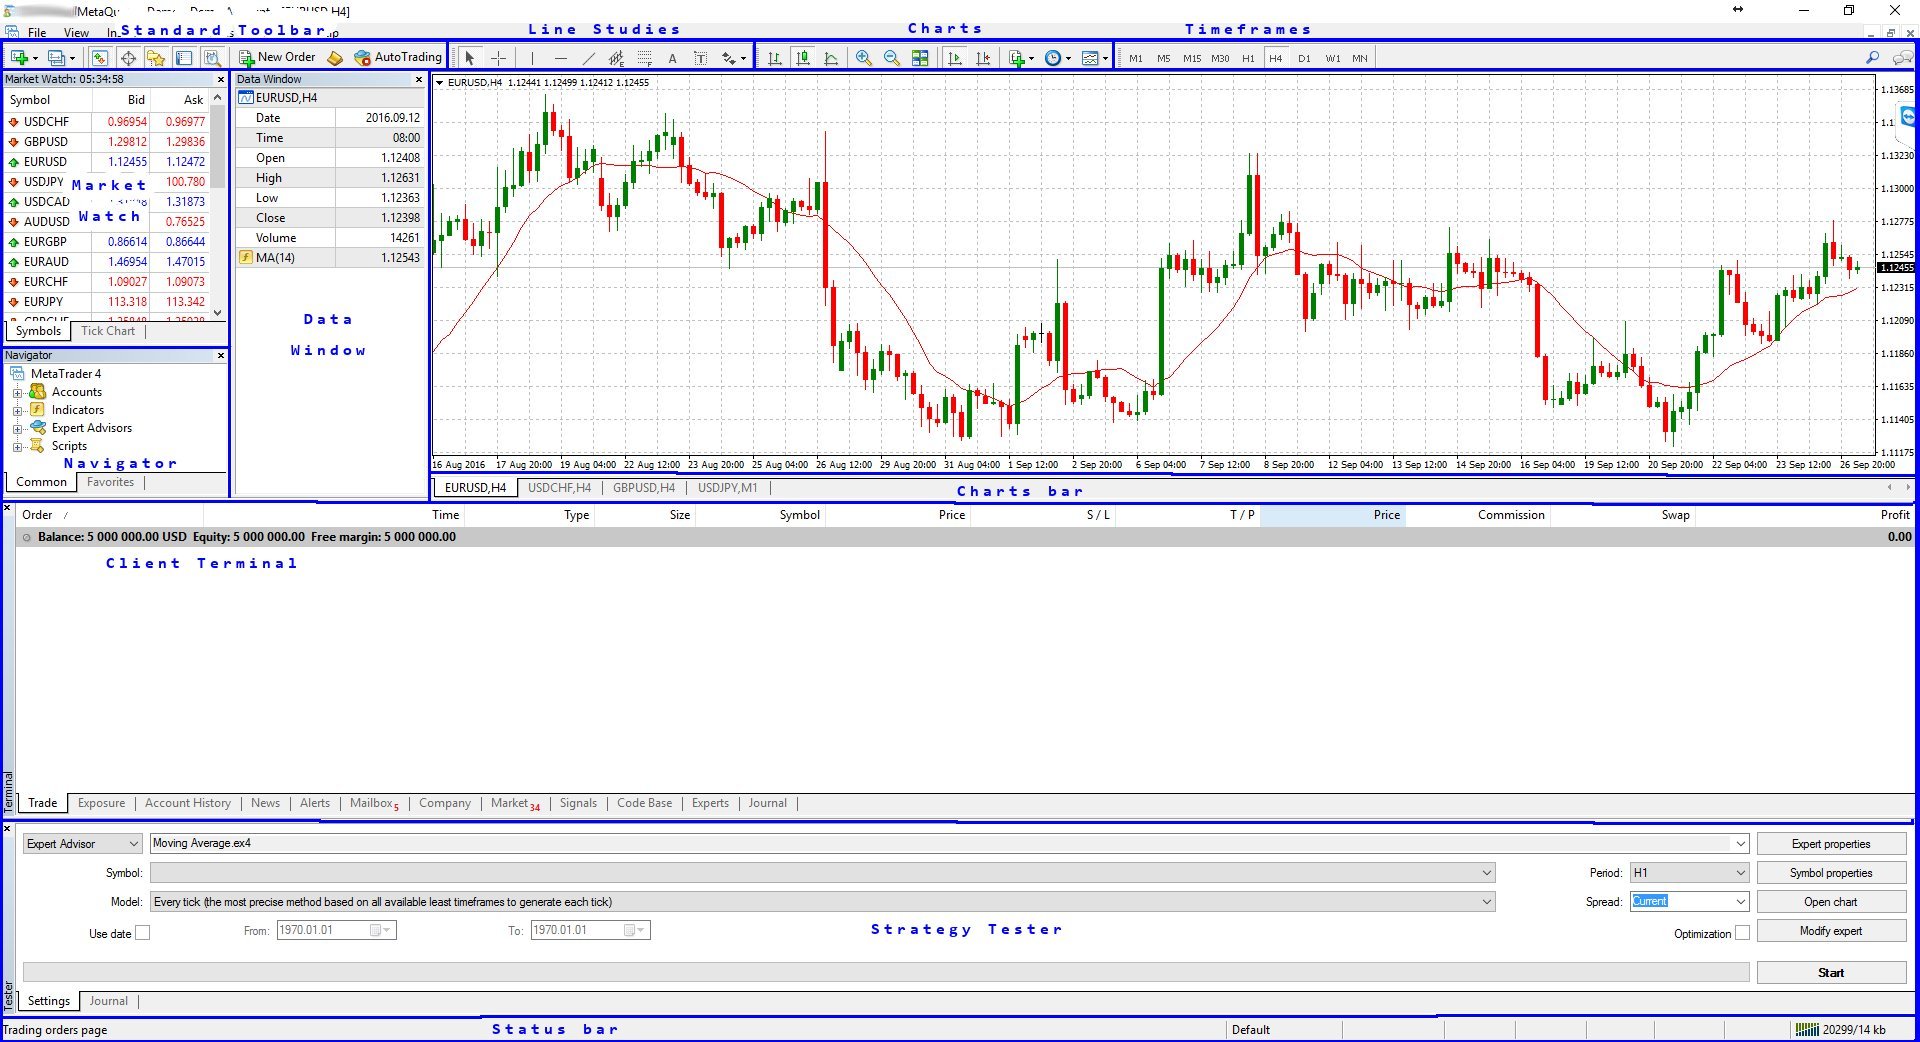
If you are already a trader, you are probably familiar with MetaTrader 4. However, if you are doing your first steps in the trading world, you may find yourself lost with all the sections and buttons present in the MetaTrader window. In this guide, we will introduce, without going into too much detail, several panels available in MetaTrader and their functions.
MetaTrader offers many panels and toolbars and it is very flexible as you can always hide, show, move, and resize these components to suit your needs. To do this, just use the View menu or drag-and-drop panels around, or simply move the borders of the windows. Once you find the layout you like, it will be saved, and you will find everything the same the next time you re-open the software.
Note: This guide is based on the MetaTrader platform downloaded and installed following the How to Install MetaTrader 4 Client Terminal guide.
The toolbars offered in MetaTrader 4 are:
- Status bar
- Charts bar
- Standard
- Charts
- Line studies
- Timeframes
While the panels are:
- Market Watch
- Navigator
- Data Window
- Terminal
- Strategy Tester
- Charts

We can have a quick look at each of the toolbars and panels.
Status Bar
The Status Bar is a very simple bar that shows you whether you are connected to the server, the profile you are using, and, if you hover over a candle, the basic information for that candle: Open, High, Low, and Close prices, volume, and date/time.
Charts Bar
This a basic bar that allows you to jump from one chart to another in case you have multiple charts open.
Standard
From the Standard toolbar, you can enable other windows and frames. You can open MetaEditor, submit a new order, enable or disable AutoTrading.
Charts
Charts is different from the Charts Bar. With this toolbar, you can manage the style of the chart, the timeframe, zoom in, and zoom out, arrange the charts horizontally, vertically, or as tiles.
Timeframes
The Timeframes toolbar could be actually considered as a duplicate because the same function can be done with the Charts toolbar. However, sometimes, it is just quicker to use the Timeframes toolbar to switch between the different timeframes.
Line Studies
A useful toolbar that helps you add some line studies to charts. For example, a trend line or support and resistance lines, and similar.
Market Watch
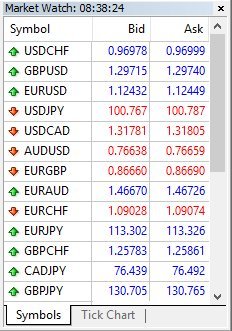
The Market Watch is a panel where you can see the securities that you can trade and their current prices. During trading hours, this window is very dynamic and the prices are continuously changing. You have the option to see the current list of securities or a tick chart for a selected one.

Navigator
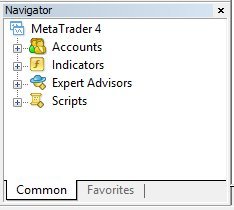
With the Navigator, you can browse you accounts, select which one to connect to, and also browse your scripts, indicators, and expert advisors.

Data Window
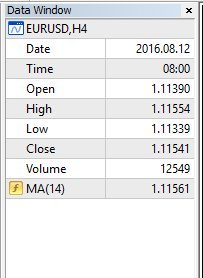
The Data Window is not always used — it is really up to you to use it or not. Some of the information available in it is already available through other tools. The Data Window simply shows the High, Low, Open, Close prices and the values of technical indicators used when you hover on the chart.

Terminal
The Terminal is a very important panel and it is divided in many tabs to keep the information organized. In the terminal, you can find the current list of open trades, trade history, your risk exposure and margin in use, news and messages from the broker, a market to buy additional programs and tools, the actions performed by your expert advisors, indicators, and scripts, a journal to log all the events, a signal section, and more.

Strategy Tester
If your intention is to code and use expert advisors, you will need this panel. The Strategy Tester allows you to test and simulate the behavior of an expert advisor over a determined period of time, showing you the log of its actions and the results of its trades.

As you can see, MetaTrader 4 is a complete suite for trading, and remember, you have the flexibility to show, hide, resize, and reposition its various elements to meet your preferences.