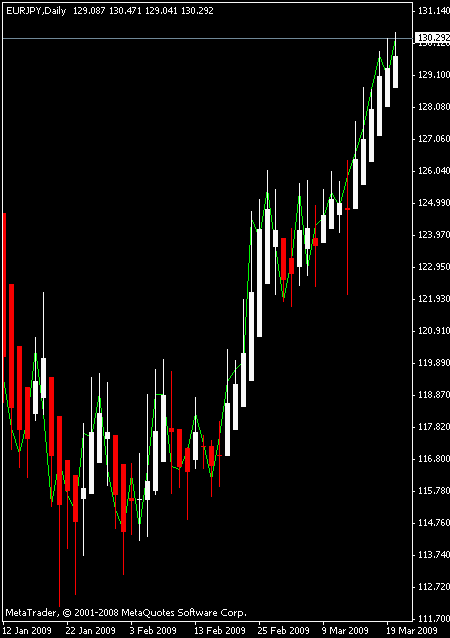
Heiken Ashi (or Heikin Ashi,

As you see, the white bodies are the uptrend candles, and the red bodies are the downtrend candles. The upper shadows are usually absent on the downtrends, while the lower shadows are absent when the trend is going up. There are five Heiken Ashi scenarios for trends:
- The trend is normal. The rising white bodies signal an ascending trend, and the falling red bodies signal a descending trend.
- The trend is getting stronger. The rising longer white bodies with no lower shadows for an ascending trend; the falling longer red bodies with no upper shadows for a descending trend.
- The trend is getting weaker. The candle bodies become shorter and lower shadows occur in an ascending trend. In a descending trend — upper shadows occur.
- The trend consolidation. The small candle bodies with both upper and lower shadows.
- The trend is changing (not a very accurate signal). A very small candle body with long upper and lower shadows.
That is all you have to know to trade on the trends successfully if you are using Heiken Ashi charting method. But I also recommend reading another article on Heiken Ashi if you want to learn more about using the method.