When it comes to analyzing Forex strategies, many traders have no problem understanding probabilities and employing prudent risk management. They know that there is often a
However, two strategies may have the same expected payoff but differ greatly in their risk profile. For example, a strategy with 50% win rate and
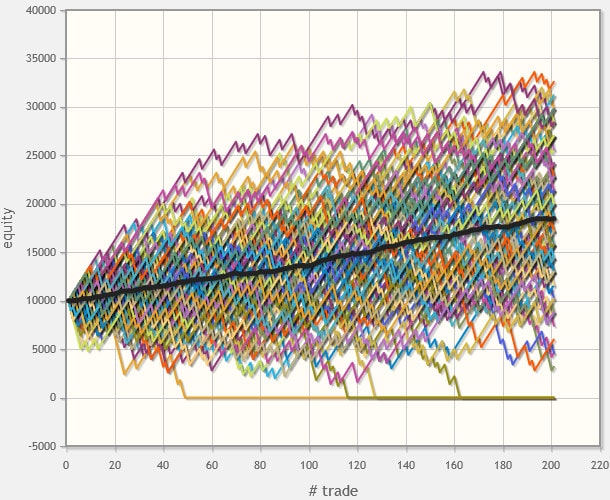
Here is the chart of 100 simulations run on a trading account with a €10,000 starting balance with 50% win rate and 1.1 R/R ratio at €100 risk per trade generated via EquityCurveSimulator.com. Notice that quite a big share of simulations run unprofitable even after 200 trades:

And here is the same simulations chart for a strategy with 75% winning rate and 0.4 R/R ratio (the expected payoff remains the same). Notice the lower average drawdown and a bigger portion of successful simulations:

This behavior depends heavily on the chosen risk profile. With a €10,000 account, a €100 risk is just 1% of the initial balance. If we switch to risking €1,000 per trade, trading with the first strategy (50% win rate) becomes even more dangerous compared to the second one:

The second strategy demonstrates greater resilience when the position sizing becomes very aggressive with fewer simulations ending up in a blown account:

Obviously, a more aggressive risk profile favors higher win rate vs. higher
For example, if your trading strategy is one with a high R/R but low winning rate one, it means that you should size the positions with low risk per trade. Also, if the chance comes by, you should probably switch to a strategy that has a higher probability of winning even if it means a worse
If you want to ask a question on the optimal balance between probability of winning and average win size in a Forex trading strategy, feel free to ask it using our forum.