One of the most important decisions for a trader is what expert advisors and indicators to use during trading. You can try using different advisors on a demo account, but that can be very time-consuming, especially if you want to test many different EAs or you want to test longer-term strategies. Backtesting helps to solve this issue, allowing you to see how the EA or the indicator would perform during a select period of time in the past, up to several years.
What is backtesting?
Backtesting is the process of running an expert advisor or an indicator on historical data to see how it would perform during the specified time period.
It is important to remember, though, that backtesting looks at past events, and past performance does not indicate future performance. If, for example, the EA you tested showed excellent results during backtesting that used the past year's data, that does not mean that the EA will work as well this year.
Pros of MetaTrader 5 backtesting
MetaTrader 5 has several advantages over MetaTrader 4 in regard to backtesting. Among them:
Multi-threaded Strategy Tester. MT5 can utilize multiple processor cores, speeding up backtesting significantly.
Tick-by-tick data. MT5 provides more precise tick-by-tick data, allowing more accurate simulation of real market conditions.
Advanced optimization capabilities. MT5 offers various tools that can help you to optimize your strategy.
Backtesting on multiple timeframes and symbols. While MT4 is limited to the backtesting of just one symbol at a time, MT5 allows the backtesting of several symbols or several timeframes simultaneously.
More detailed report. The backtesting report provided by MT5 includes more data and graphs than the one supplied by MT4.
How to backtest in MetaTrader 5?
To backtest in MetaTrader 5 you need to run Strategy Tester. You can run it from the menu, by choosing
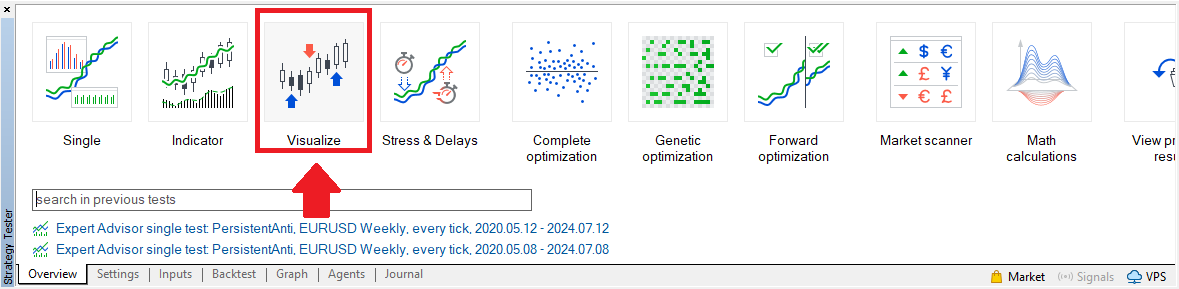
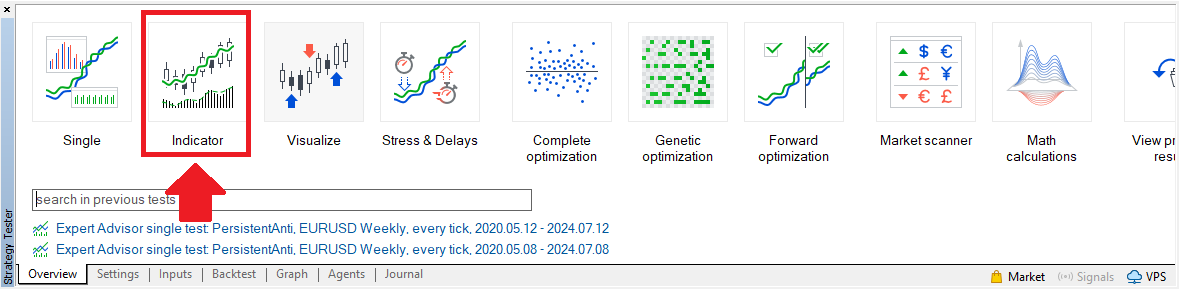
Strategy Tester will open in the Overview tab, which allows you to select among several tests. For simplicity's sake, we will choose the Single simple test.
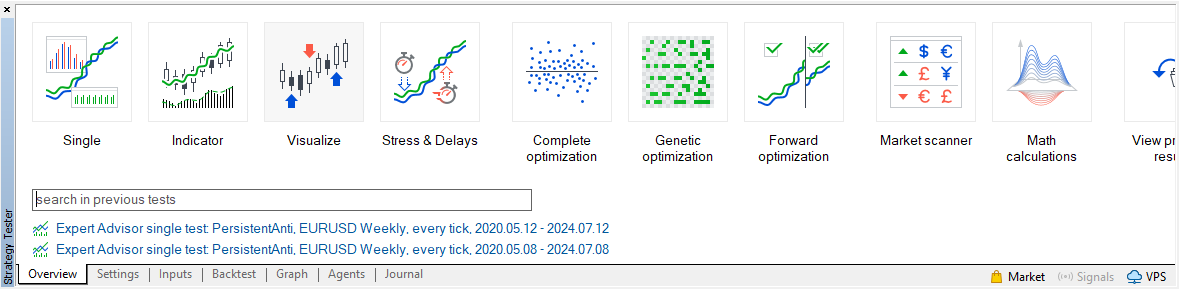
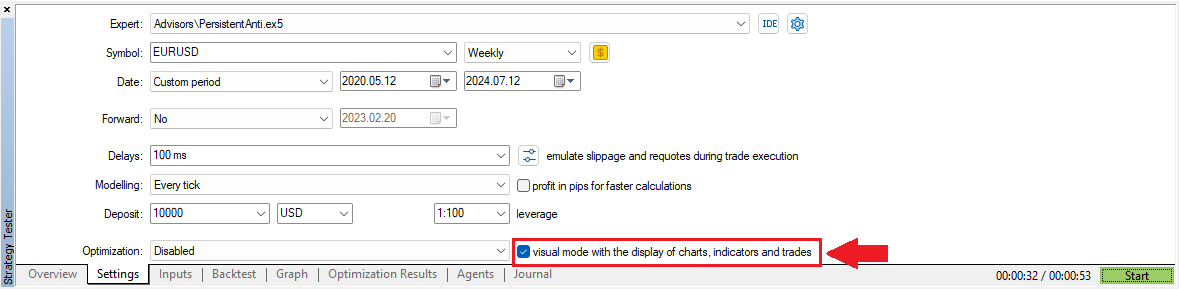
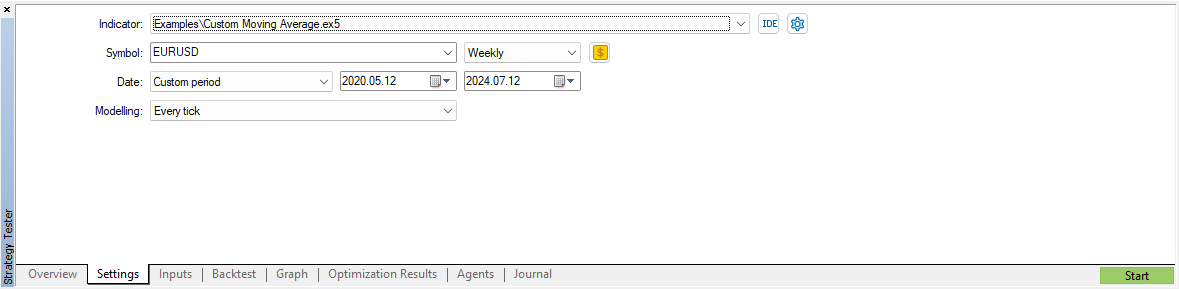
The Settings tab lets you set up various options for testing, including the indicator you want to test, the symbol and the timeframe for testing, the period (the entire historical data, last month, last year, or custom period) for testing, etc. Buttons in this tab allow you to open MetaEditor to check and edit the advisor's code, save and load settings, see the previous backtesting results, open settings for the symbol you are testing, and open additional settings for backtesting.
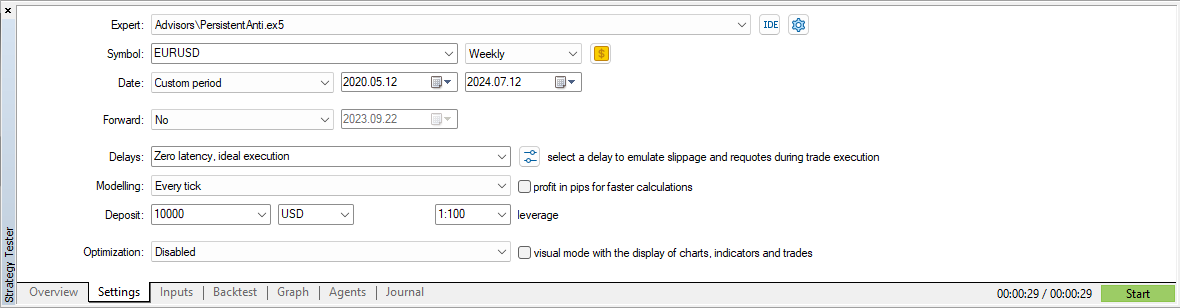
Sometimes traders cannot find such parameters as optimization and the visual mode. This is usually because the Strategy Tester window is too small and its height is not enough to show all parameters at the same time. If that is the case, just scroll down in the Strategy Tester window to see the rest of the parameters.
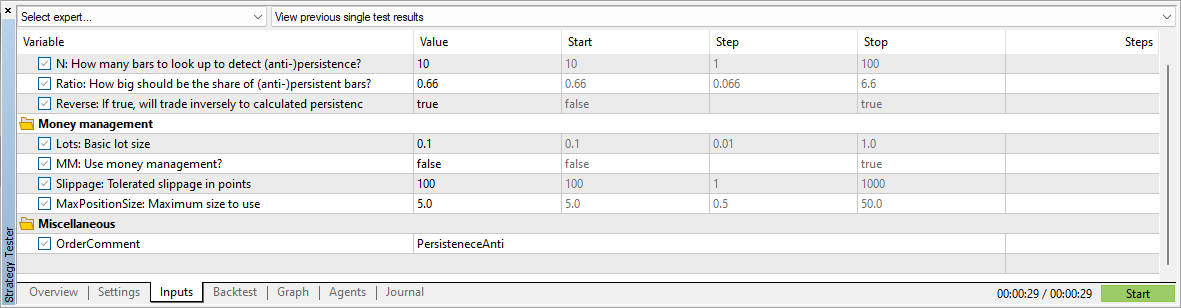
The Inputs tab lets you change the settings of the advisor or indicator you are testing.
To start the test, click the green Start button in the bottom right corner.
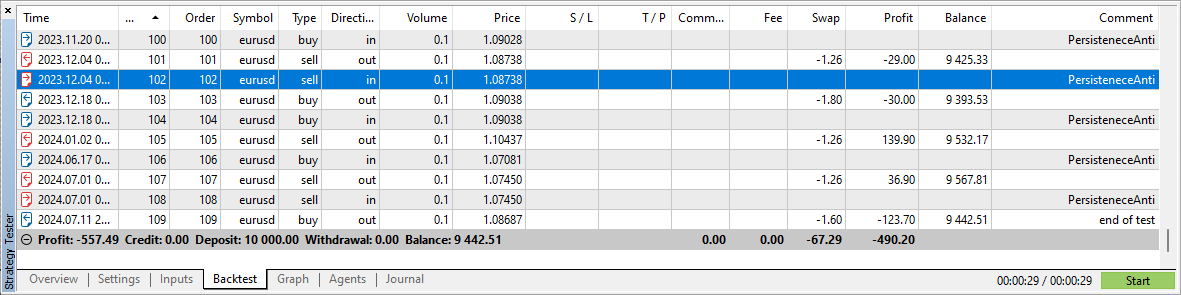
After the test finishes, two more tabs will appear.
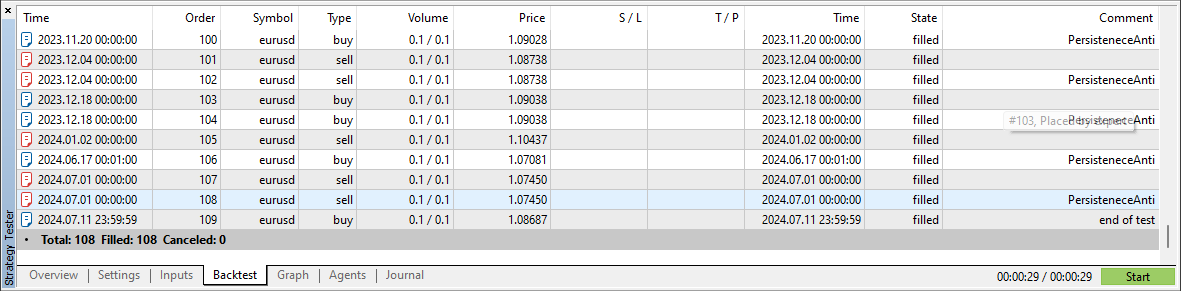
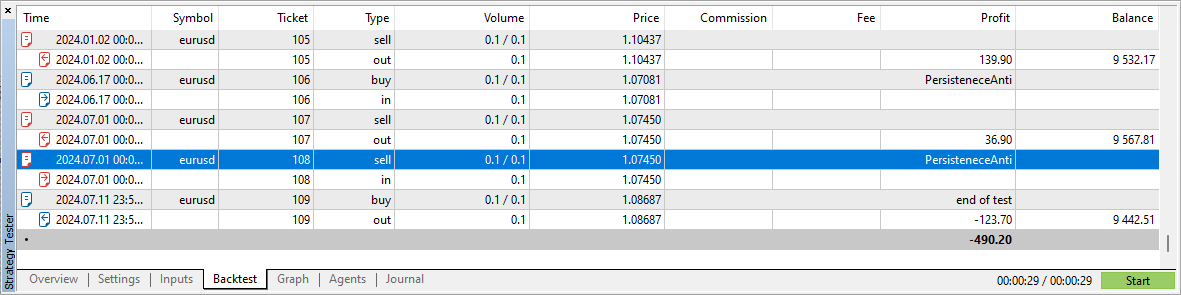
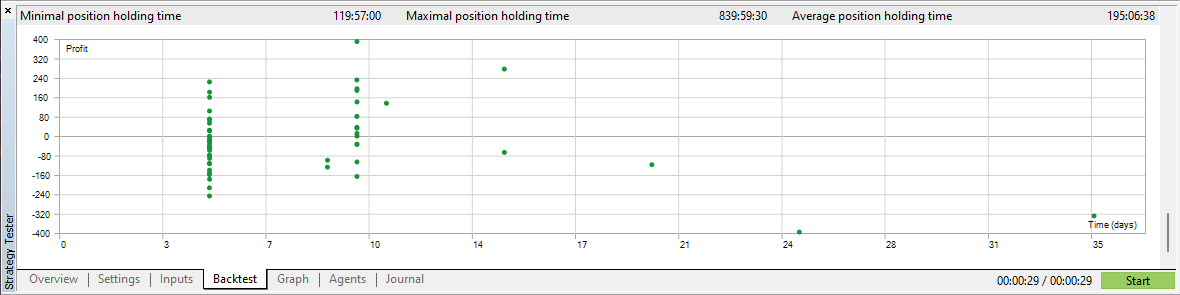
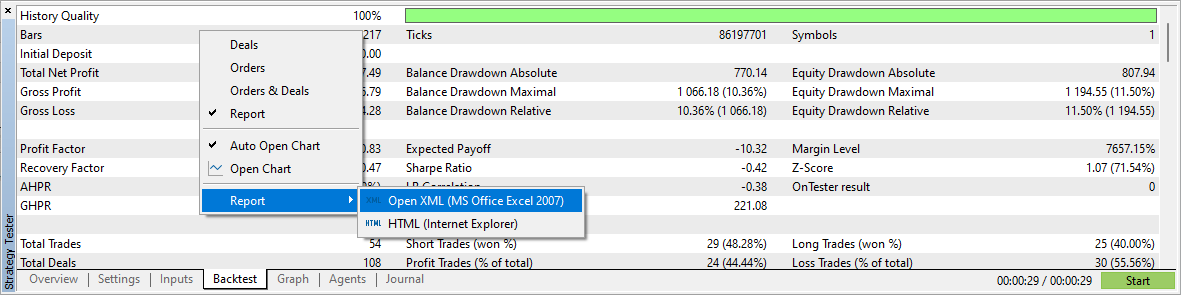
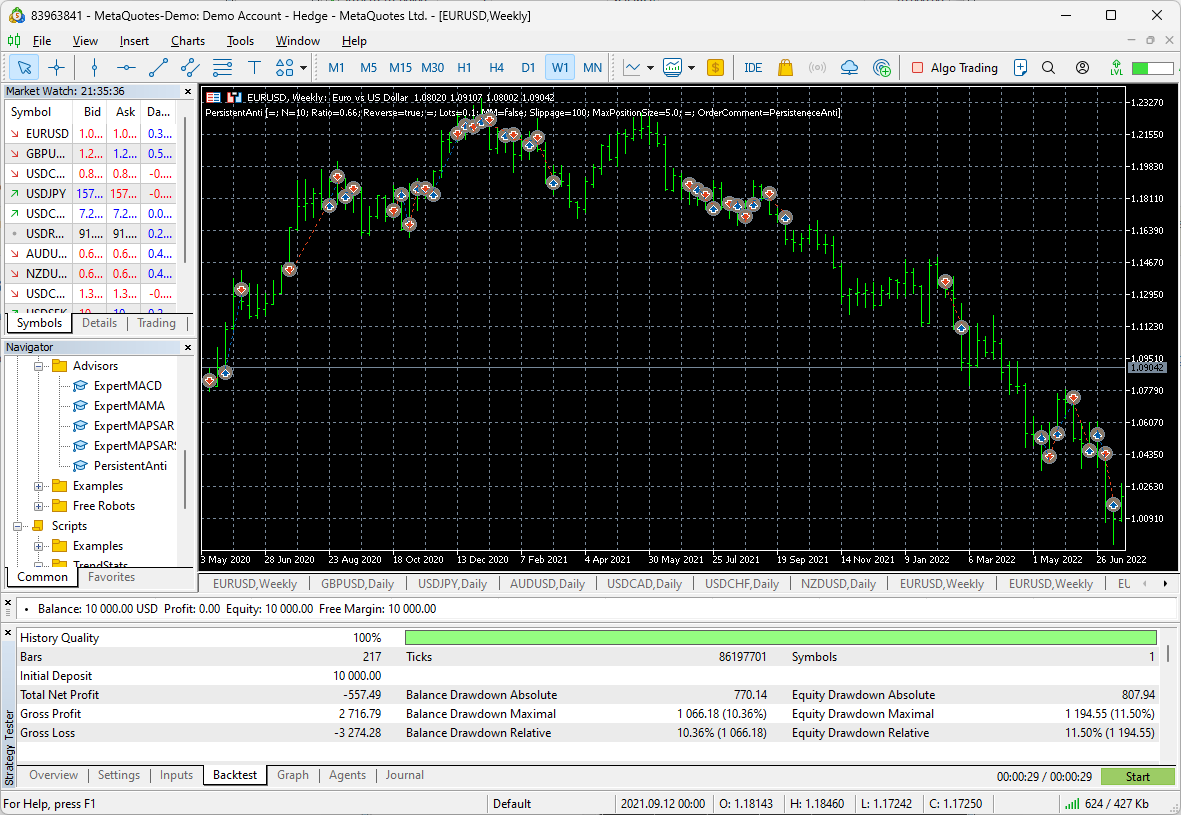
The Backtest tab shows the results of the test. By right-clicking in the tab, you open a menu that allows you to choose what to show in the tab: deals, orders, both deals and orders, or the report.
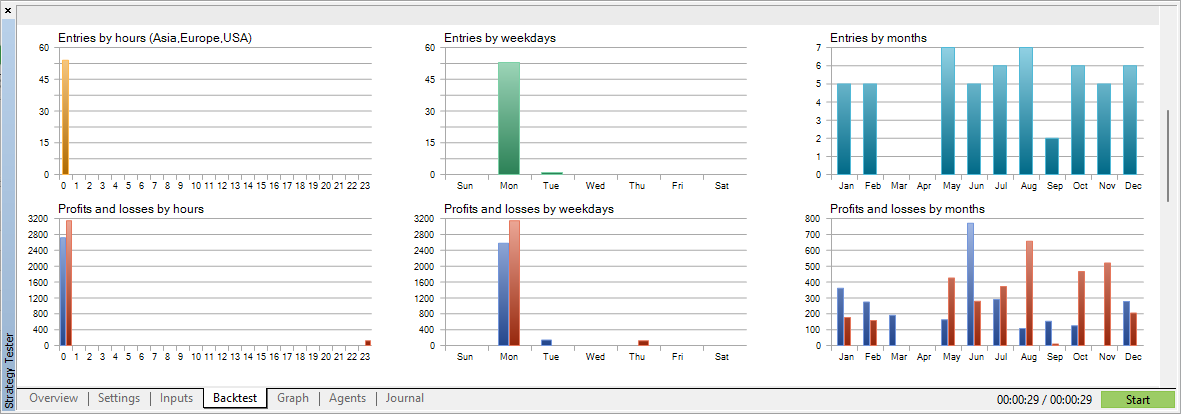
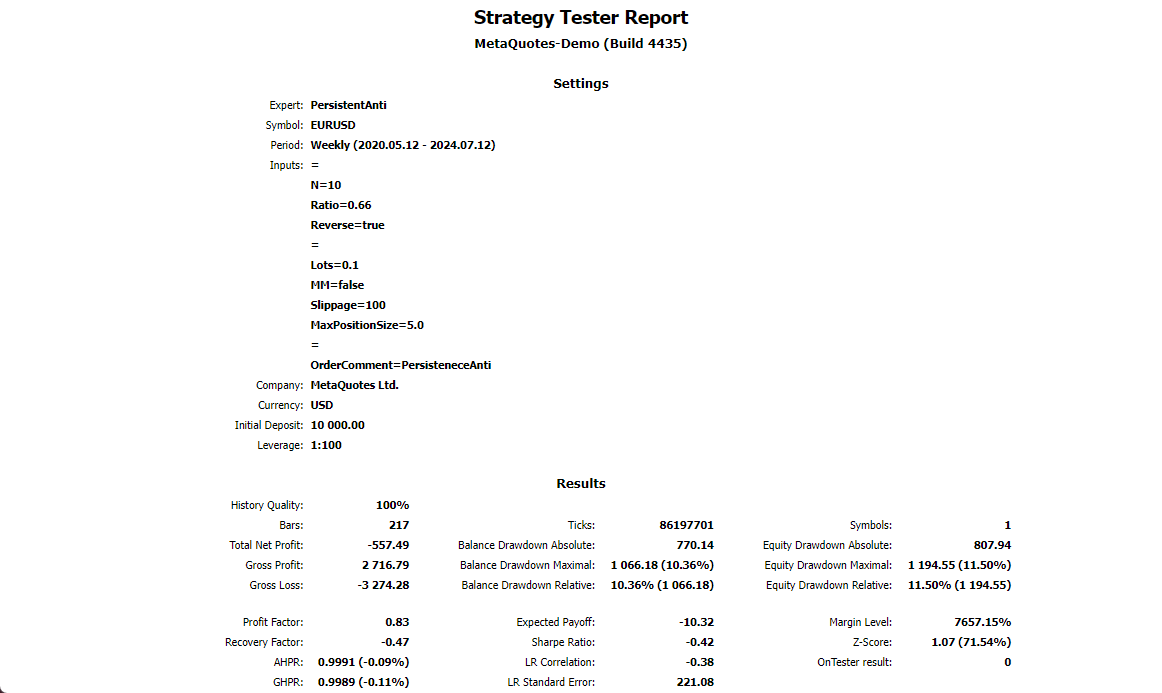
The report will show plenty of data and various charts.
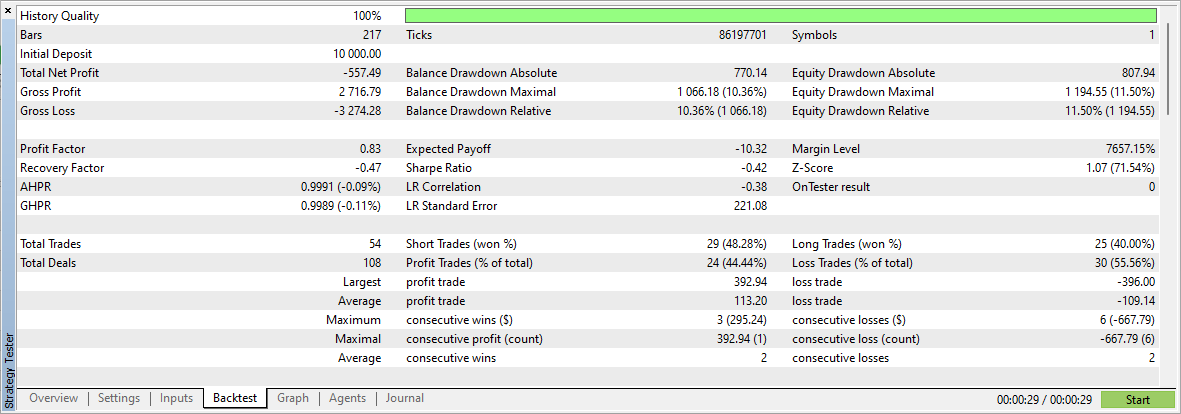
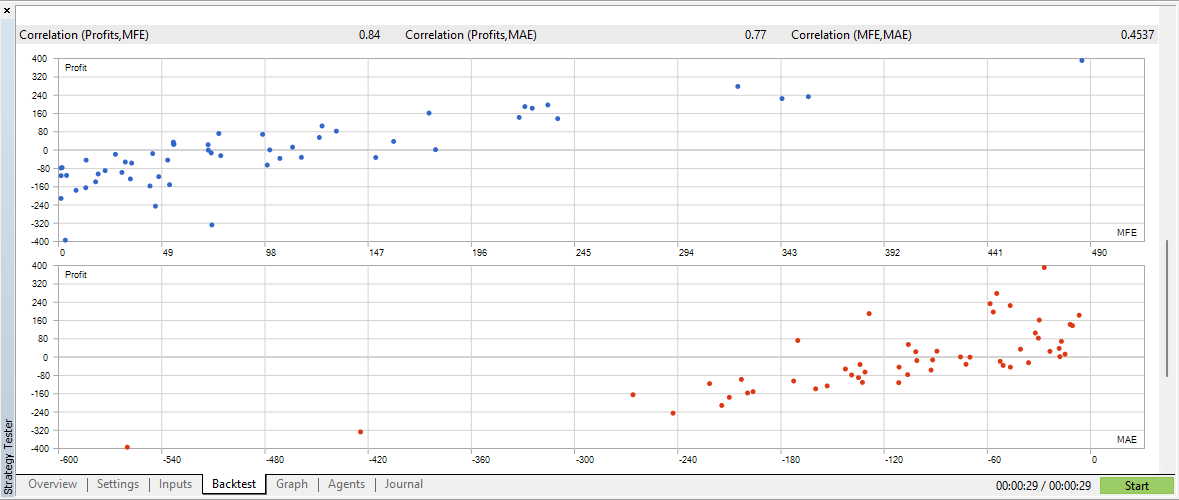
The right-click menu allows you to export the report either as an XML table or as an HTML page. You can use our report analysis tool to gain even more insights regarding your backtesting results.
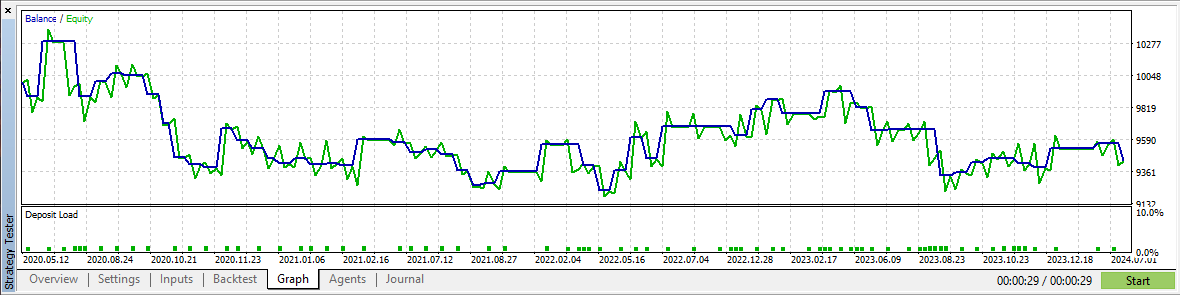
The Graph tab shows you a visual representation of how balance and equity were changing during the trading. You can export the graph by right-clicking and choosing to copy it to the clipboard as a picture, save it to a PNG file as a picture, or to save the data to a text (CSV) file.
Additionally, after the test is finished, a new chart with the Executed Trades Overlay will be opened.
Visual testing
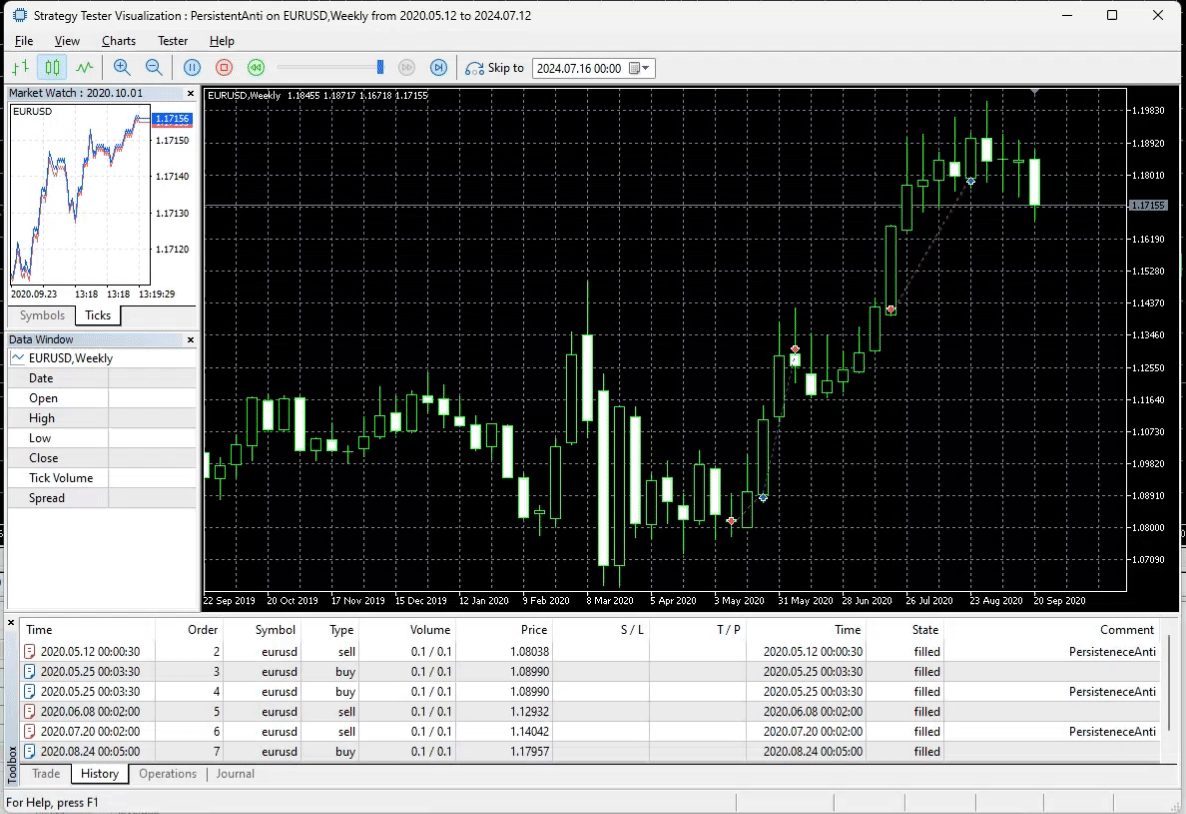
You can see how the expert advisor trades 'in real time' by choosing the Visualize option in the Overview tab or enabling the visual mode with the display of chart, indicators and trades in the Settings tab.
When you start the visual testing, Strategy Tester will open a new window, where you can track how the EA trades. The buttons above the chart allow you to change the chart type, stop, pause, slow down or speed up the testing, as well as to jump to a specific date.
Indicator testing
Indicator testing is somewhat similar to visual testing but is much simpler in terms of parameters you need to set. You need to choose just the indicator, the symbol, the timeframe, the period of testing, and the testing model.
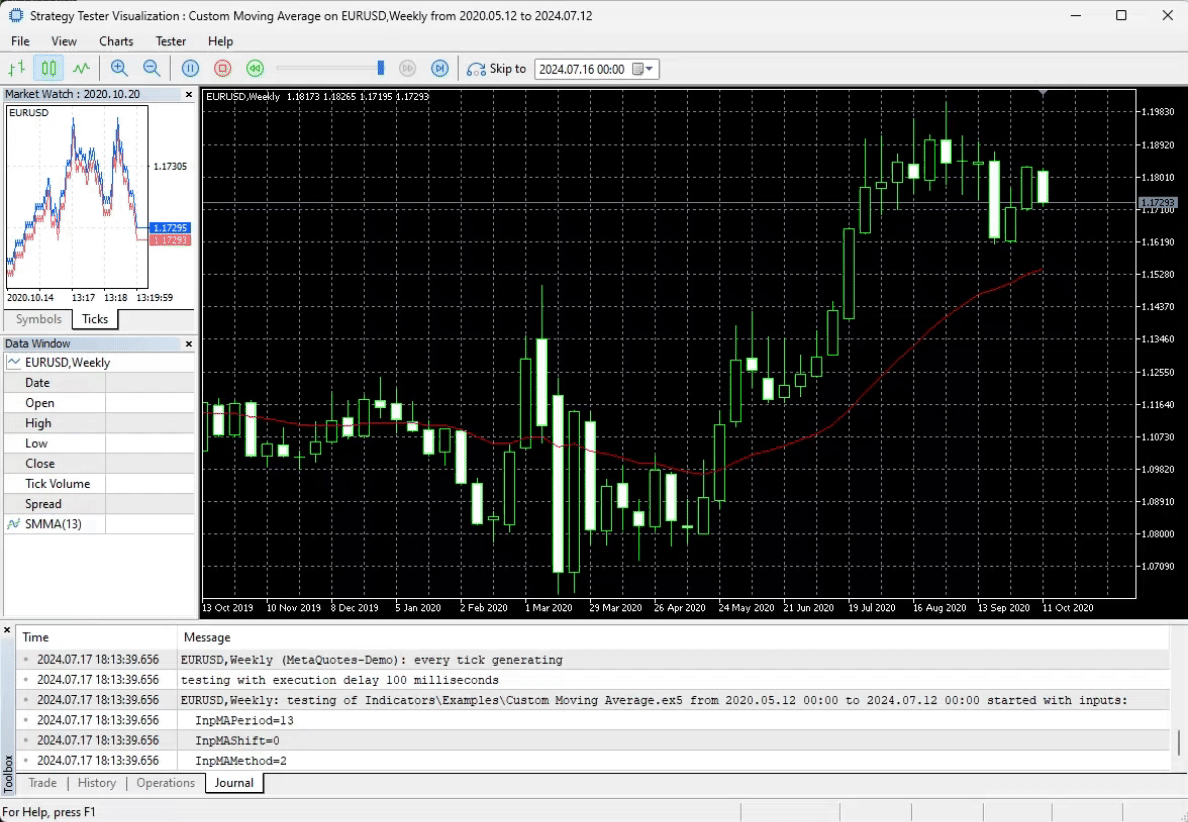
After you start the test, Strategy Tester will open a window similar to the one it opens during visual testing. There, you will be able to see how the indicator behaves over time.
Optimization
One advantage of the Strategy Tester is that you can use to automatically optimize your trading strategy by running it continuously with different combinations of input parameters to find the best ones. You can see how to use the optimization feature in MT5 in this video:
Historical data
The backtest is as good as the historical data it is based on. As was said in the MetaTrader 5 advantages section of the article, MT5 lets you acquire highly accurate tick-by-tick historical data, which can significantly improve the reliability of the backtesting results. Go to the menu View->Symbols, go to the Ticks tab, specify the period, and then Request the data, which you can then export. You should mind the file size as it can be very big if you request data for a long period of time.
Conclusion
Backtesting of strategies and expert advisors is an important step to profitable trading, which no trader should ignore. Strategy Tester is a powerful backtesting tool provided by MetaTrader 5, which has several key advantages over the similar offering by MetaTrader 4. MT5 Strategy Tester is a simple tool if you need just a regular backtest, but it can also be a potent tool if you want to use its additional features, like strategy optimization. Also, remember that the reliability of backtesting results highly depends on the quality of historical data you use for backtesting.
Did you know? You can download a free MetaTrader 5 platform for your backtests from any MT5 broker.