The MetaTrader 4 platform is a powerful trading tool with plenty of useful instruments experienced traders can use. But that can be sometimes a downside.
Nowadays, MetaTrader 4 is ubiquitous and is offered by many brokers, so it is very useful to understand how to clean up a workspace and make your analysis as comfortable as possible in this platform.
Usually, after the initial installation, MetaTrader 4 starts with several charts opened, each of them having at least one indicator attached. That can be overwhelming for a less experienced trader. But even more experienced traders can find that excessive and distracting.
This guide explains how to remove unnecessary elements in few simple steps and make MetaTrader 4 show just a clean chart.
How to close charts
By default, MetaTrader 4 starts with several chart windows opened.
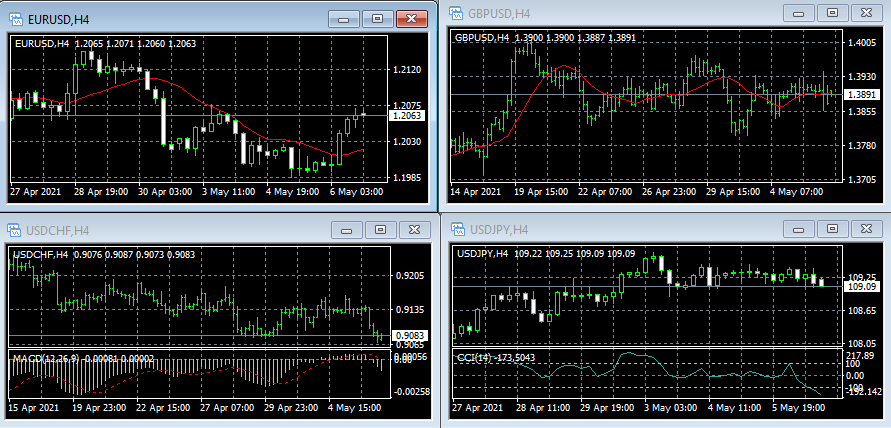
You may want to close some of the charts. To close an unneeded chart window, click on the Close button (X in the top right corner of the chart window). Or you can use the Ctrl+F4 key combination to close the active chart.
Here is an example of the MetaTrader 4 workspace with all but one chart window closed.
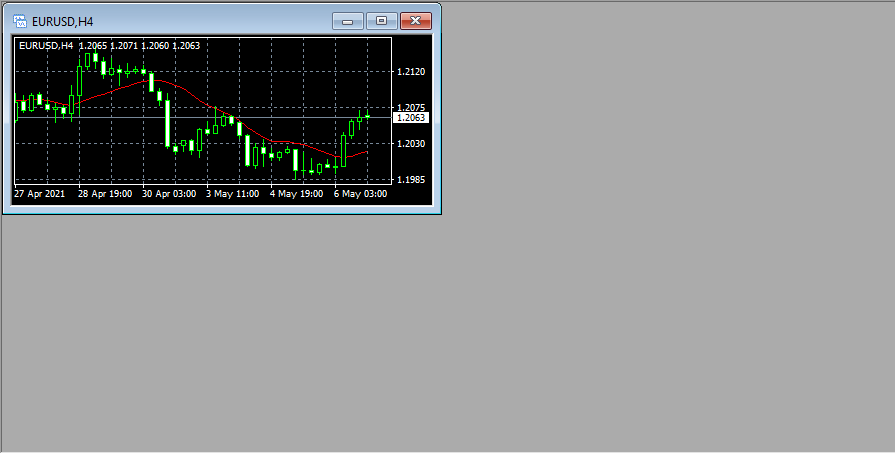
Next, you will likely want to make the chart fill the whole workspace. For this, click on the Maximize button left of the Close button. Or just
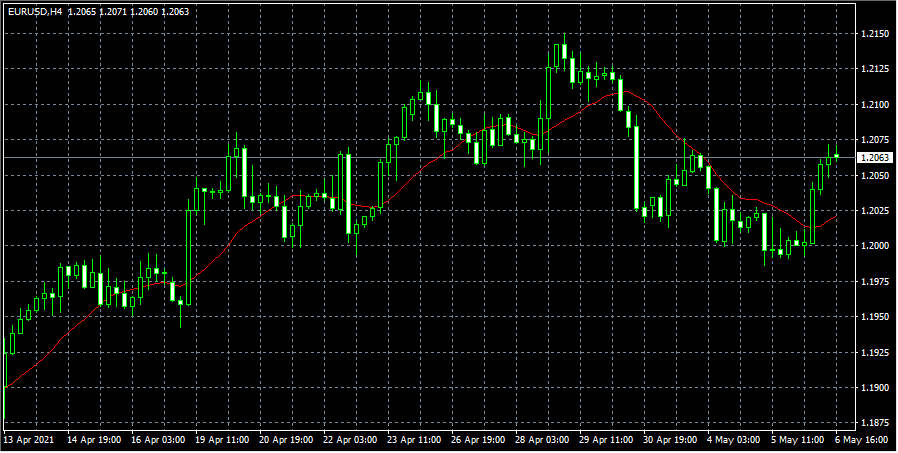
If you have maximized the chart with other chart windows being opened, you can switch between charts by using tabs under the currently active chart.
How to remove indicators
Now, let's start removing indicators. To do so, you will need to bring up the indicator list. For this,
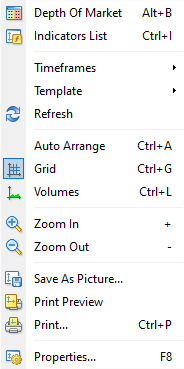
You can also use the Ctrl+I key combination to bring up the indicator list for the currently active chart. You cannot bring up the indicator list if the currently active chart does not have any indicators attached to it.
In the indicator list, click on the indicator you want to delete and then click on the Delete button.
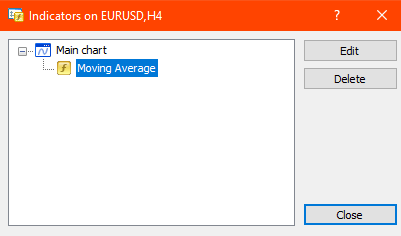
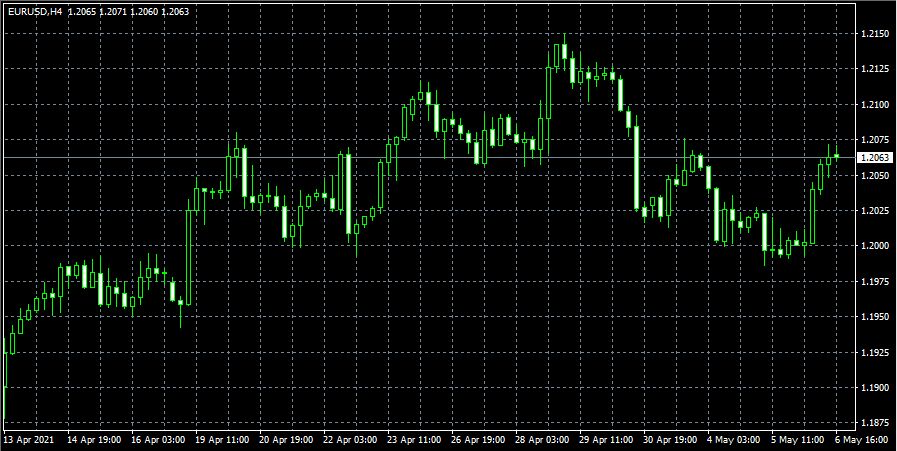
That is how your chart should approximately look after deleting all indicators.
How to remove elements from the chart
You may still want to remove some of the elements from the chart, such as the grid, the line that shows the current price level, and the OHLC (Open, High, Low, Close) figures in the top left of the chart.
To do so,
The Properties window has two tabs: Colors and Common.
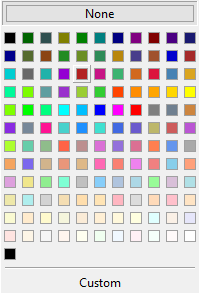
In the Colors tab, you will need to change the color of the grid. To do so click the square with the color to the right of the Grid or on the arrow pointing down to the right of the color name (by default, it is usually LightSlateGrey).
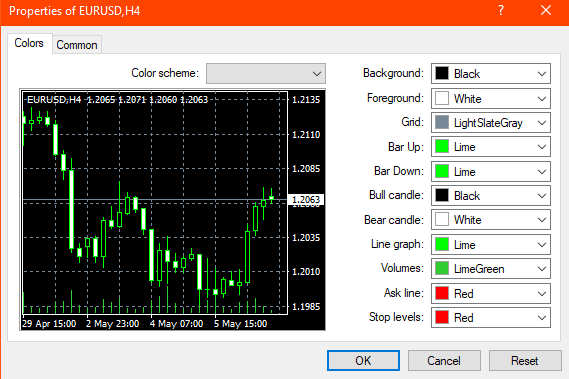
To hide the grid, you can choose the same color as the background. But it is easier to just choose None. This way, the grid will not appear even if you decide to change the color of the background. This will also hide the line that shows the current price level.
In the Common tab, untick the Show OHLC option. You can also untick the Show grid option but that is unnecessary if you have already changed the color of the grid.
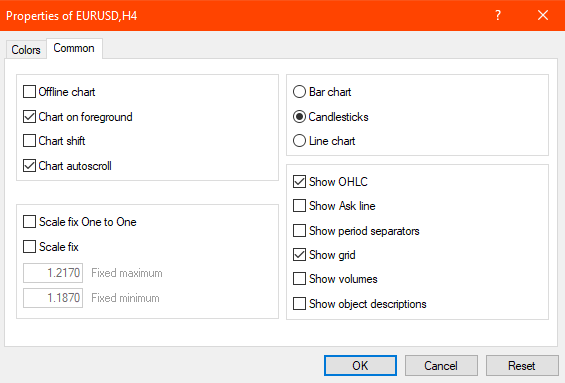
If you turn off the grid in the Common tab without changing the color of the grid, you will still see the current price level line.
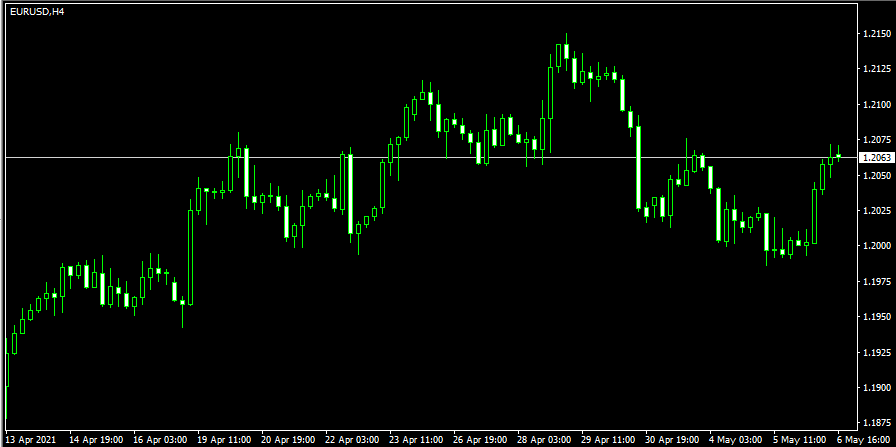
And that is how your chart will look with the OHLC turned off and the grid color set to None.
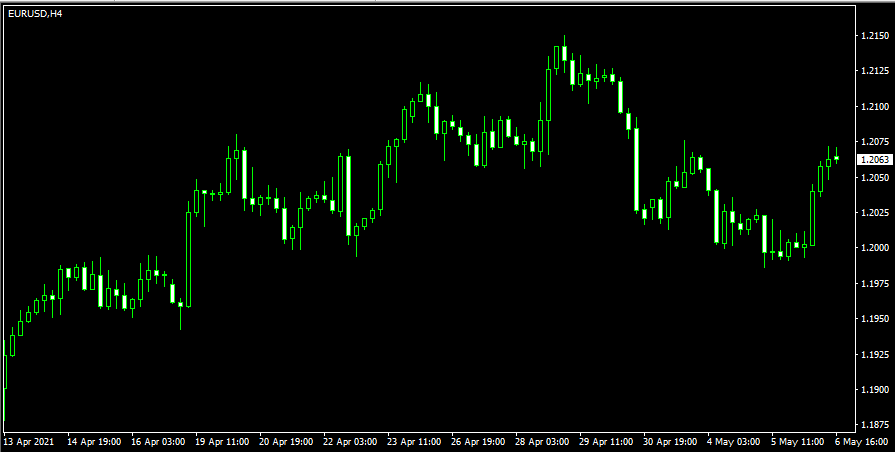
From here, you can start using the chart
If you want to share your opinion, observations, conclusions, or simply to ask questions regarding cleaning up MetaTrader 4 workspace, feel free to join a discussion on our forum.