MetaTrader 4 is one of the most popular platforms among Forex traders. During the current age of smartphones, it is not surprising that a mobile version of the platform exists, tailored for those traders who like to work on the go. The present tutorial for the MetaTrader 4 mobile application for Android devices demonstrates various features of the mobile app and teaches how to use them. It also explains the major differences between the desktop and mobile versions of the MetaTrader 4 platform.
Downloads
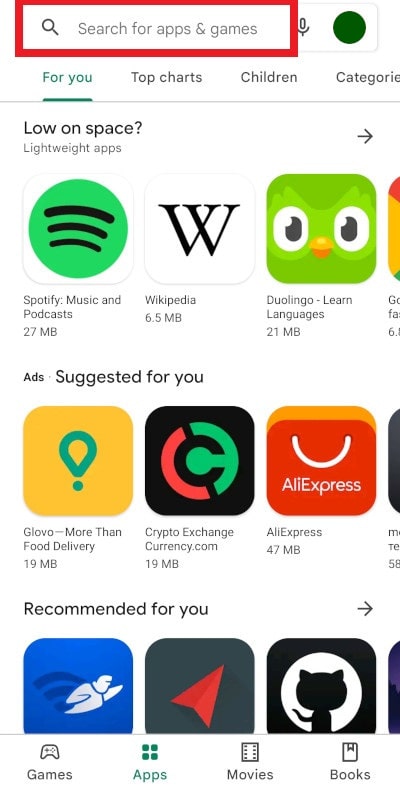
To download the MetaTrader 4 app, go to Google Play. Tap on the search field and enter MetaTrader 4, though just mt4 should be sufficient.
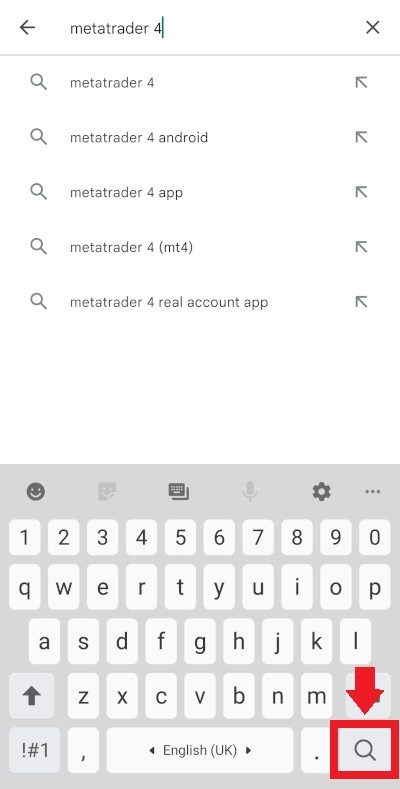
Tap on the magnifying glass icon to start searching.
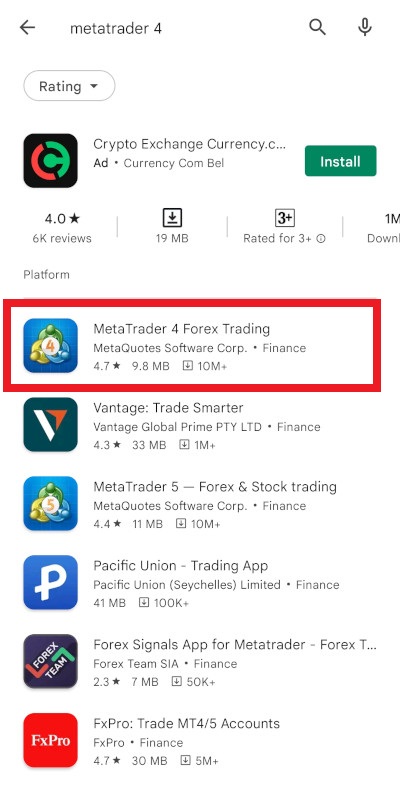
Choose MetaTrader 4 in the search results. Make sure the app is provided by MetaQuotes Software Corp. to avoid downloading potentially malicious apps pretending to be the MetaTrader 4 app.
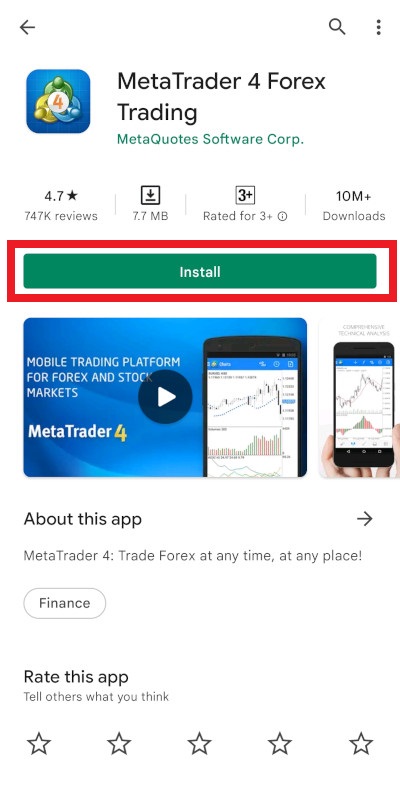
Tap on the Install button to start the installation.
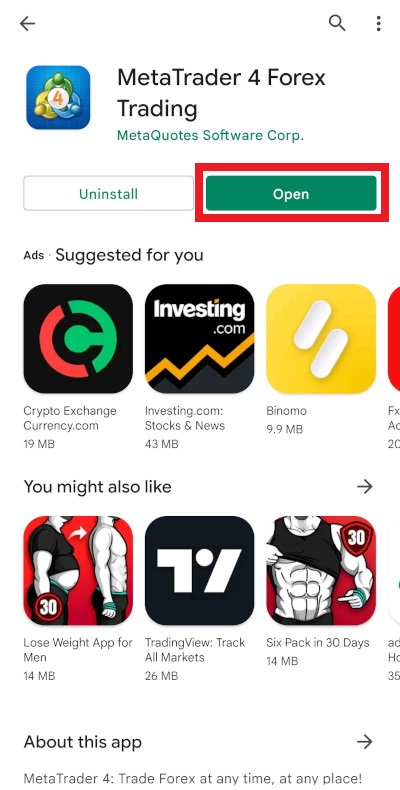
After the installation concludes, tap on the Open button to start the app.
Basic look and elements
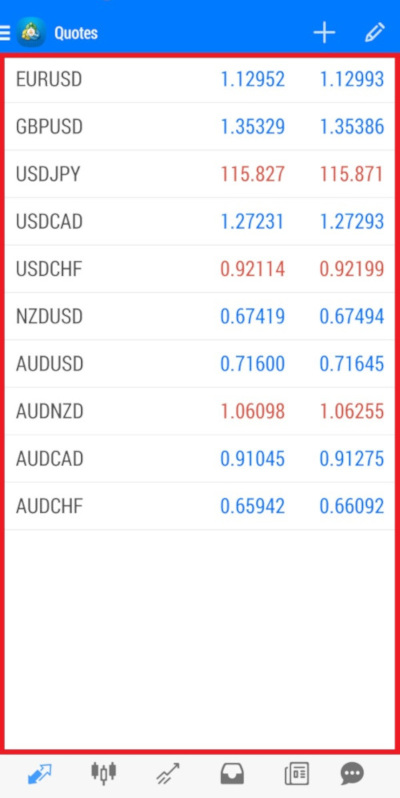
The app window consists of several elements. The main window takes the biggest part of the screen. Its content depends on what tab is currently chosen.
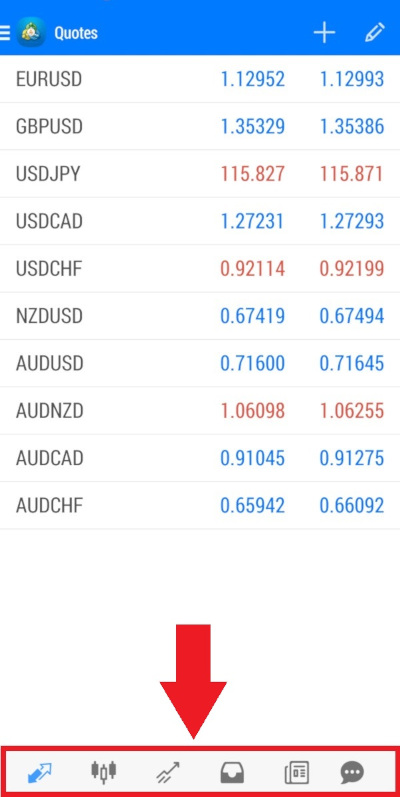
You can select what tab is currently displayed on the Navigation menu at the bottom of the screen by tapping on the appropriate icon.
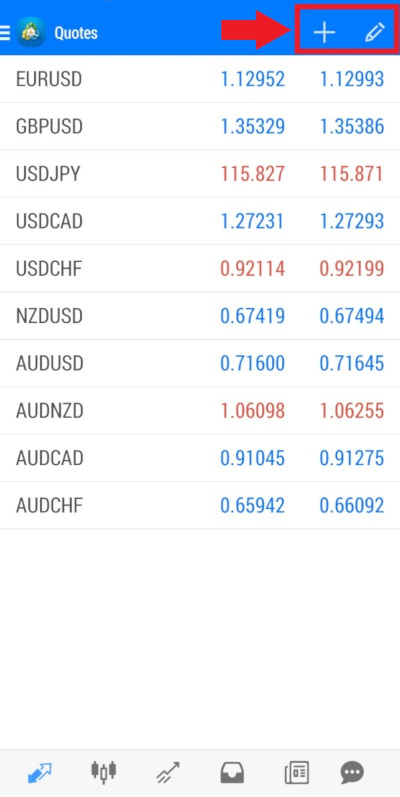
Various instruments for the current tab are situated in the top-right part of the screen. What instruments are shown depends on the current tab. You can
The three horizontal lines in the top-left corner of the screen allow you to open the app's Main Menu. To do so, tap on them.
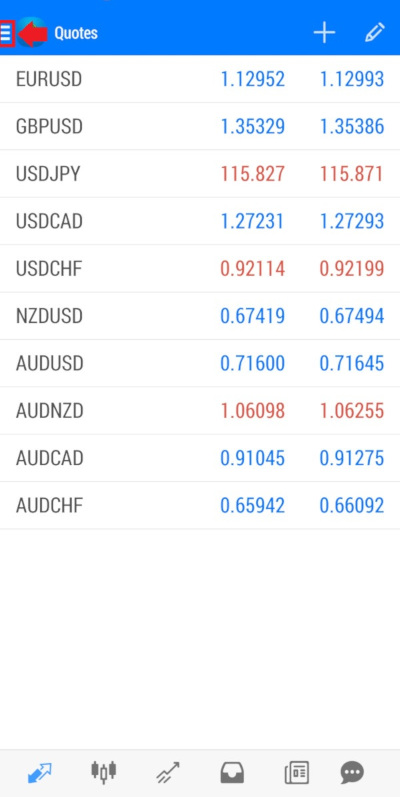
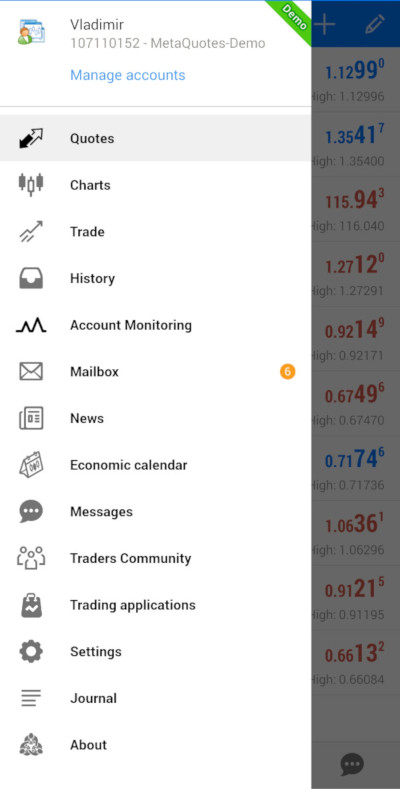
The main menu is the alternative way to open tabs. It also gives access to additional screens and instruments, including the Settings screen.
Creating and managing accounts
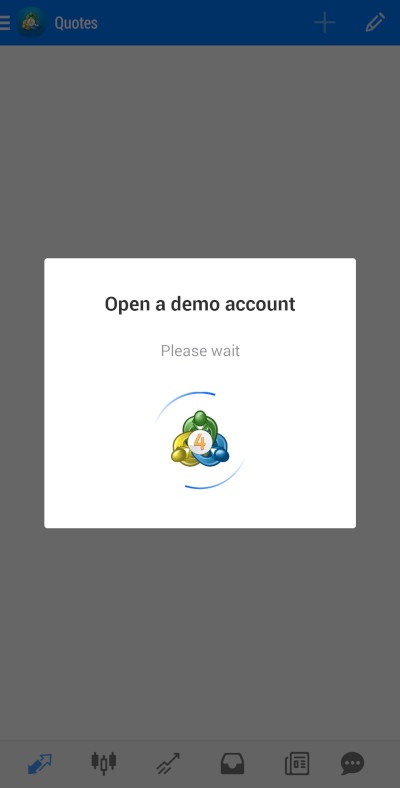
The first time you launch the MetaTrader 4 app, it will automatically create a demo account for you.
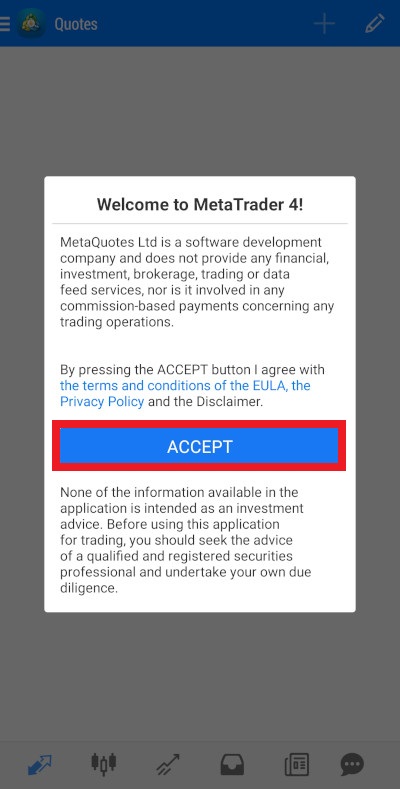
Before you can start using the app, you will have to agree with the terms and conditions of the EULA, the Privacy Policy, and the Disclaimer. Pressing on the blue text will send you to a webpage with the End-User License Agreement, which you should read before clicking Accept.
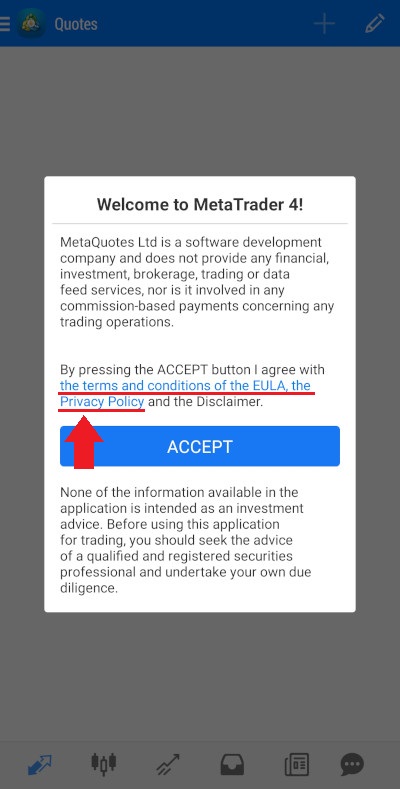
Tap the Accept button to continue.
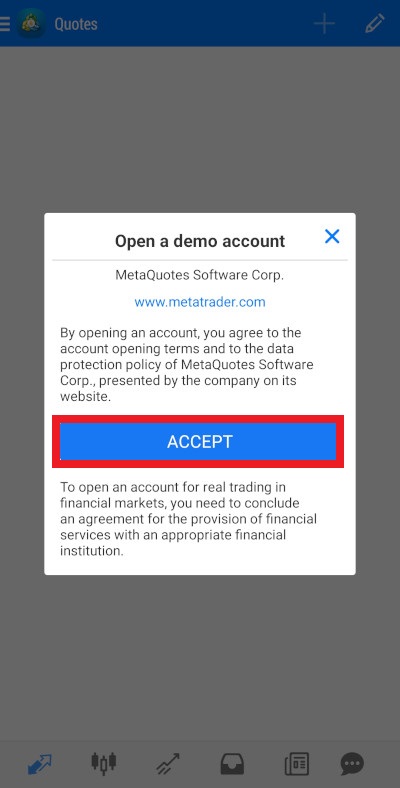
On the next screen, also tap Accept to agree to create a demo account.
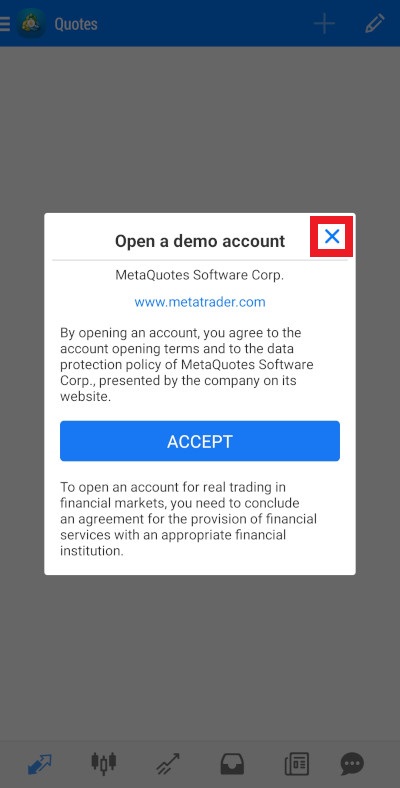
Or click the X-mark in the top-right corner of the window to close it without creating a demo account.
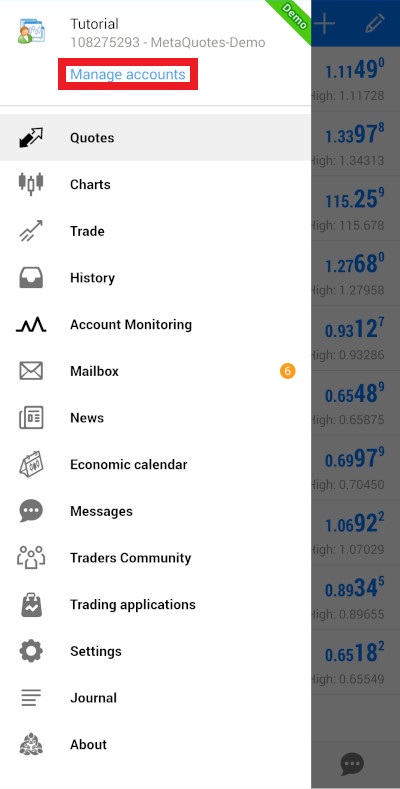
To continue using the app, you will have either to create a demo account or to login to an existing account (demo or live). If you did not create an account, go to the Main Menu and tap the Get Started button at the top to get to the Accounts screen, which allows you to create and manage accounts.
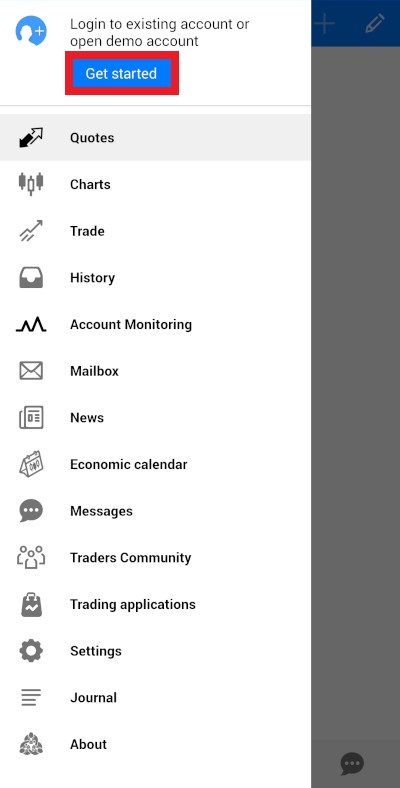
If you have already logged in to an account, the Get Started button will be replaced with Manage Accounts, which also sends you to the Accounts screen.
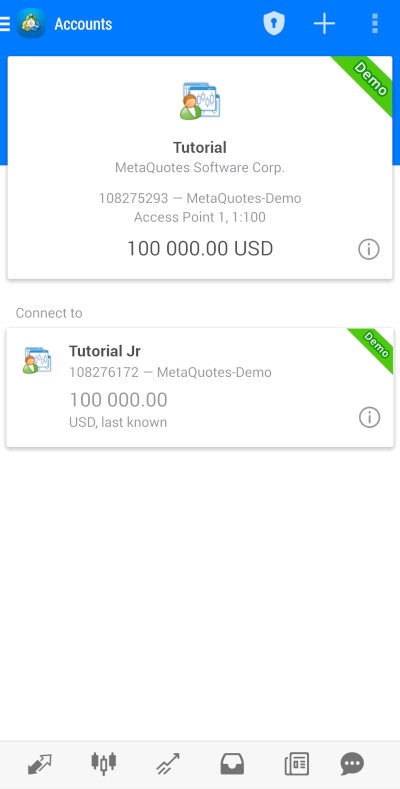
The Accounts screen shows all your accounts.
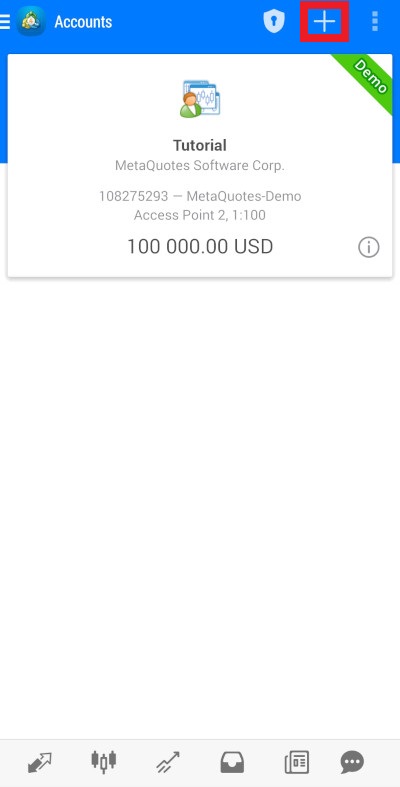
Tap on the + icon (Add account) in the Instruments panel to create a new account or to log in to an existing account.
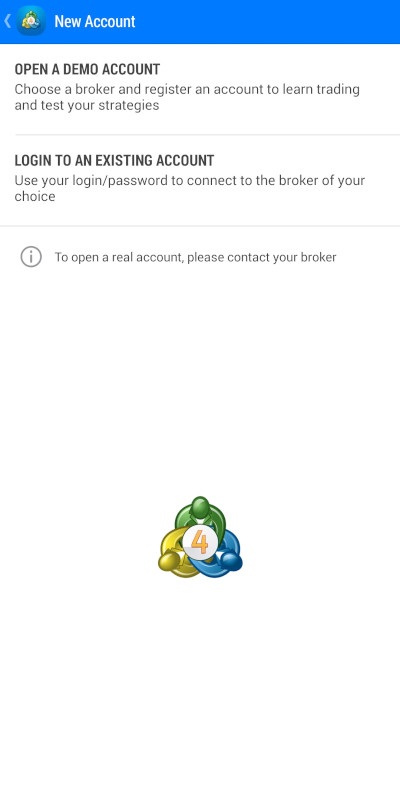
You can either create a new demo account or log in to an existing account. You cannot create a real account on the platform. To create a live account, you need to contact your broker.
If you choose to log in to an existing account, you will see a list of trading servers. To find your broker, enter the name of the broker in the search field.
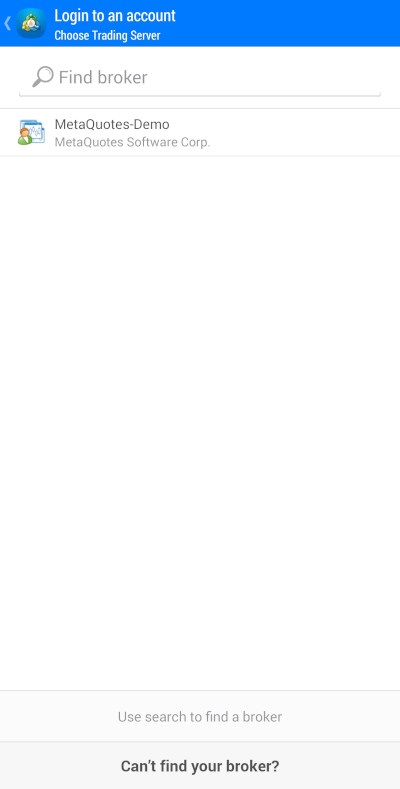
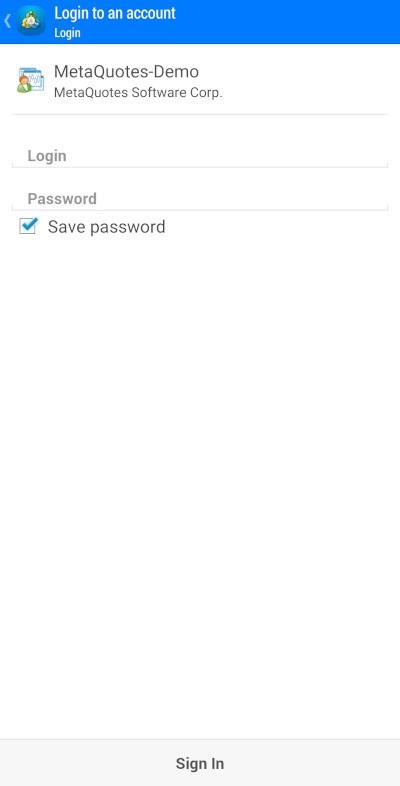
After choosing a trading server, you will need to enter a login and password. You also have an option to save the password. It allows you to avoid entering the password each time you log in to the server, speeding up the login process, but it can dangerous if someone else manages to get access to your phone.
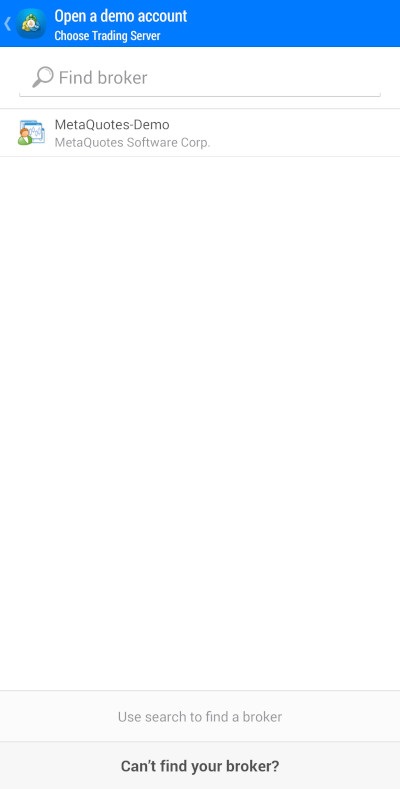
If you choose to create a new demo account, you will see a similar screen. Find the broker of your choosing in the search field or tap on the MetaQuotes-Demo server to create a demo account on the MetaQuotes server.
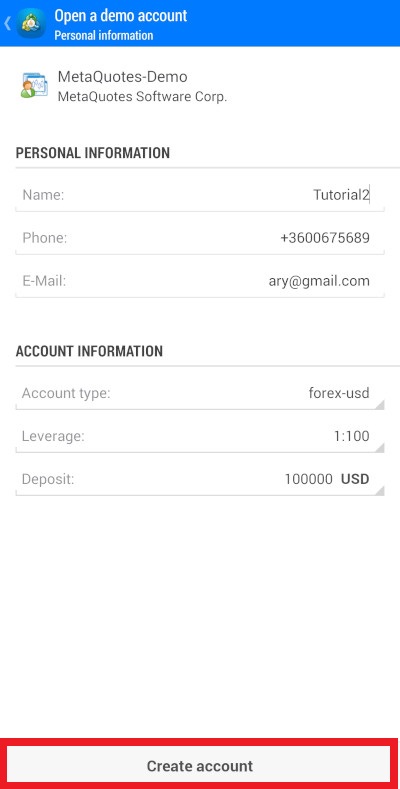
On Open a demo account screen, you will need to enter the personal information (for demo accounts, the personal information does not have to be actually real) and the account information. Tap Create account to proceed to the next screen.
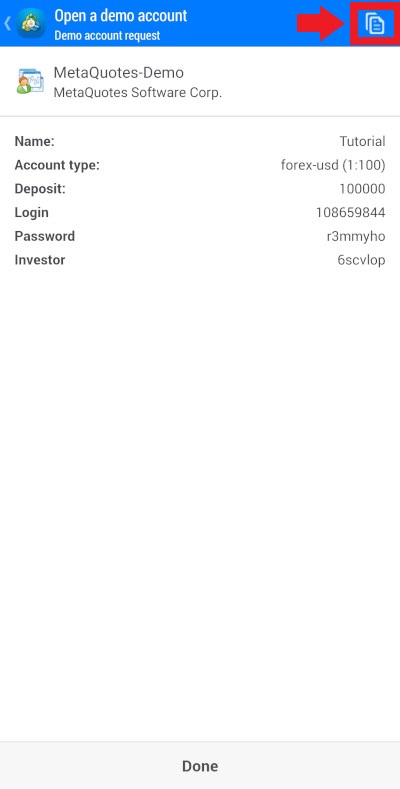
Confirm the information on the next screen. The Copy to Clipboard button in the top-right corner allows you to copy the account information to the clipboard.
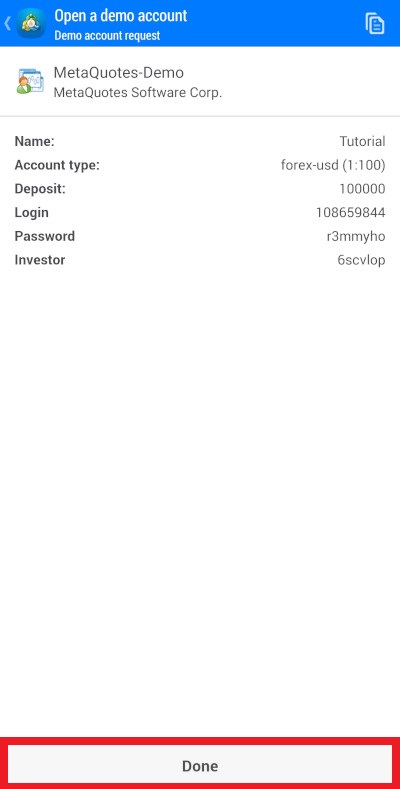
If everything is correct, tap on the Done button.
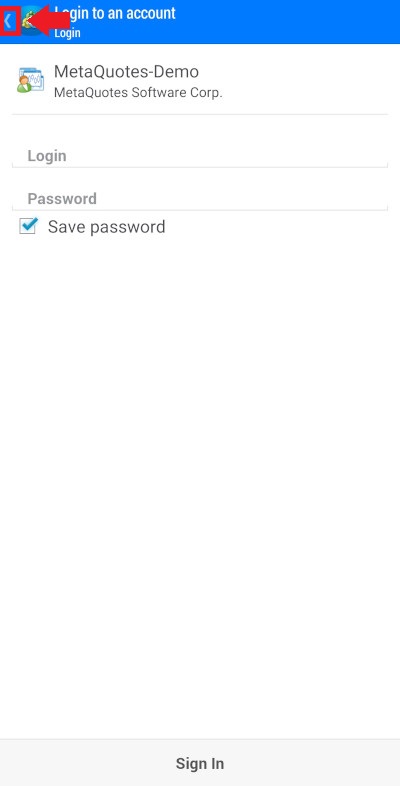
If at any point you change your mind about creating a new account or logging in to an existing one, each screen has the Back button, which will bring you to the previous screen.
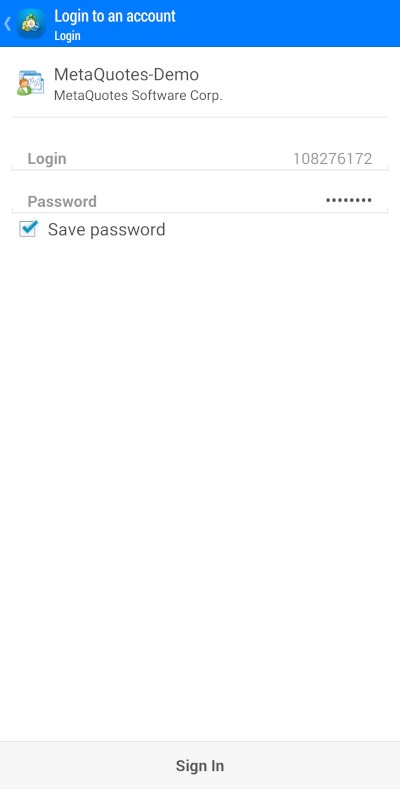
If you have several accounts, change accounts by tapping on the one you want. You will have then to enter the login and the password for it.
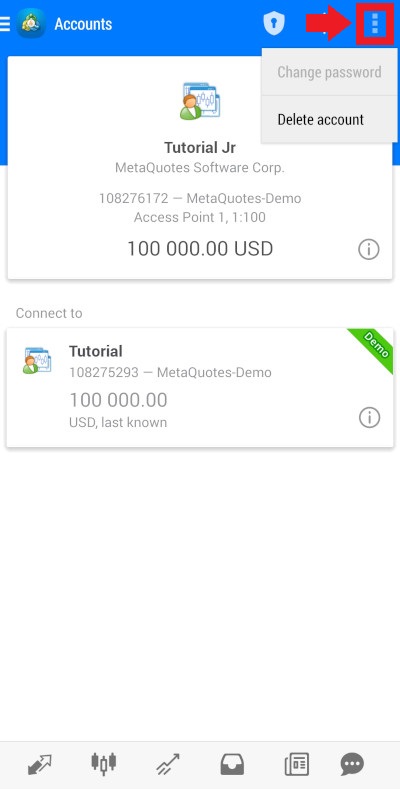
The Edit button in the Instruments panel allows you to change the password for the currently selected account or delete the account (if you have several).
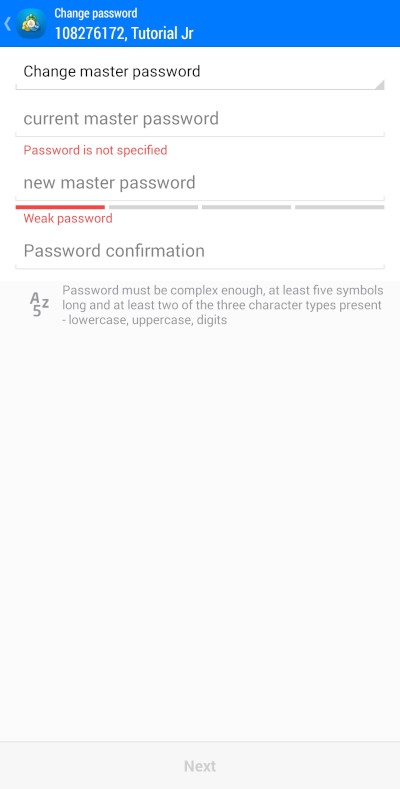
If you choose to change the master password, you will need to enter the old one, the new one, and then enter the new one again to make sure you did not make a mistake. The text below the fields for entering passwords explains the requirements for the password. Tap Next to confirm the new password or tap the Back button to keep the old one.
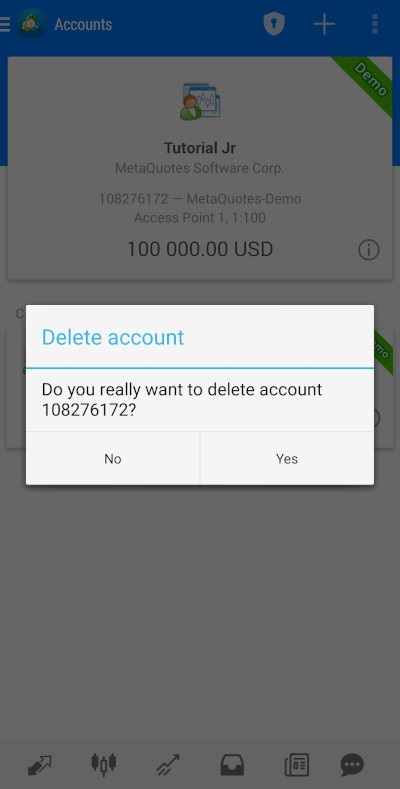
If you choose to delete an account, the confirmation window will appear. Tap Yes to delete the account or No if you have changed your mind.
An alternative way of logging in to an account or deleting an account is to press and hold on the account you wish to operate in the list of accounts on the Accounts screen. This will bring up a menu with Login, Delete, and Properties options.
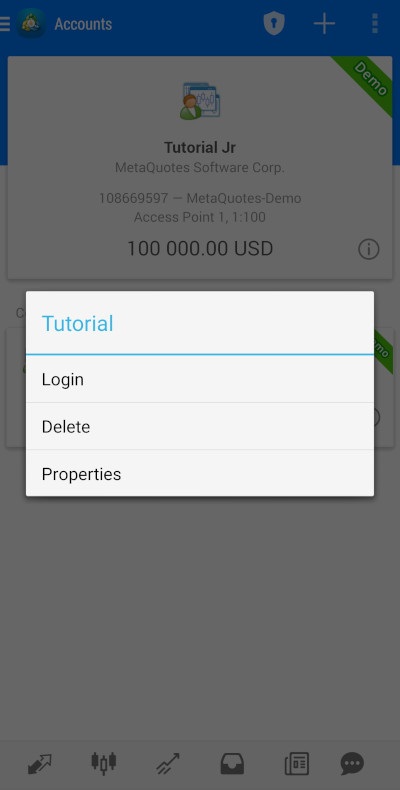
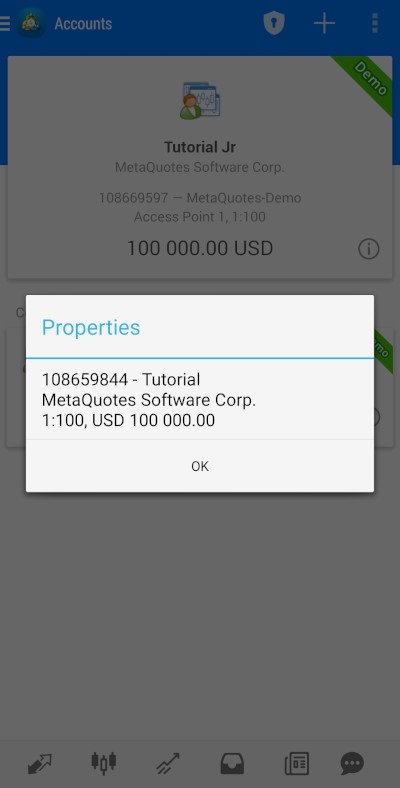
The Login option will bring you to the Login to an account screen discussed previously. The Delete option will bring out the menu with confirmation of deleting the account, also described previously. The Properties option will bring out the Properties window. It will show properties of the selected account such as the login, the owner's name, the broker's name, leverage, the currency of the account, the account balance.
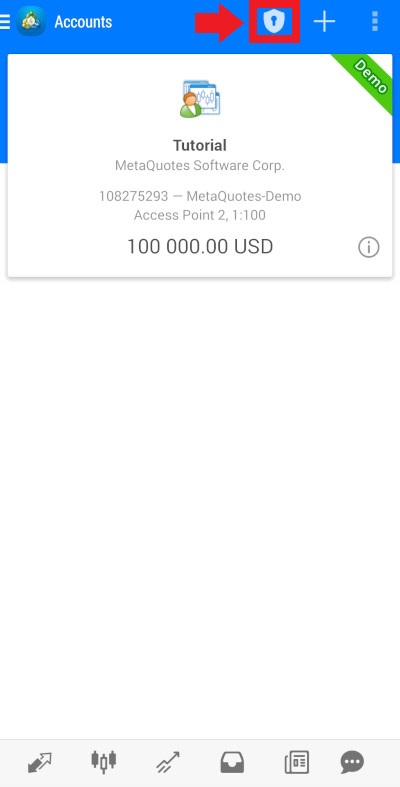
The icon of a shield with a keyhole (One-time Password Generator) allows you to increase the protection of your account by using one-time passwords generated by your mobile terminal.
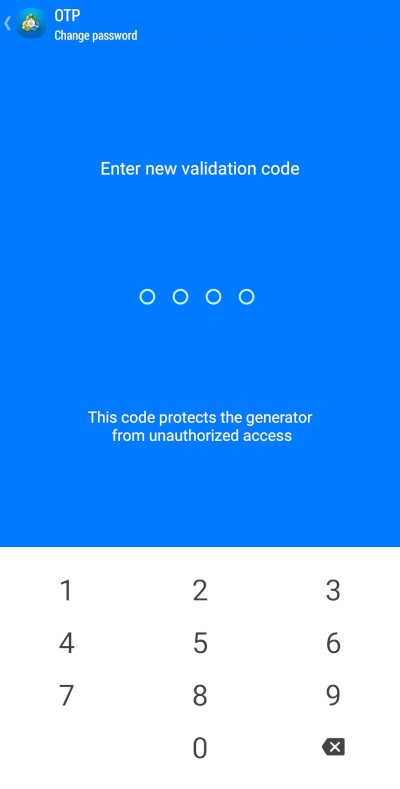
The app will request you to enter a 4-digit validation code.
Repeat the code again to make certain you did not make a mistake.
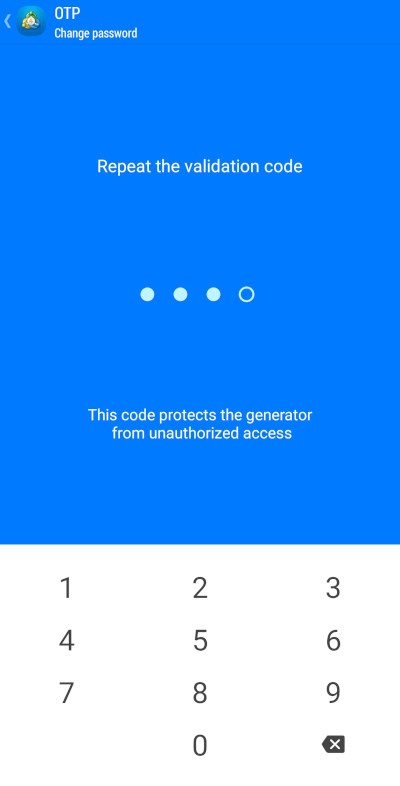
You will need to enter the validation code every time you want to access the one-time password generator.
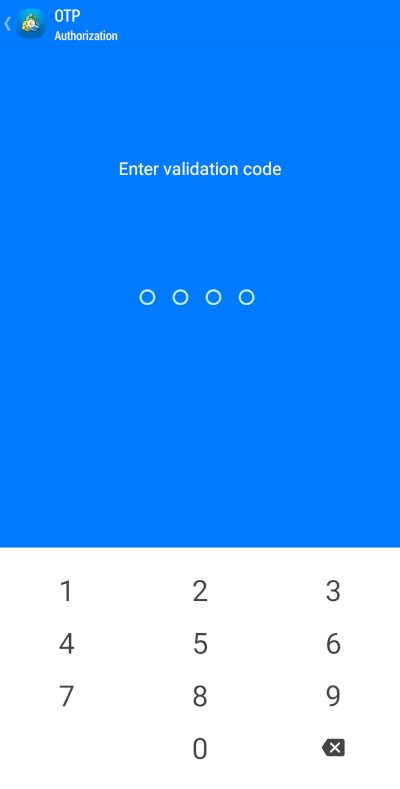
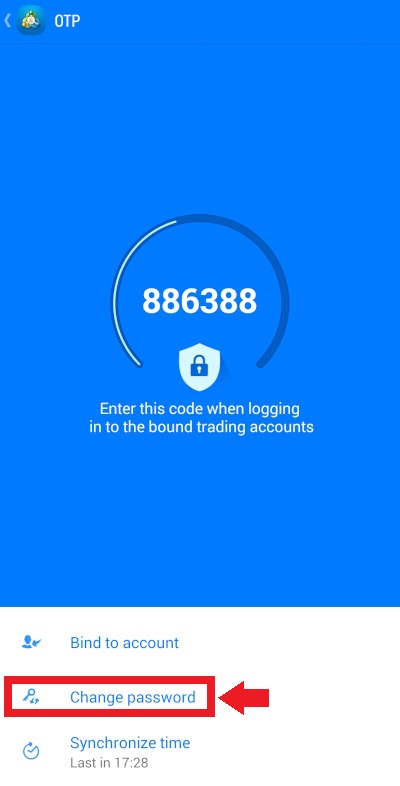
To change the validation code, go to the One-Time Password Generator screen and tap on Change password. You will need to enter your current validation code, then the new one, and then repeat it again.
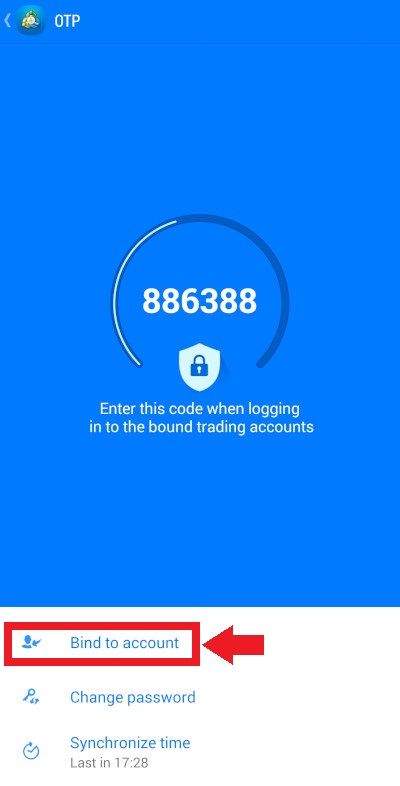
To bind the current account to the password generator, tap the Bind to account option.
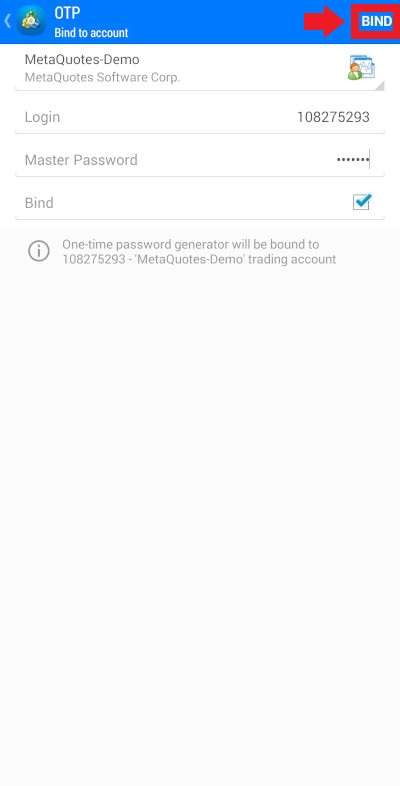
You will need to enter the login and password for the current account and make certain that the Bind option is on (has a checkmark in the square opposite to it). If it does not, tap on the empty square to turn the option on.
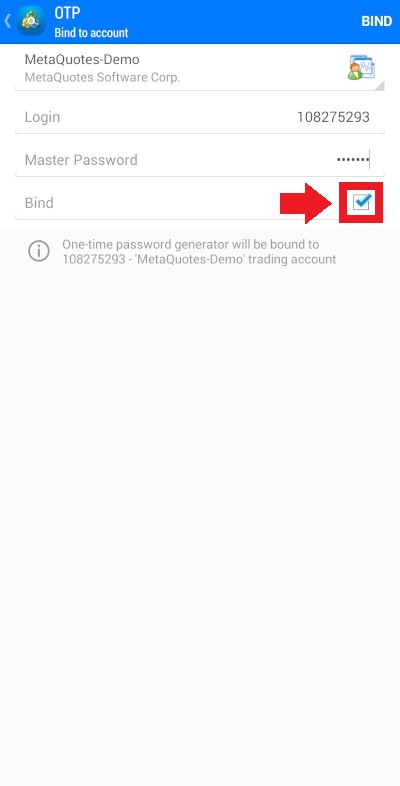
Tap Bind in the top-right corner to bind the account to the password generator.
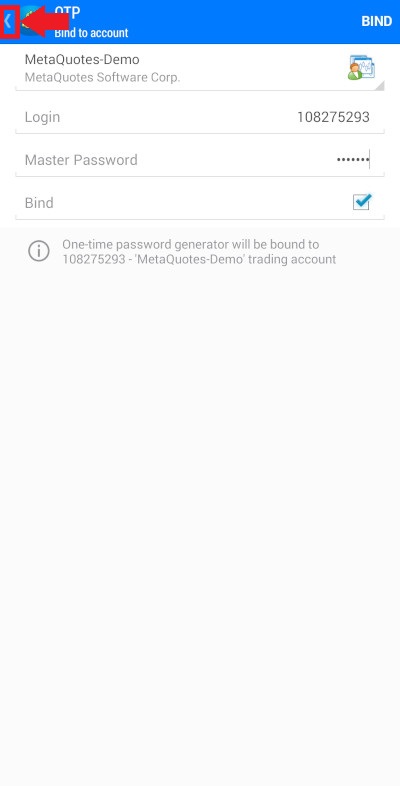
Or tap Back in the top-left corner to cancel the operation.
Quotes screen
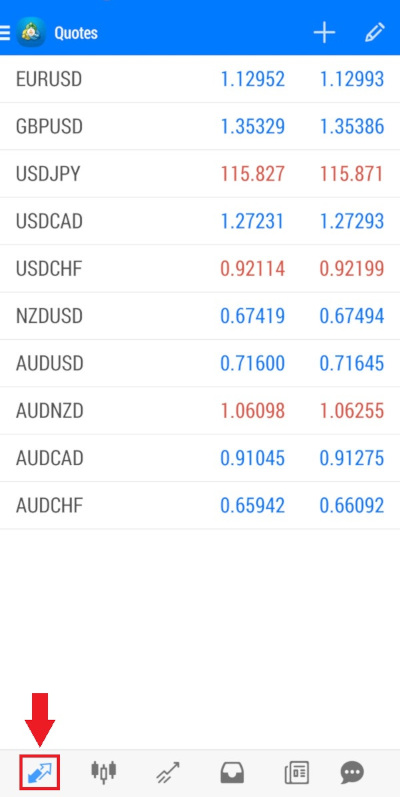
The Quotes screen shows quotes for your chosen markets. To select this screen, tap on the first tab from the left in the tabs lists at the bottom.
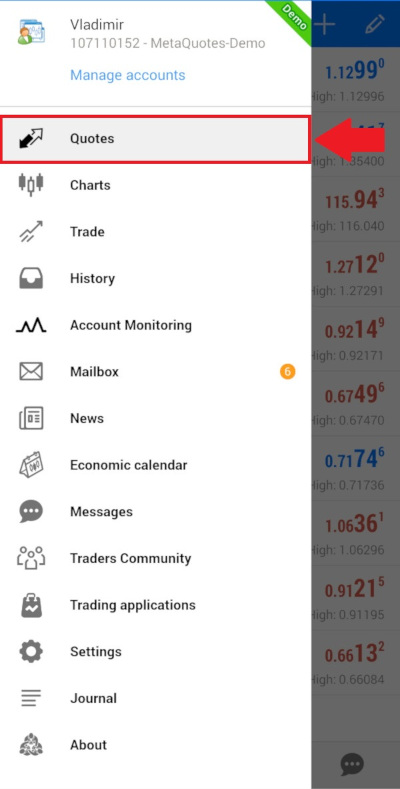
Or you can choose it from the Main menu.
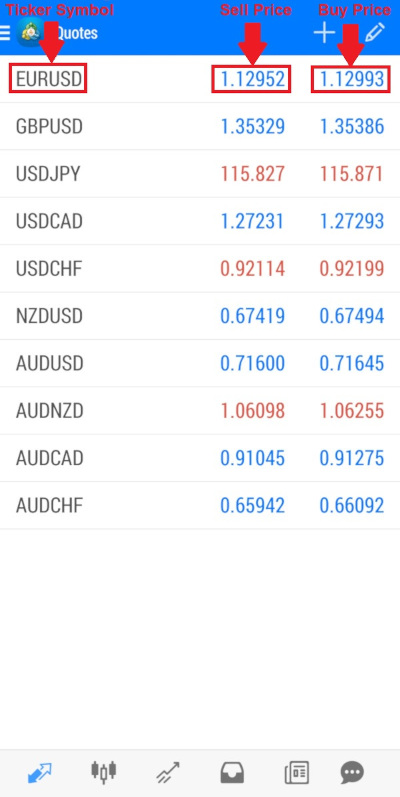
The Quotes screen has two modes: Simple and Advanced. In the Simple mode, the quotes screen shows only a ticker symbol, a sell price, and a buy price.
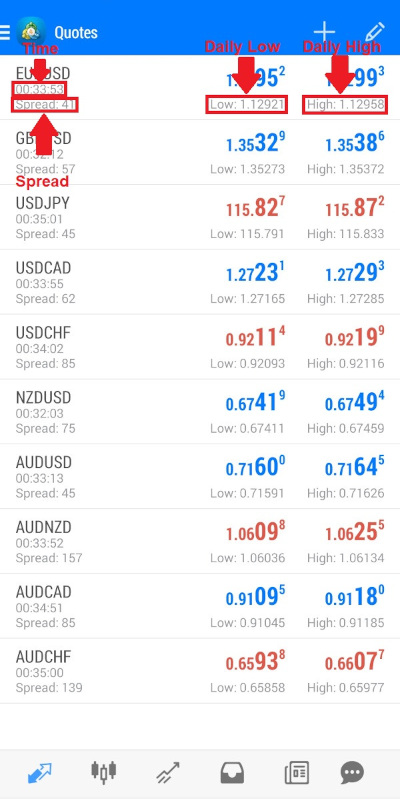
In the Advanced mode, the screen also shows the time the quote was updated (the time zone depends on your broker, not on your system time, and cannot be changed), spread (the difference between the buy and sell prices), the low and high prices (the lowest price for the day and the highest price for the day).
Changing between Simple and Advanced view modes
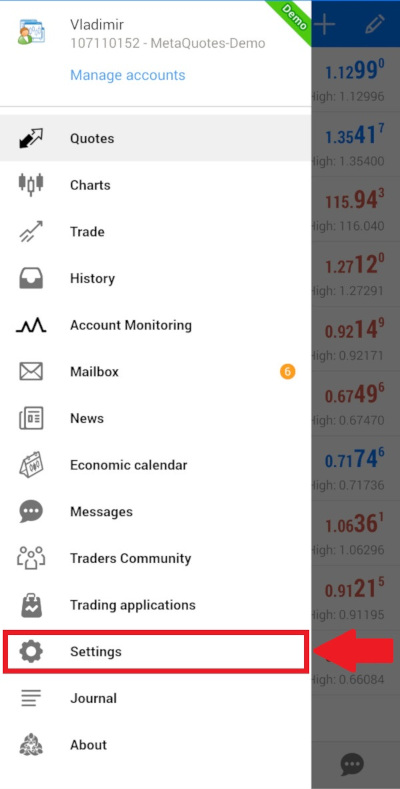
To change the mode of the quotes screen, go to the Settings screen by tapping Main Menu->Settings.
Go to Quotes->Advanced mode setting and check it if you wish to see quotes in the Advanced mode or uncheck it if you wish a Simple view.
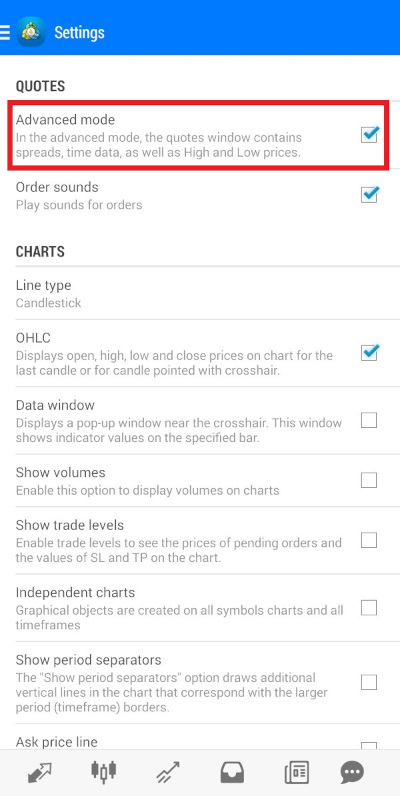
The app has a small bug: after the first launch, the Quotes screen is in the Advanced mode even though the setting is unchecked by default. Just check and then uncheck the setting to actually switch to the Simple mode. Afterward, the setting will work as intended.
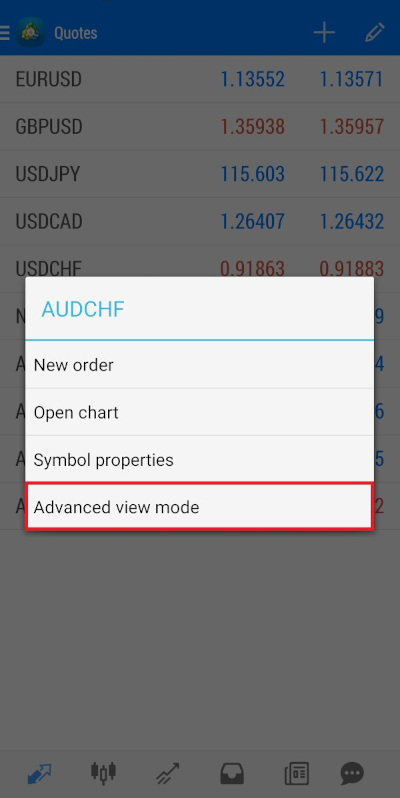
Alternatively, you can call a menu by tapping on any symbol. In the menu, you can switch to the Advanced mode if you are currently in the Simple mode or to the Simple mode if you are in the Advanced mode.
Adding symbols to Quotes screen
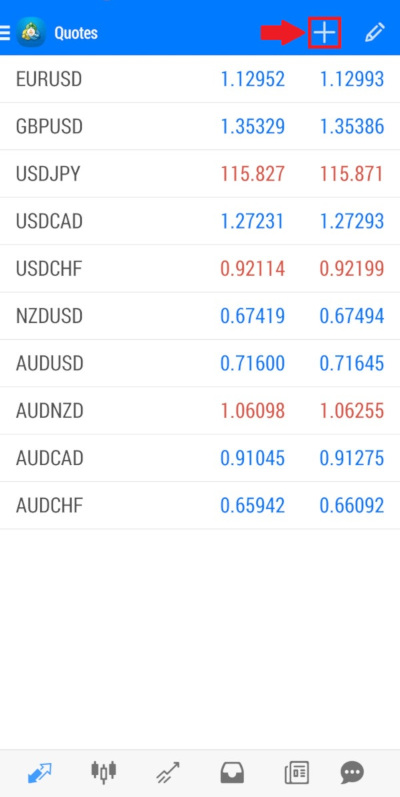
To add a market to the Quotes screen, tap the + button (Add) on the Instruments panel.
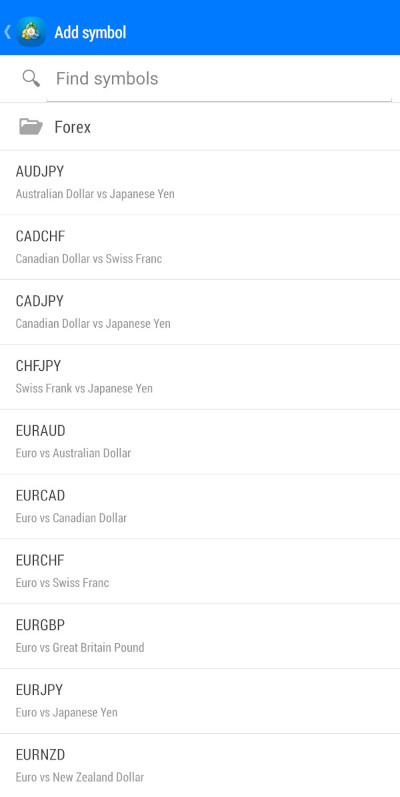
Select the appropriate folder and choose the symbol you want from the list, tapping it. The selection of symbols depends on your broker. The Demo account offered by MetaTrader 4 offers only the Forex folder, which contains only major currencies as well as gold and silver.
If you know the ticker symbol for the market you are searching for but cannot find it, you can try to enter it in the Find symbols field.
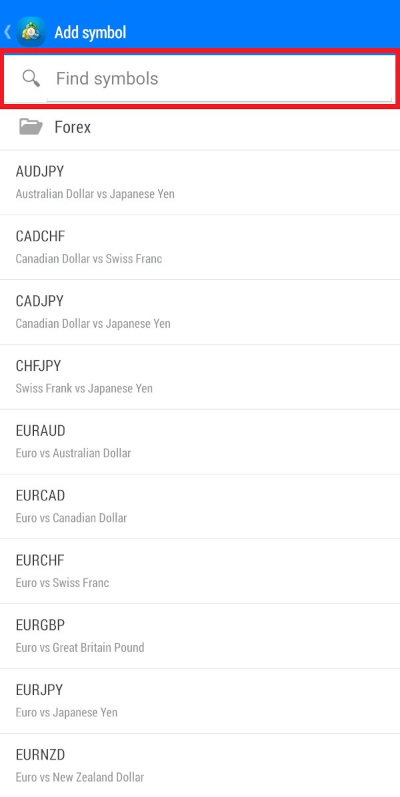
You should remember: the list shows only symbols that are not currently on the Quotes screen. Therefore, if you cannot find a symbol you want, check whether you have already added it to the Quotes screen.
Rearranging and deleting symbols
To change the order of symbols on the Quotes screen, tap the Edit button on the Instruments panel.
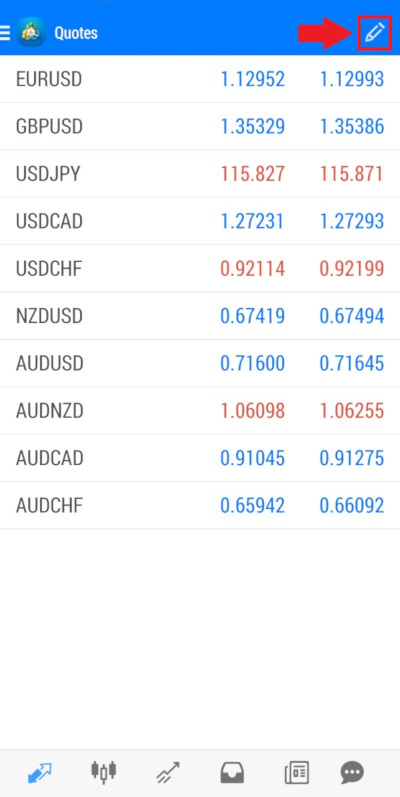
This will present you with the list of all of the symbols in the Quotes screen. You can change the order of symbols in the list. To change the position of a symbol in the list you should press and hold the three horizontal lines to the left of the symbol name and drag the symbol higher or lower in the list.
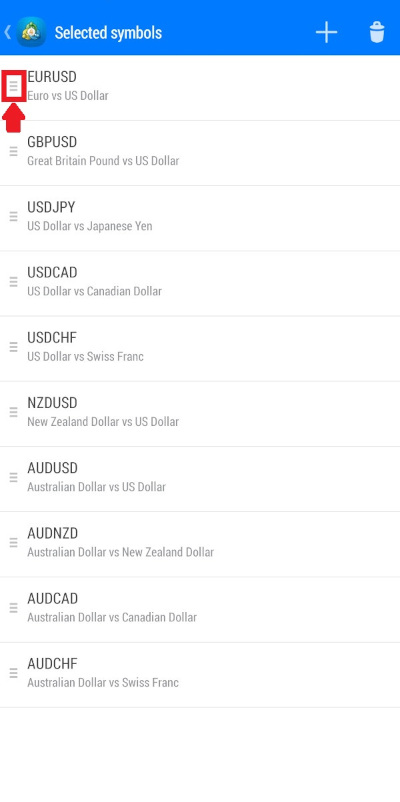
The Add symbol button remains in its place, meaning you can add symbols to the list from the Edit screen the same way as you would do it from the Quotes screen. The Edit button is replaced with the Delete button, which you should press if you want to delete one or more symbols.
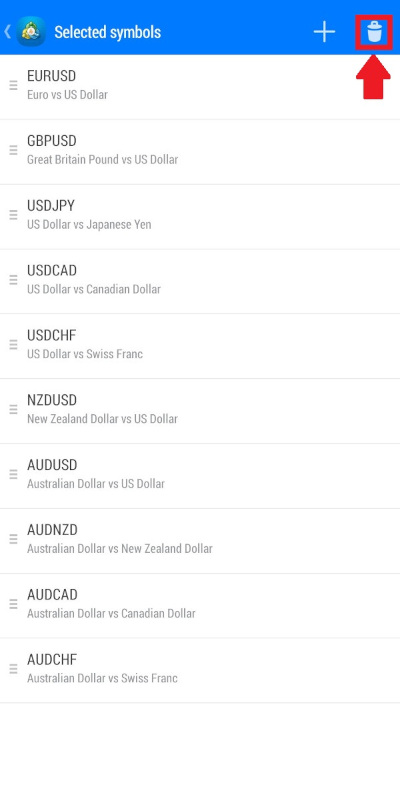
You will be presented with the list of the symbols, each with a checkbox opposite to it. Tap the checkbox to select the symbol for deletion. Tap it again to deselect the symbol. You can select all the symbols you can delete by tapping the button with filled checkboxes (Select all) near the Delete button.
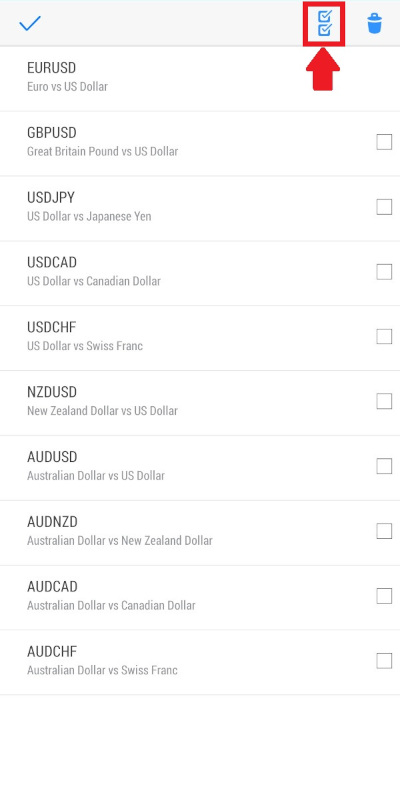
If you select all the symbols, the button for selecting all symbols will be replaced with a button with empty checkboxes. Click it to deselect all the symbols.
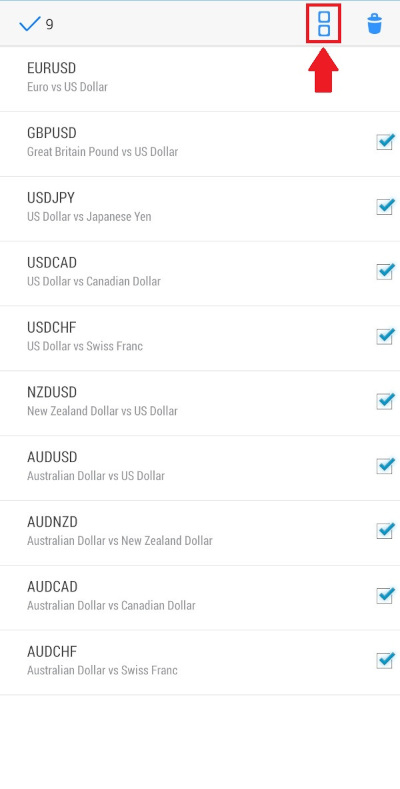
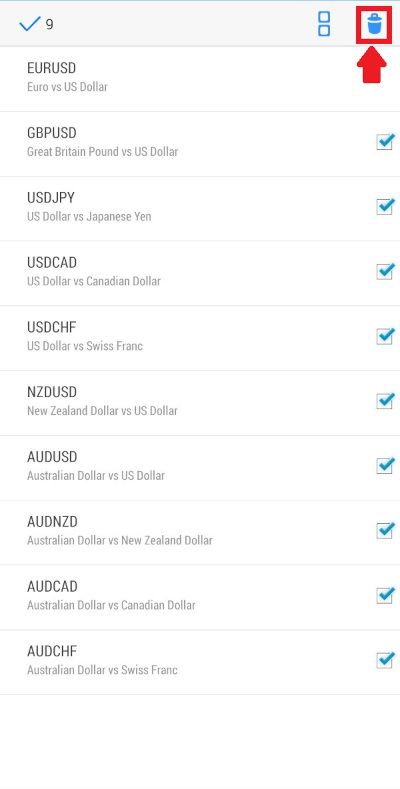
After you have selected all the symbols you want to delete, tap the Delete button in the top-right corner of the screen.
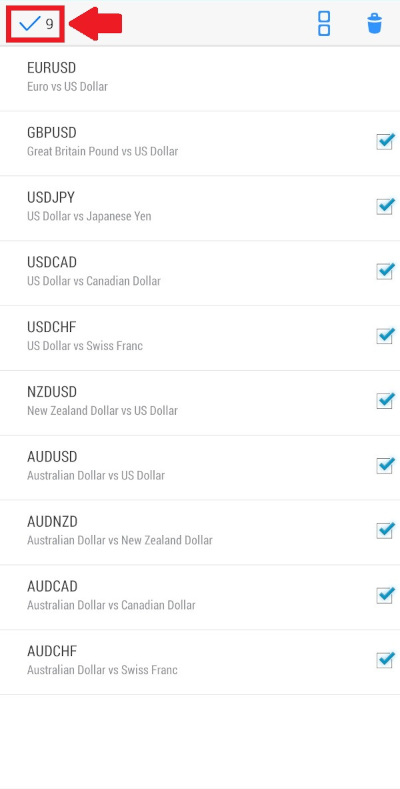
The checkmark in the top-left corner of the screen shows the number of symbols you have selected for deletion. After you finished editing your quotes list, press the checkmark to finish editing. Even if you have symbols selected when you press the checkmark, they will not be deleted.
Remember: you cannot delete a symbol if you have selected it in the Charts screen or you have an open position or order on that market. Check the Charts screen and your open trades if the app does not allow you to delete a symbol.
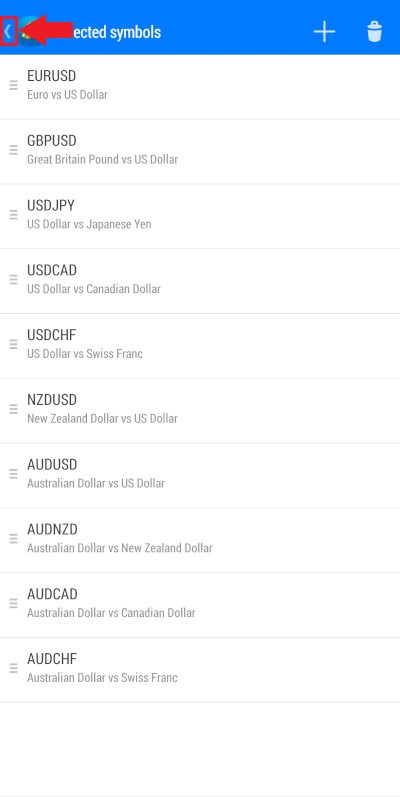
To return from the Edit screen to the Quotes screen, press the Back button in the top-left corner of the Edit screen.
Charts screen
The Charts screen shows a chart for one of the markets from your Quotes screen. To get to the Charts tab choose it from the Navigation Menu at the bottom.
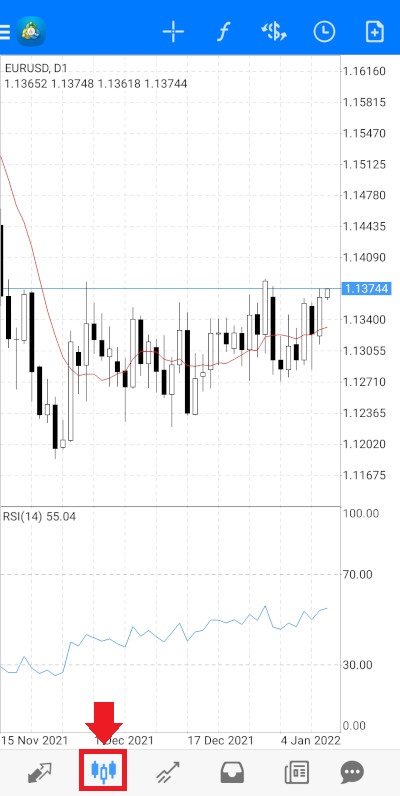
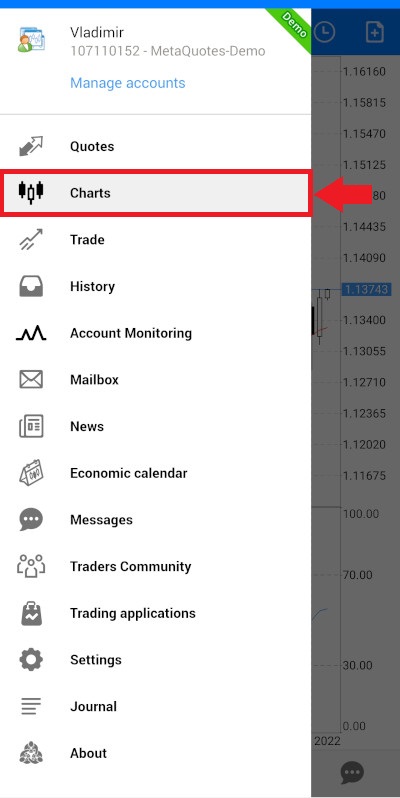
Or you can choose the Charts tab from the Main menu.
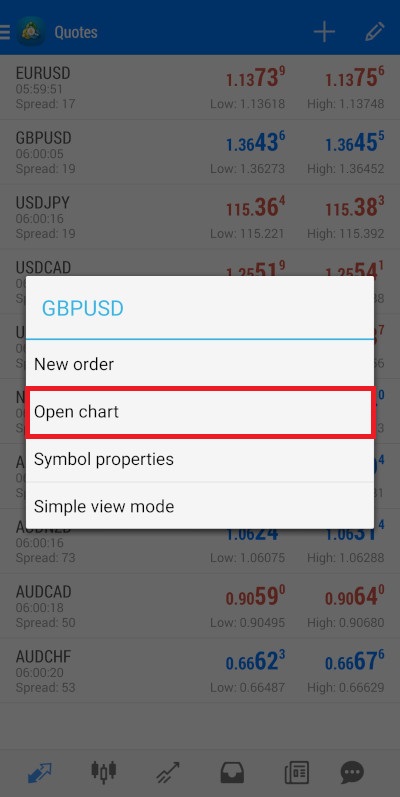
To choose what market is displayed on the Charts screen you have two options. You can go to the Quotes screen, tap on the symbol of the market you wish to see on the Charts screen, and then choose the Open chart option from the Quick menu.
Alternatively, you can choose the market directly from the Charts screen. To do so, tap on the $ button (Symbol) on the Instruments panel and choose the appropriate symbol from the list. The list will be the same as on the Quotes screen. Therefore, if you wish to add, delete, or change orders of the symbols in the list, you should edit symbols on the Quotes screen.
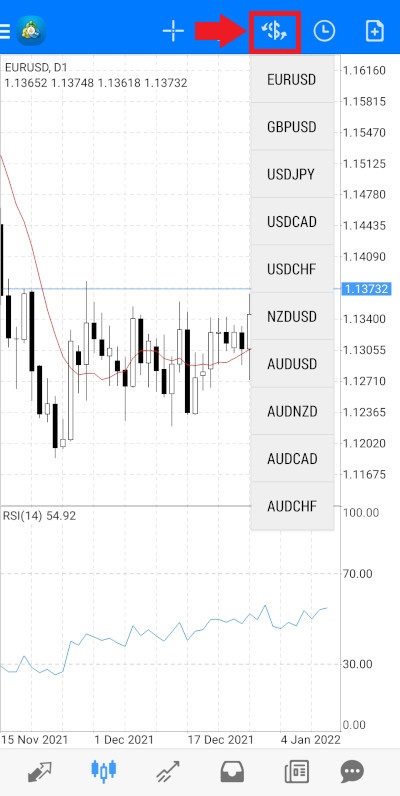
In the upper left corner of the chart, you can see the market ticker symbol and the timeframe for the currently opened chart. Below them, four numbers are shown: open, high, low, and closing prices for the current candle (if you are looking at a candlestick chart). The x-axis of the chart shows a time scale, while the y-axis shows a price scale.
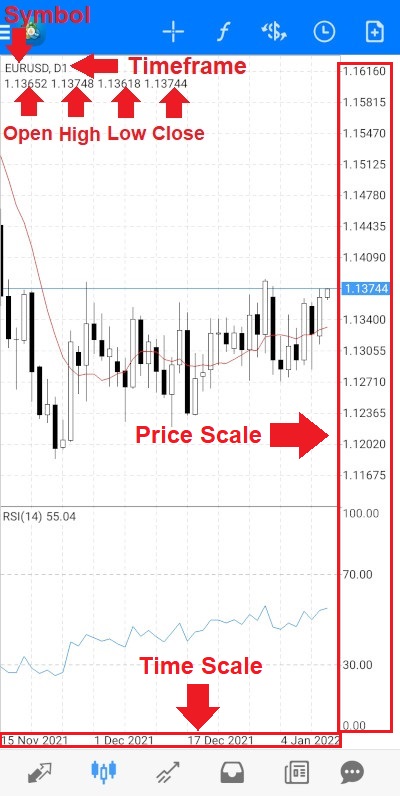
You can adjust the scale of the chart by pressing and holding two fingers on the chart. Move fingers apart to zoom in or move them closer to zoom out.
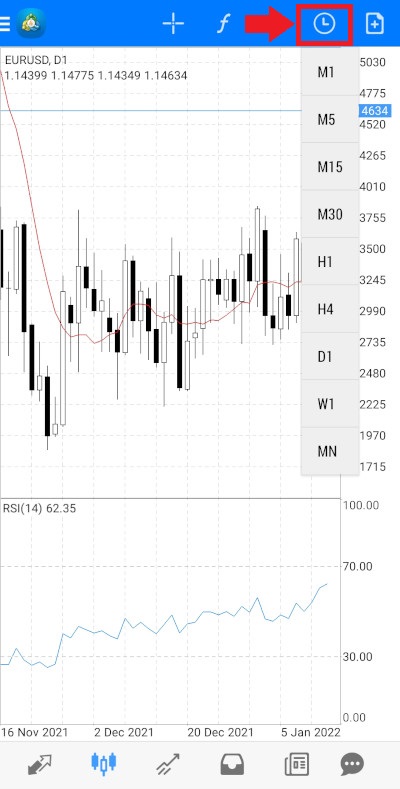
To choose the timeframe for the chart, tap the clock button (Periodicity) on the Instruments panel.
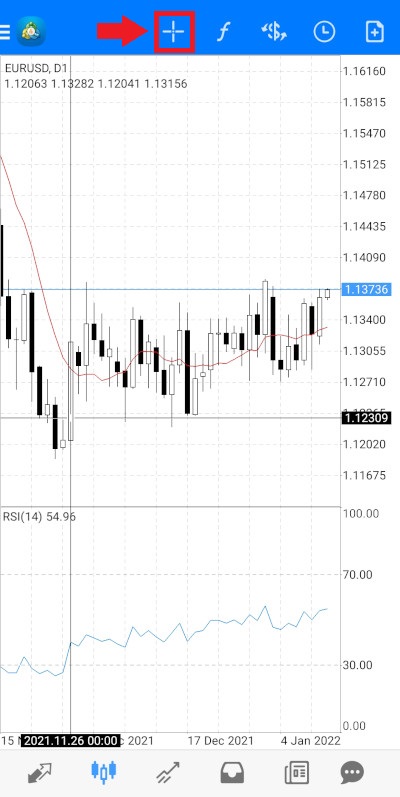
You can use the Crosshair tool to examine the chart in more detail. For example, if you wish to see the open, high, low, and close prices of any particular candle on the candlestick chart, you can choose the Crosshair tool and point it at that specific candle. You can use it the same way to see specific values of various indicators. Tap the Crosshair icon to activate the tool and tap it again to deactivate the tool.
Changing chart type
To change the type of chart displayed on the Charts screen, go to the Main menu->Settings->Charts->Line type.
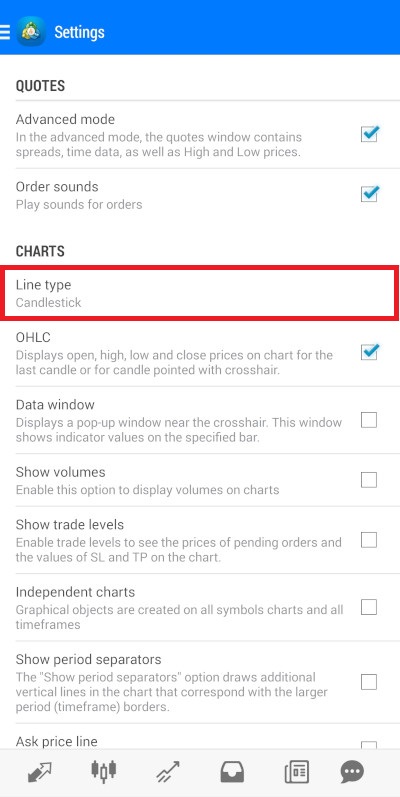
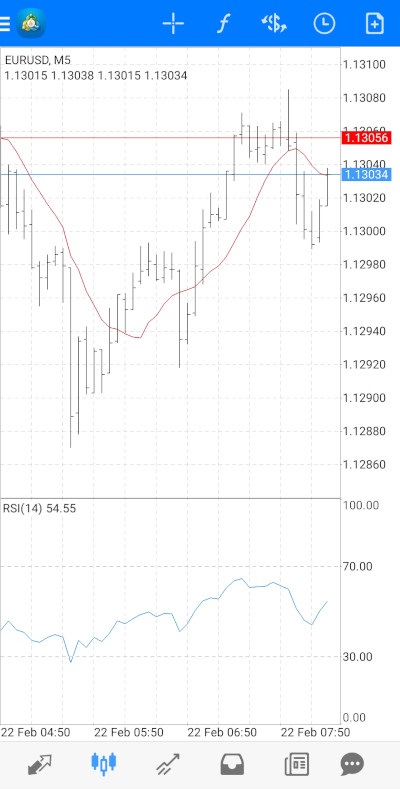
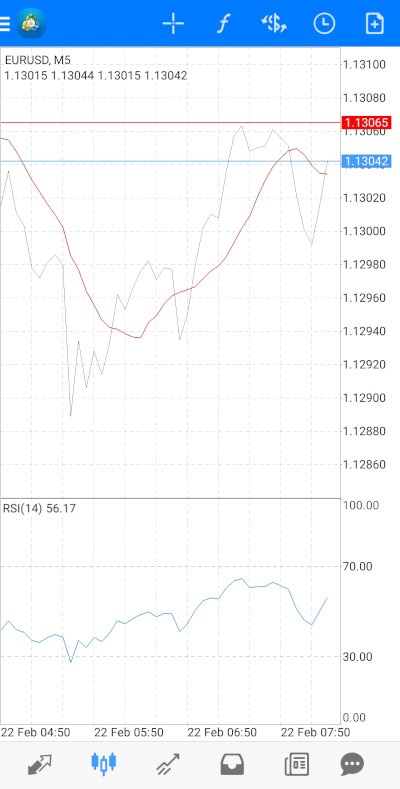
You will see the list of available chart types: Bar chart, Candlestick, and Line chart.
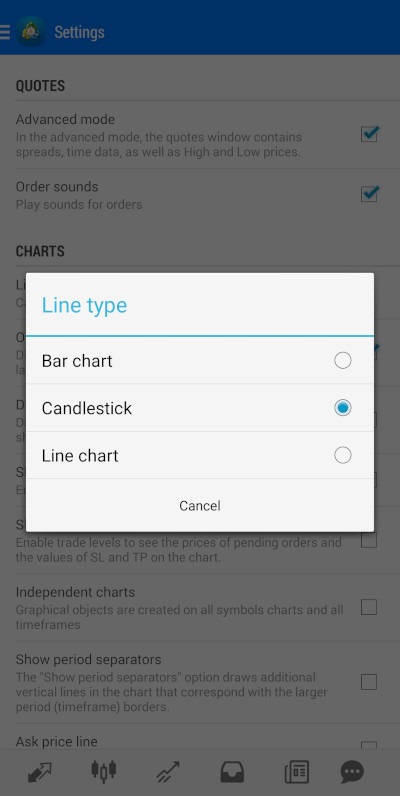
Tap on one of them to change the chart on the Charts screen to that type or tap the Cancel button if you do not want to change anything.
Adding, editing, and removing indicators
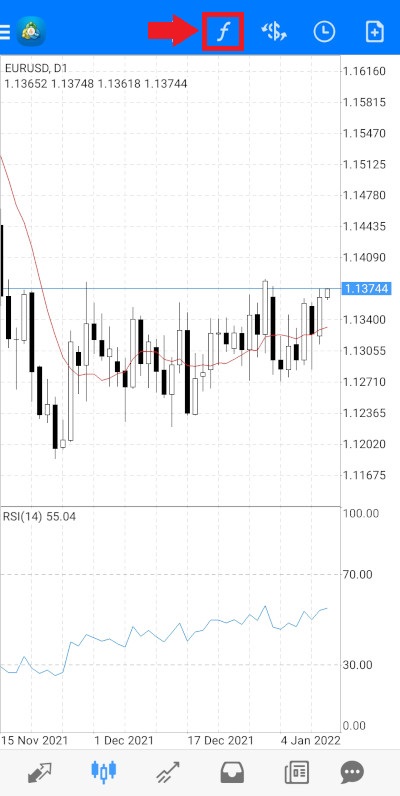
The MetaTrader 4 app supports a wide range of technical indicators. Depending on the indicator, it can be overlaid on the chart itself or displayed in a separate window. By default, the Chart screen shows one indicator of each type. The Moving Average is overlaid on the main window of the chart while the Relative Strength Index (RSI) is displayed in a separate window.
To add, edit, or remove indicators, you should tap the f button (Indicators) on the Instruments panel.
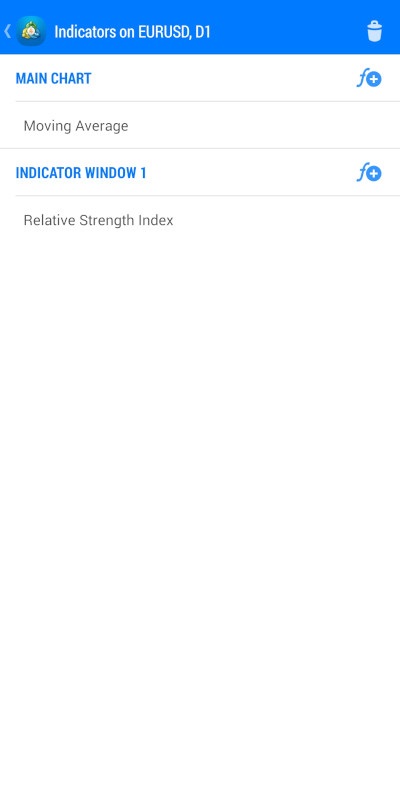
You will see the list of all the indicators present currently on the chart grouped by windows in which they are displayed. By default, you will have the Main Chart window, containing the Moving Average indicator, and the Indicator Window 1, containing the RSI indicator.
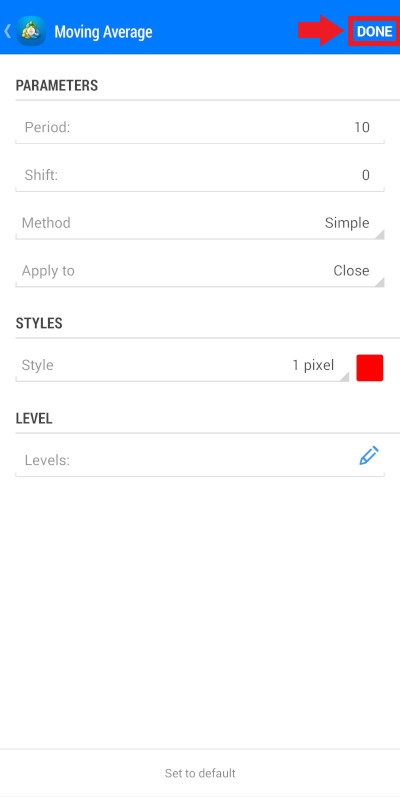
Click on any indicator to view its settings. Change any setting you need or click Set to default at the bottom to revert to default settings.
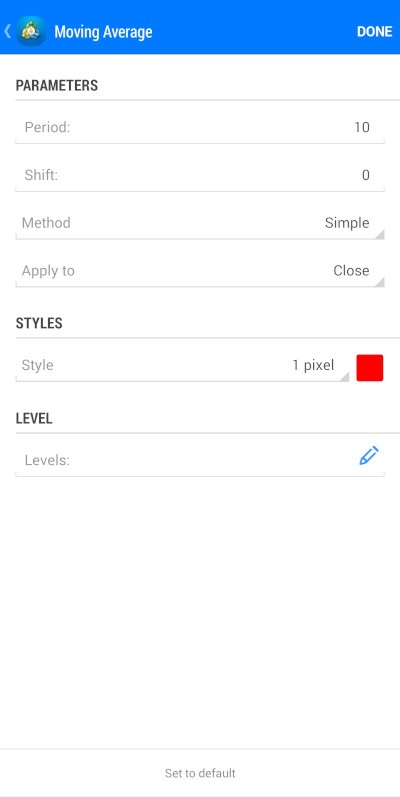
Click Done at the top right of the Edit settings screen to confirm the changes.
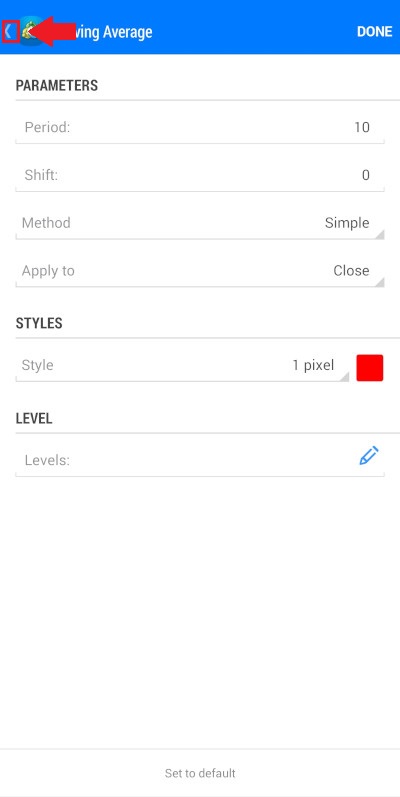
To go back to the Indicators screen without changing anything, click the Back button in the top-left corner of the screen.
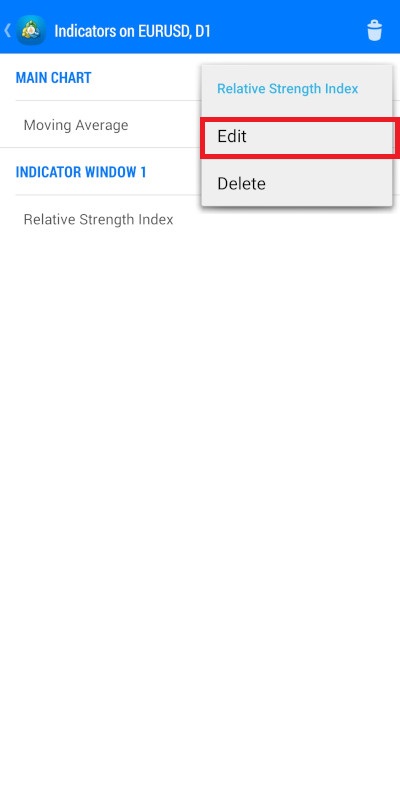
You can also
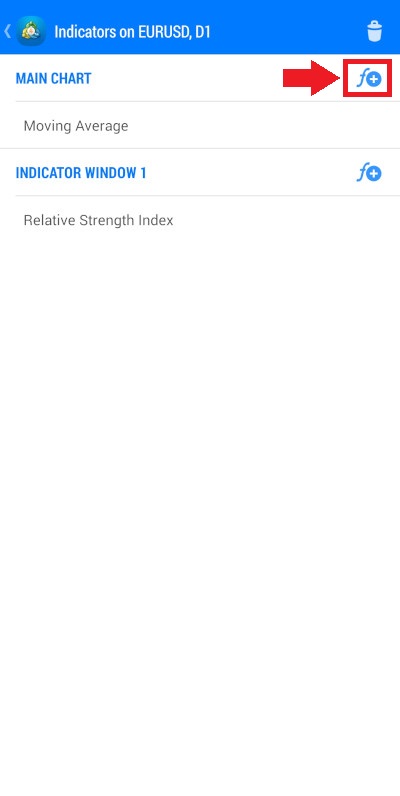
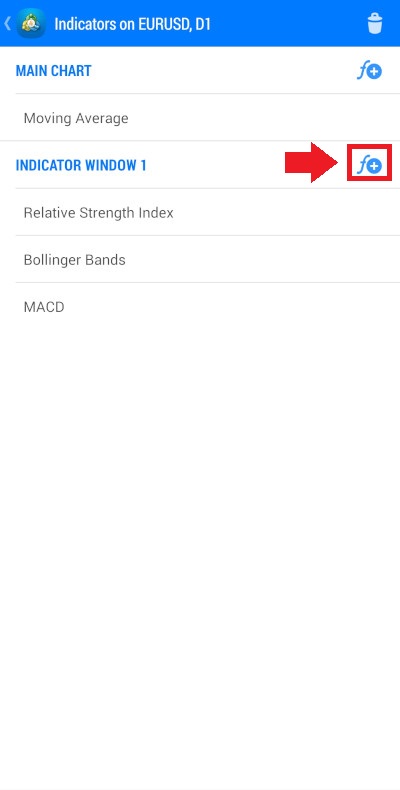
To add an indicator to the chart, press the f+ (Add indicator) button to the right of the name of the window to which you wish to add the indicator. Usually, it is the Main Chart window.
You will see the list of all the available indicators.
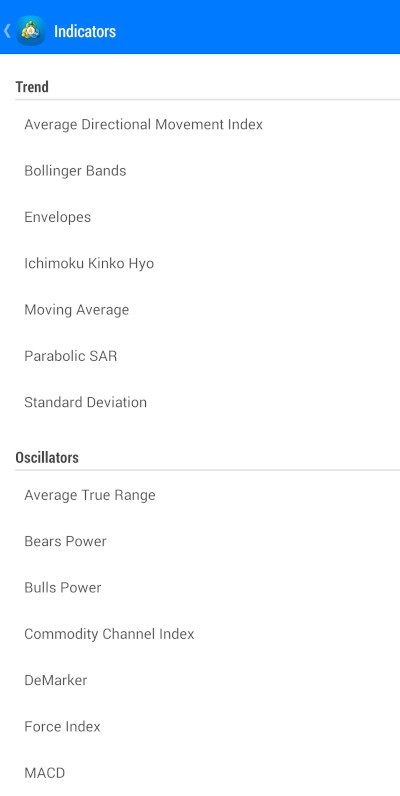
Choose the indicator you want. This will bring you to the Settings menu of that indicator. After adjusting the settings if needed press the Done button at the upper right corner of the Settings screen to add the indicator to the chart. Or tap on the Back button at the upper left of the screen to return to the indicator list without adding the indicator.
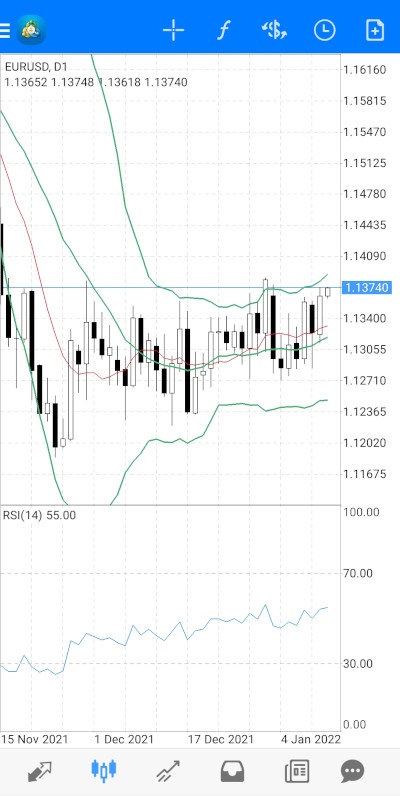
Depending on the indicator, it will be either drawn on the chart itself or displayed in a separate window. For example, if you add the Bollinger Bands indicator to the Main Chart, it will be overlaid on the chart itself.
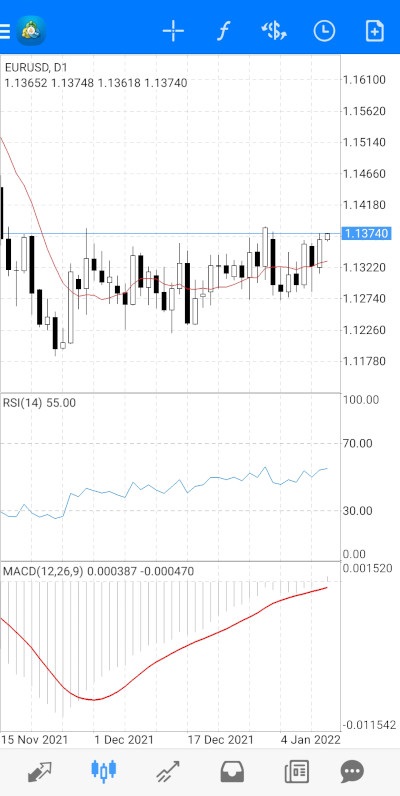
But if you add the MACD indicator, it will add its own window to the chart.
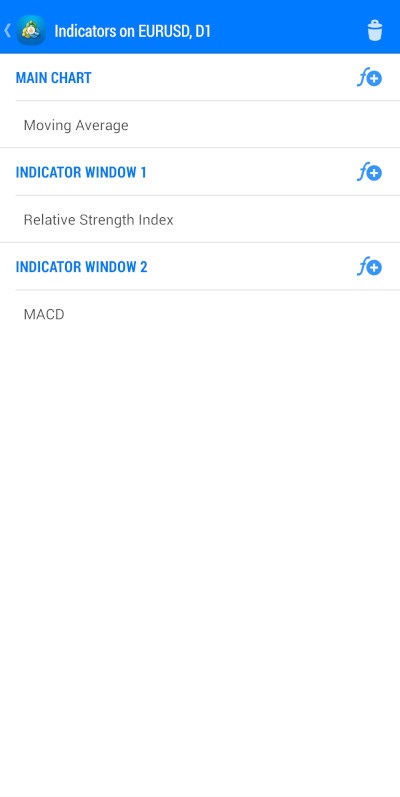
And in the list of indicators, it will be displayed in the Indicator Window 2.
The MetaTrader 4 app allows you to overlay indicators on top of each other in their windows. To do so, press the Add indicator button to the right of the name of the window to which you want to add it instead of the Main Chart.
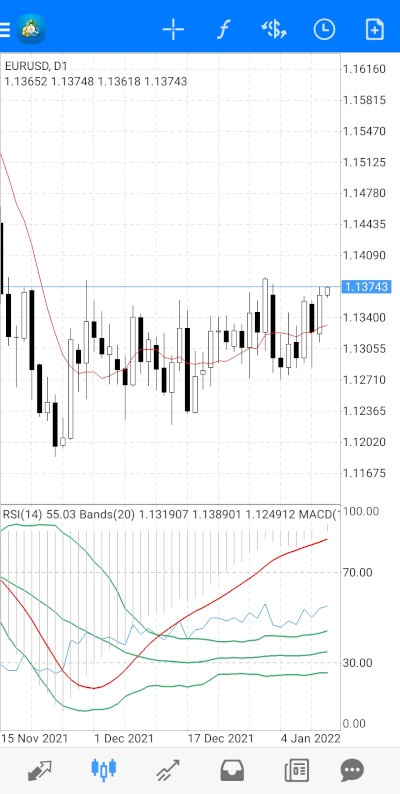
For example, this is how the chart will look if you add both Bollinger Bands and MACD to the Indicator Window 1 instead of the Main Chart window.
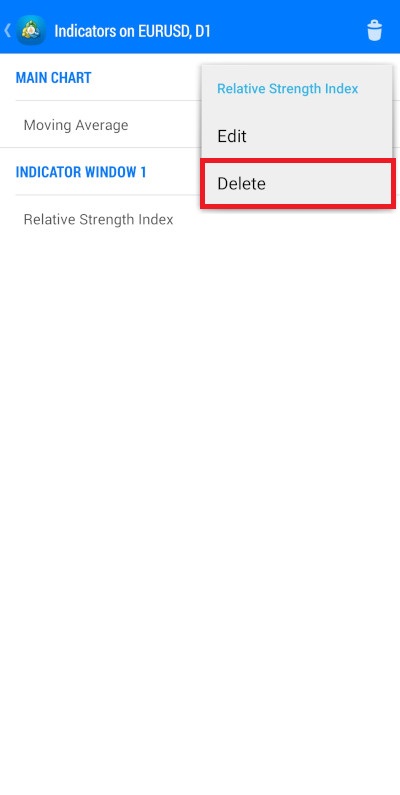
For deleting indicators, you have two options. To delete just one indicator, long press on that indicator and choose the Delete option from the menu.
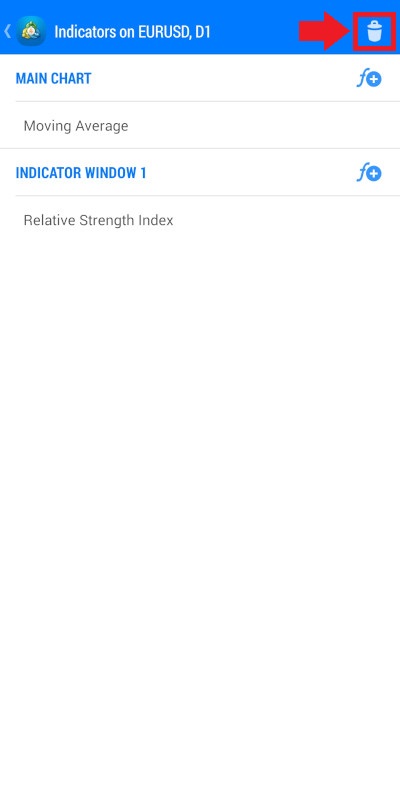
Deleting several indicators works similarly to deleting symbols from the Quotes screen. Press the Delete button at the top right of the Indicator list screen.
Tap on the checkbox to the right of the indicator to select it for deleting or tap again on the marked checkbox to deselect it. Tap the Select All button to select all indicators.
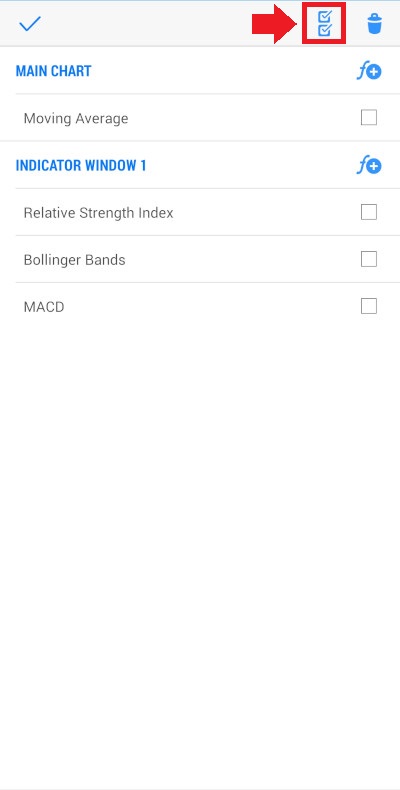
It will change from the image of marked checkboxes to the image of unmarked checkboxes. If you tap it again, then it will deselect all indicators.
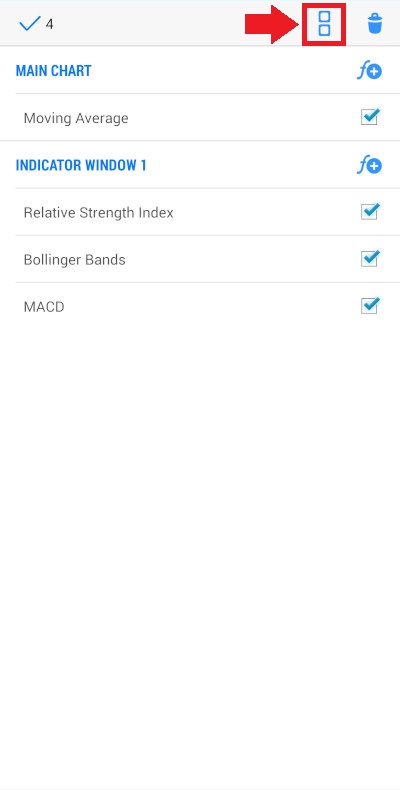
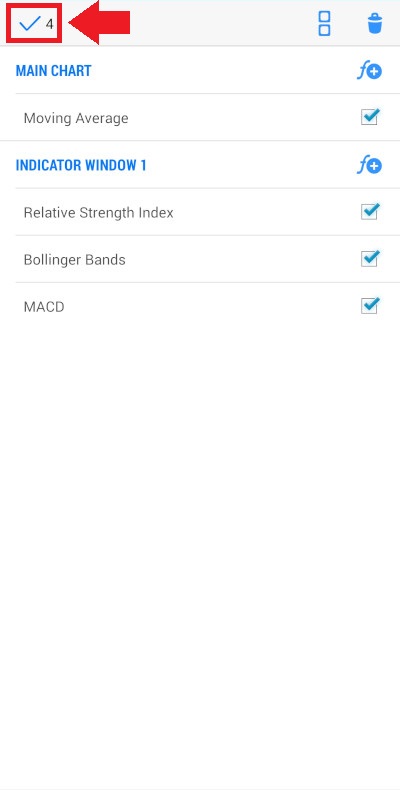
The number near the checkmark at the top left of the screen shows how many indicators you have chosen for deletion. You can tap on the checkmark to exit the Delete screen without deleting any indicators.
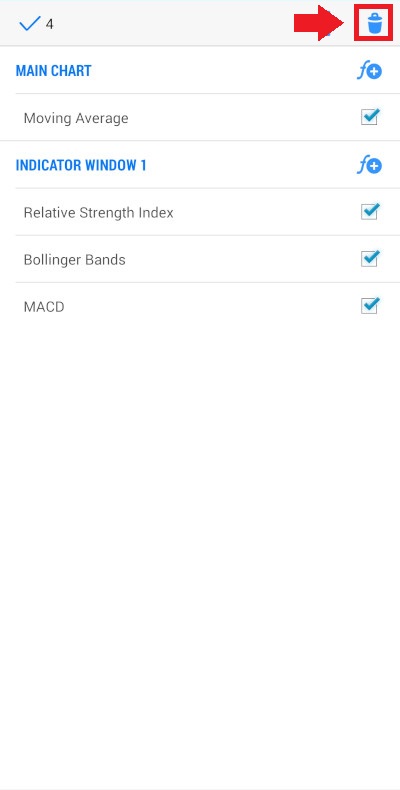
Or you can press the Delete button to delete the selected indicators.
You can open the Quick menu by tapping anywhere on the chart. It contains buttons that add an alternative way for using functions discussed previously: Crosshair, Indicators, and buttons for choosing various timeframes. But it also has one additional option that is available only in this menu — the button for adding objects.
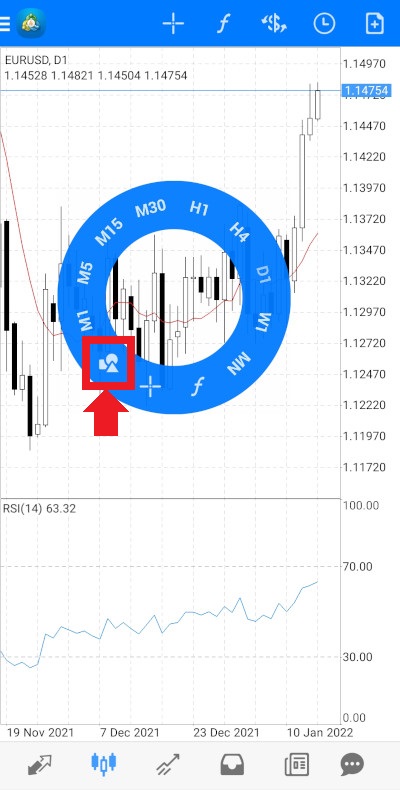
Tap on the Objects button to see the list of available objects divided by categories (lines, channels, etc.).
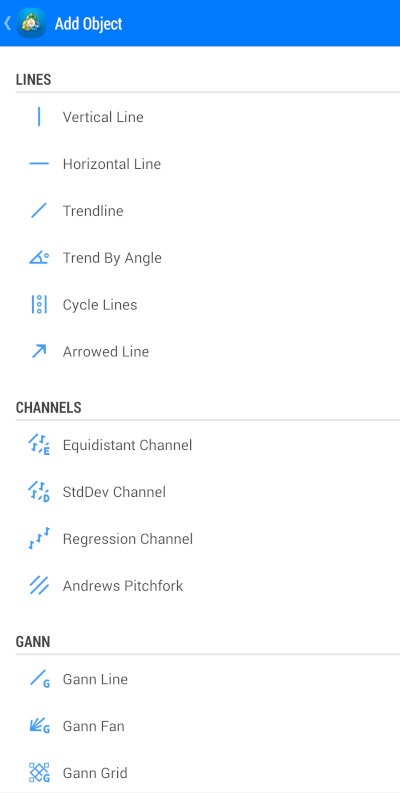
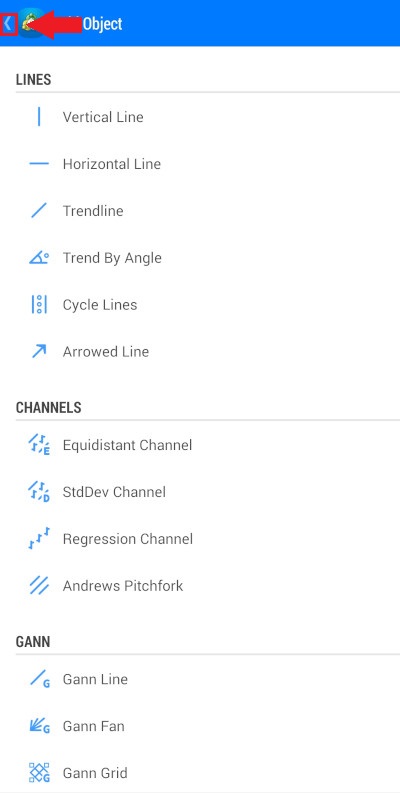
If you changed your mind about placing an object, tap the Back button at the top left of the screen.
Tap on the object you want to start placing on the chart. Drag the object to place it where you want it to be. While dragging the object, a small window at the upper left corner of the chart will show a
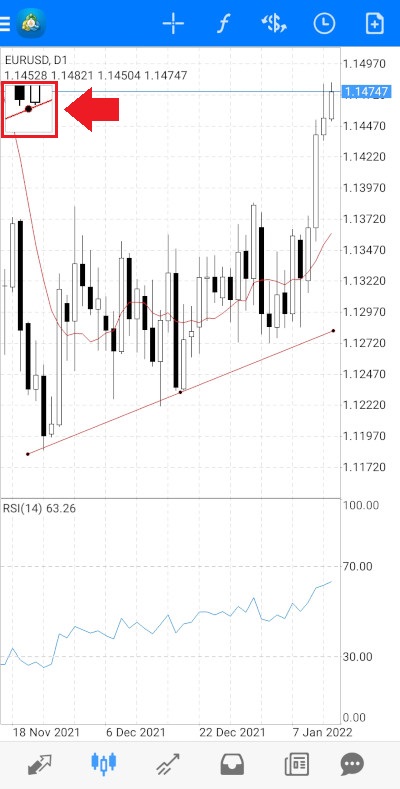
You can adjust the object after placing it. To do so, you need to select it first. By default, the last object you have placed is already selected. The selected object has black dots on it. To select an object if it is not selected tap on it. Tap on it again to deselect it.
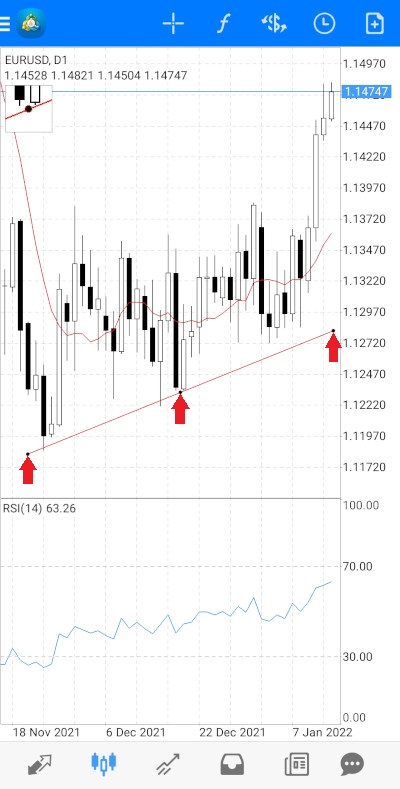
After selecting the object, press and hold on a black dot on the object and drag it to adjust the object. The exact type of adjustment varies depending on the object and the placement of the dot. For example, dragging a dot at either end of a trendline will change the angle of the trendline. But dragging the dot at the middle of the trendline will move the whole trendline.
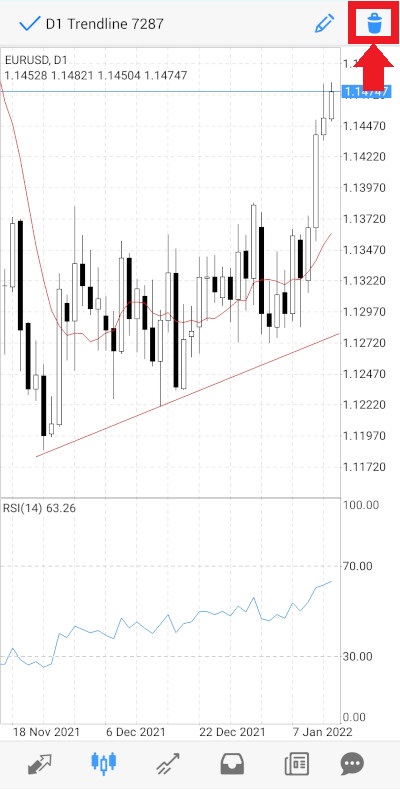
If you press and hold on the object, the object details will appear at the top of the Charts window. The details will contain the object name and several buttons. The checkmark on the left side of the Details panel will close the panel.
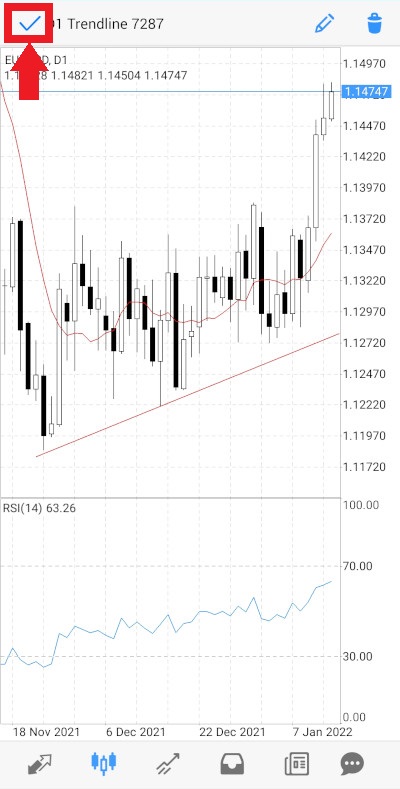
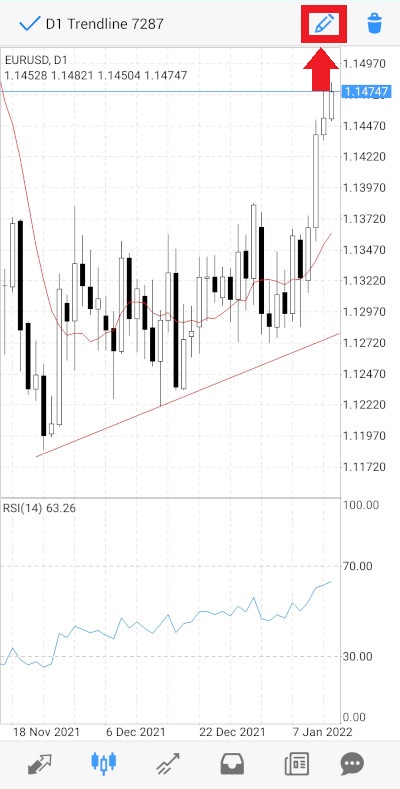
Tap the Edit button on the right side of the Details panel to make more precise adjustments to the object.
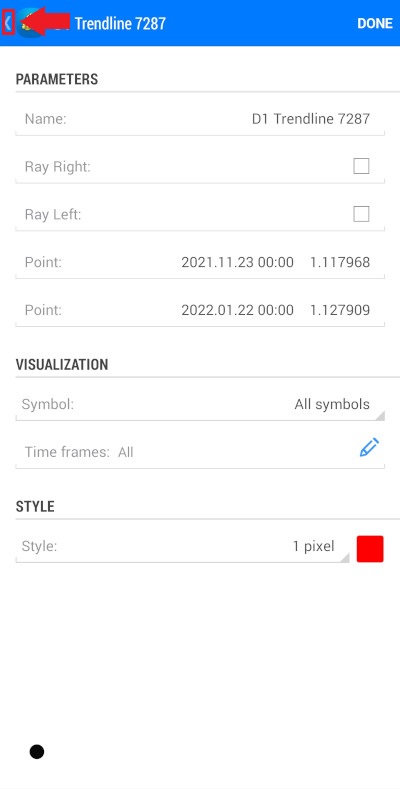
After tapping the Edit button, you will see the Settings screen for the selected object. You can adjust such properties of the object as the object name, its placement, its look. The exact options depend on the object. Click the Done button at the top right to confirm changes.
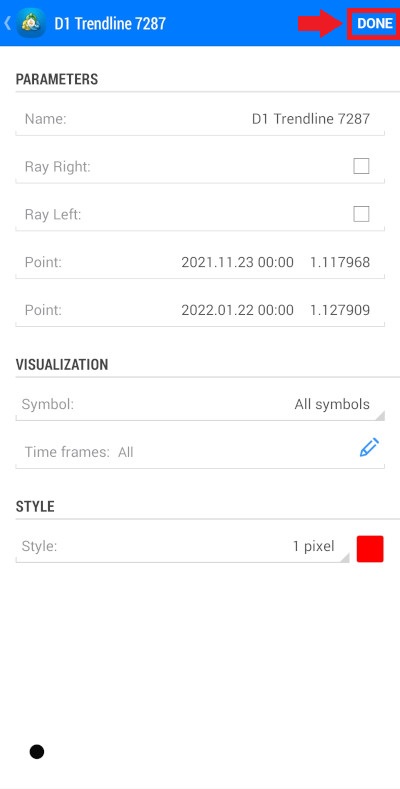
Or tap the Back button to exit the Settings screen without making any changes.
To delete an object, open the Details panel for the object by tapping and holding on it. Then press the Delete button at the top right of the Details panel to delete the selected object.
Opening positions and placing orders
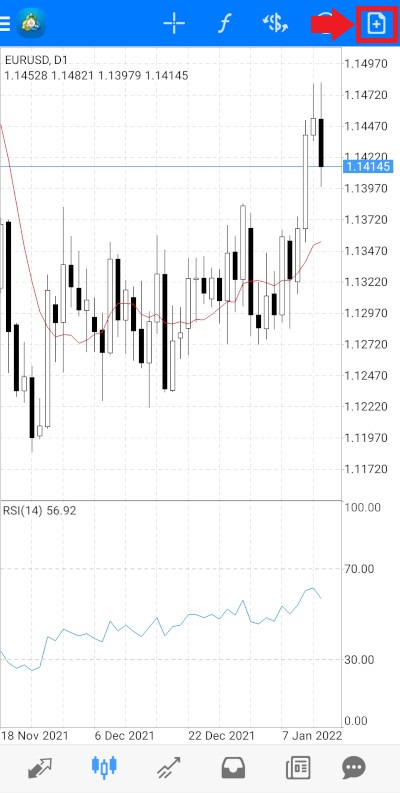
You can open a position or place an order both on the Quotes screen and the Charts screen. To open a trade on the Charts screen, simply tap on the rightmost button (New Order) on the Instruments panel.
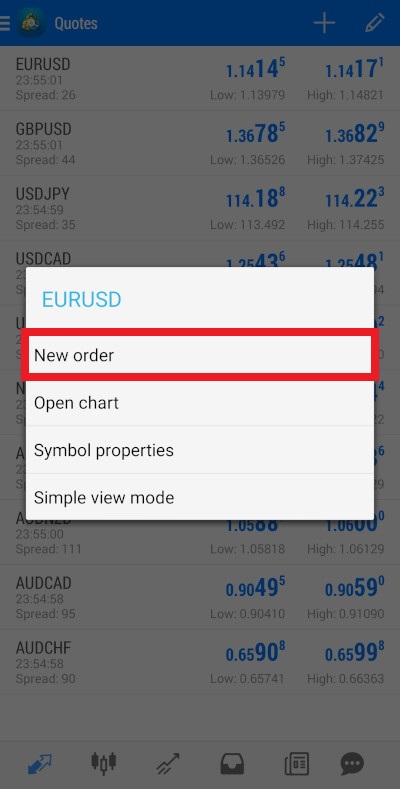
On the Quotes screen, tap the symbol of the market you want to trade and then choose New Order from the menu.
You can choose what market you want to trade directly from the New Order screen. To do so, press on the $ icon at the top right of the screen and choose the symbol for the market you want from the drop-down menu.
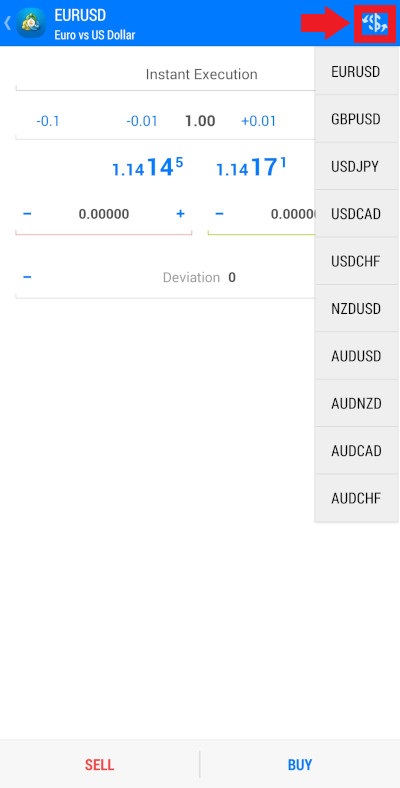
Choose the type of the order from the drop-down list at the top of the screen.
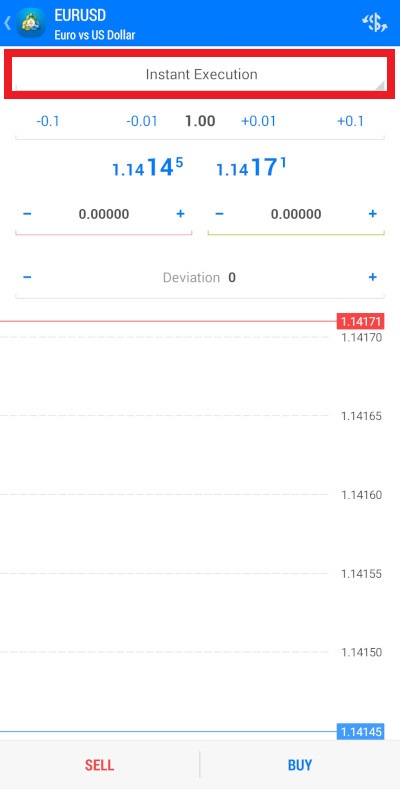
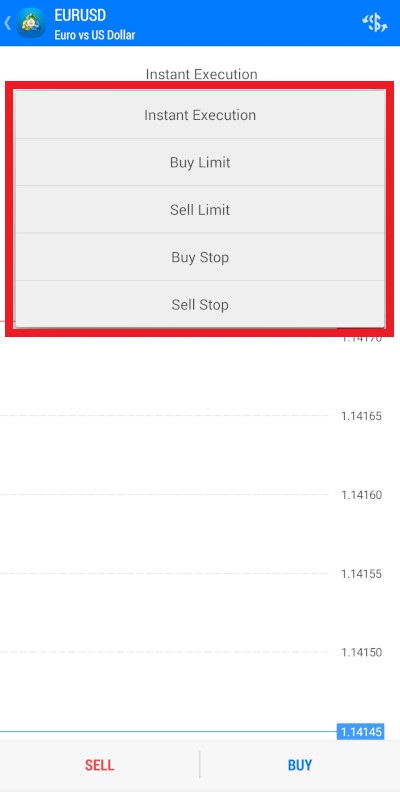
You can choose from Instant Execution (buy/sell at the current price), Buy Limit, Sell Limit, Buy Stop, Sell Stop.
Underneath, you can see the position size. You can decrease it by 0.1 or 0.01 by tapping the appropriate buttons on the left or increase by the predetermined sizes by tapping the buttons on the right.
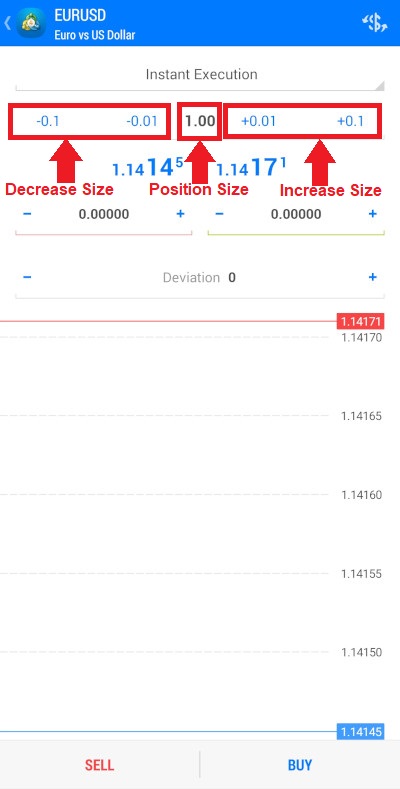
Tap on the position size itself to enter it manually.
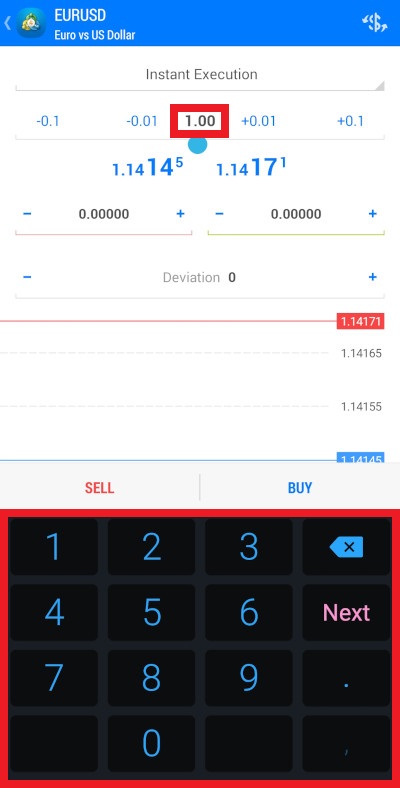
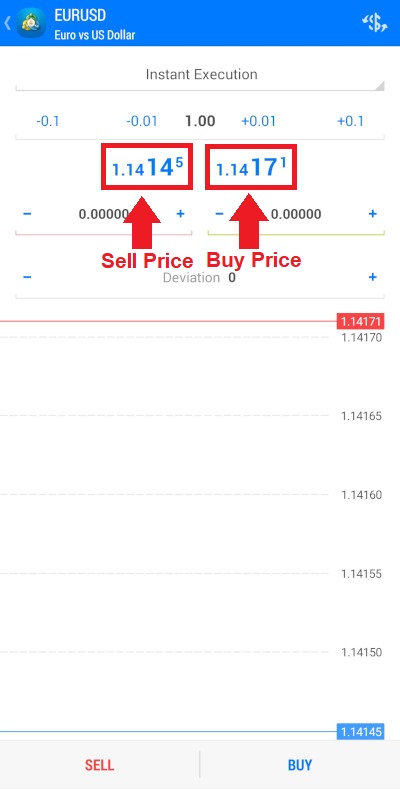
Below you will see two prices. The price to the left is the sell price and the price on the right is the buy price.
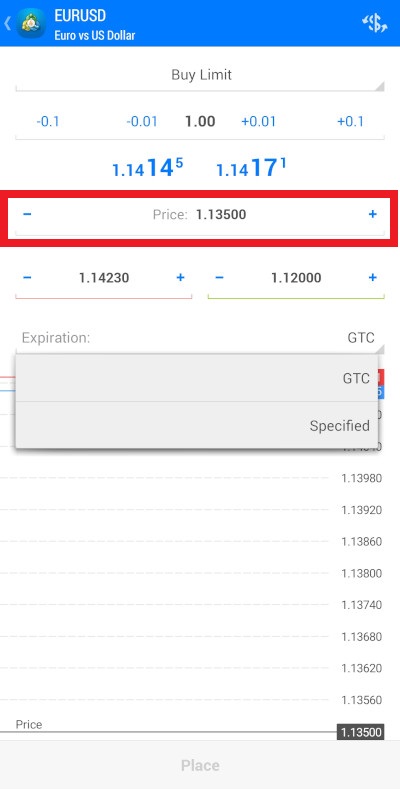
If you have chosen any type of order other than Instant Execution, use the field below the sell/buy prices to enter the price at which you want to buy or sell the market. Use the + and - signs on the sides of the field to increase and decrease the size or tap on the filed itself to enter the number manually.
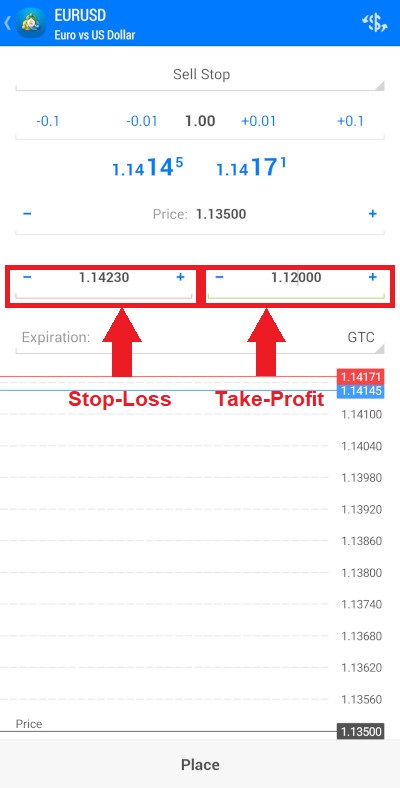
Below, there are two fields — red and green. Enter your stop-loss in the red field and take-profit in the green field. You can the + and - symbols on the sides of a field to increase and decrease the number or tap on the field itself to enter the number manually.
The next field will depend on the type of order you have chosen.
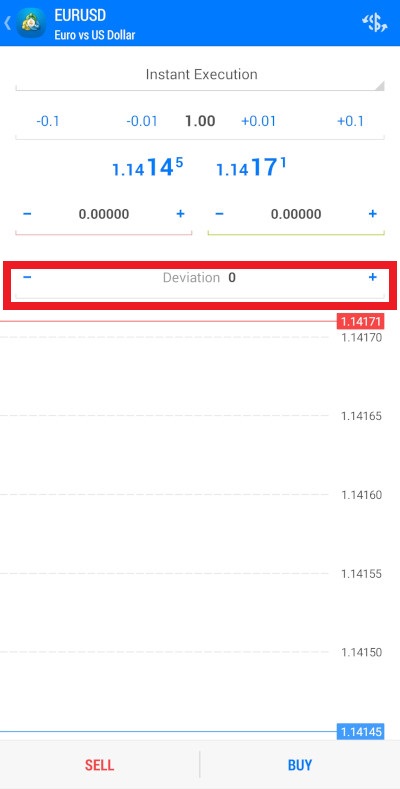
If you have chosen Instant Execution, you will see the field for entering deviation, which allows you to set the maximum deviation in pips from the quoted price in case your broker will be unable to execute the order at the quoted price. The field works the same as the fields described above: you can use the + and - signs to adjust the number or enter it directly by tapping on the field.
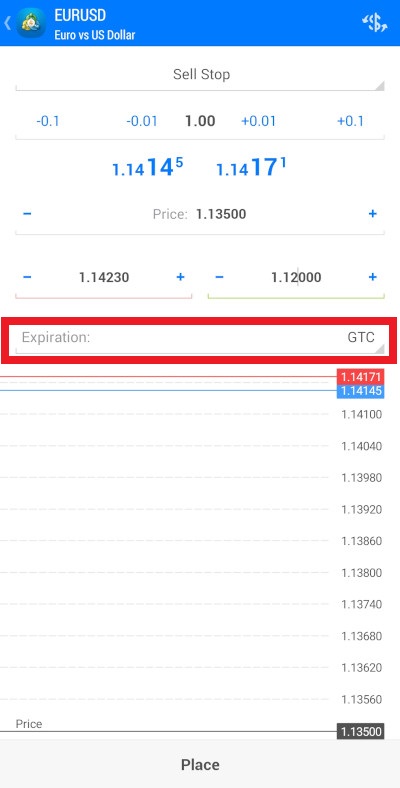
Otherwise, you will see the drop-down menu for choosing the order expiration date.
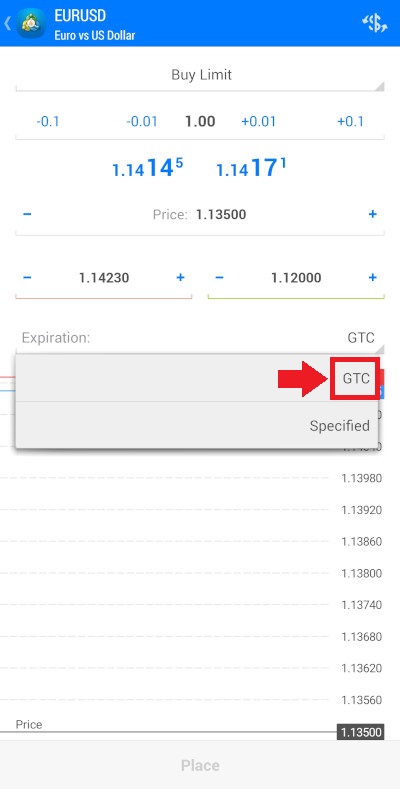
You have two options: GTC and Specified. GTC stands for Good-Till-Canceled and means that the order will be active until it is triggered or you manually cancel it.
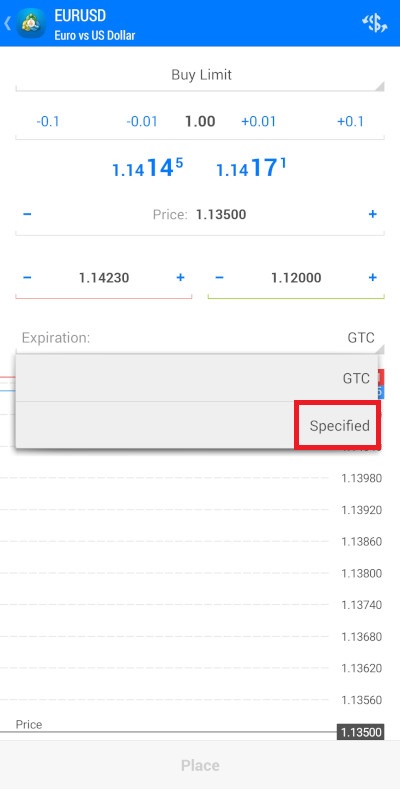
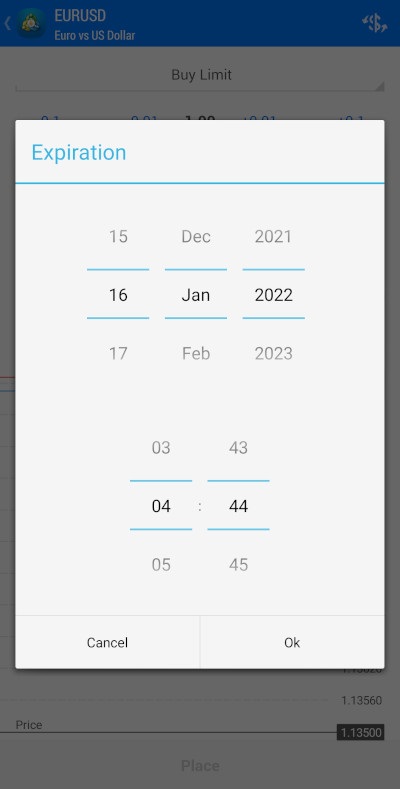
If you choose the Specified option, you will have to enter the date and time. If the order is not executed before the specified date, it will be canceled automatically.
You can set the day, month, year, hours, and minutes by pressing and holding on the value you want to change and then scrolling it up or down.
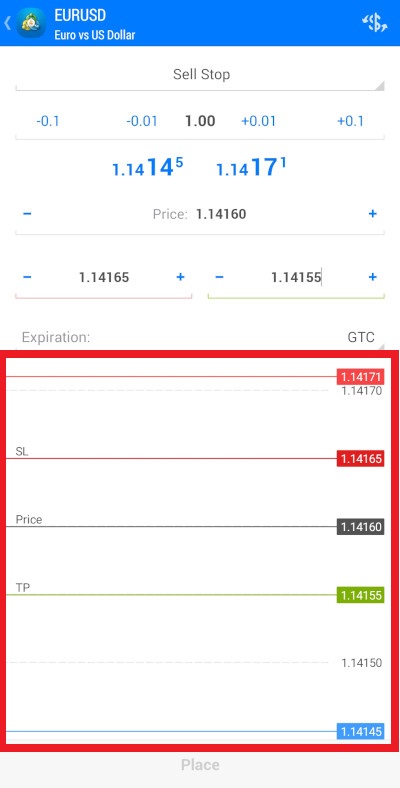
On the chart below, you can see two lines. The blue line shows the sell price, and the red line shows the buy price. If you have set stop-loss and take-profit, they will also be shown on the chart. The stop-loss is indicated with a slightly darker red line with the SL letters. The take-profit is indicated by a green line with the TP letters. In the case of Limit or Stop orders, you will also see a dark gray line with the label Price, indicating the price you set for order execution.
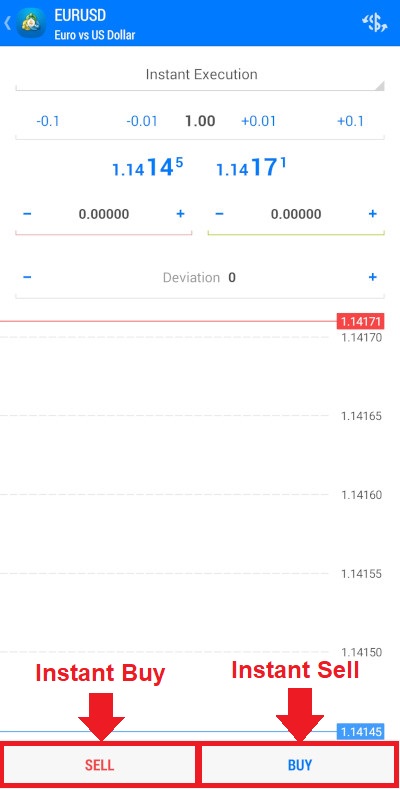
After you set everything up, tap the Sell or Buy buttons to execute the order instantly (Instant Execution).
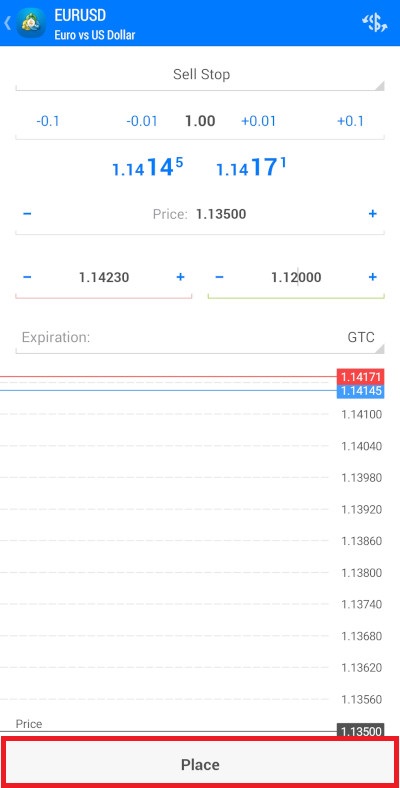
Or tap Place to place a stop or limit order.
Trade screen
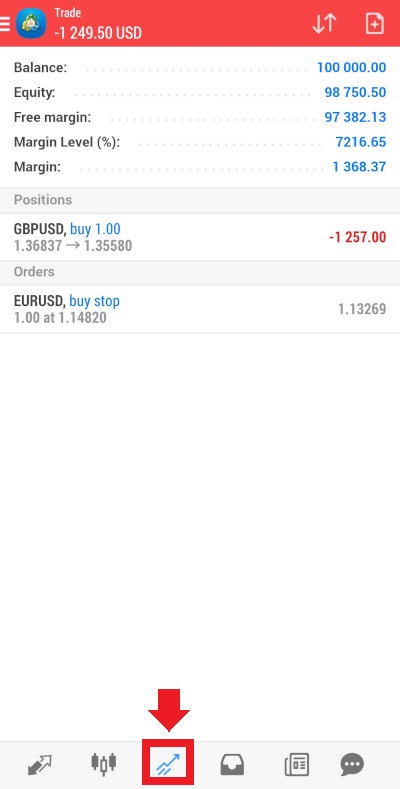
To open the Trade screen, tap the Trade icon on the Navigation Menu at the bottom.
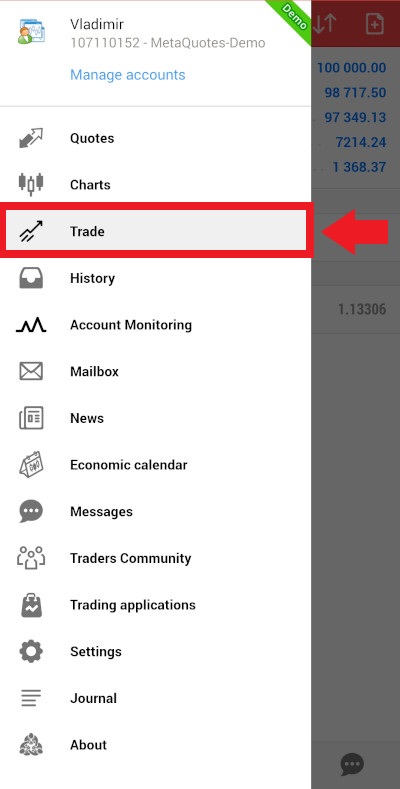
Or choose the appropriate option from the Main menu.
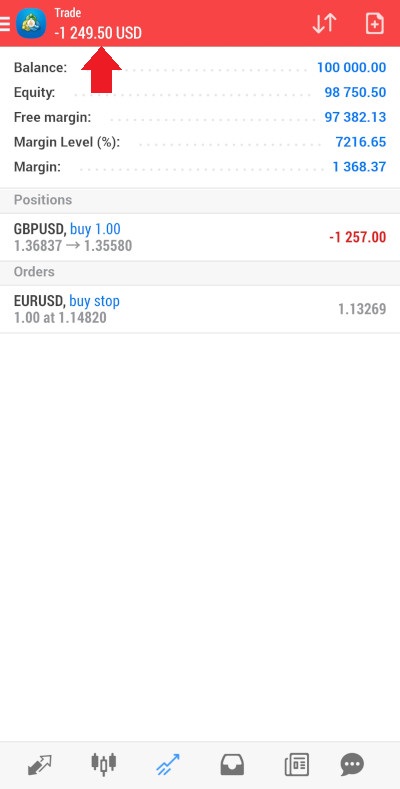
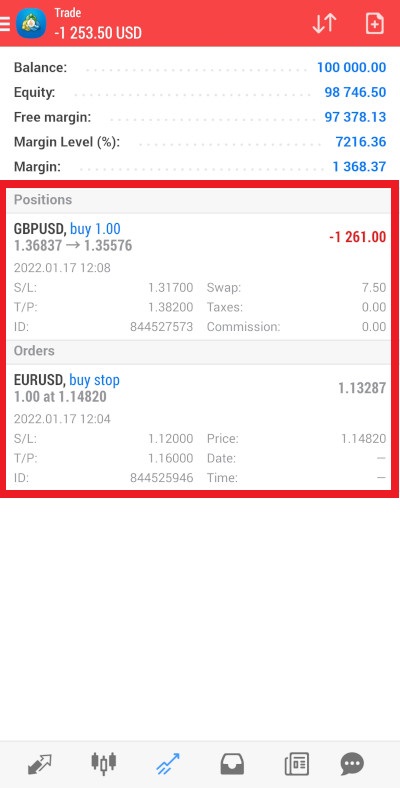
The Trade screen allows you to see your account balance as well as to see and modify all your open positions and orders. At the top of the screen, you can see the net profit or loss from all your open positions. The background will be blue in case of a positive number, indicating profit, or red in case of a negative number, indicating loss.
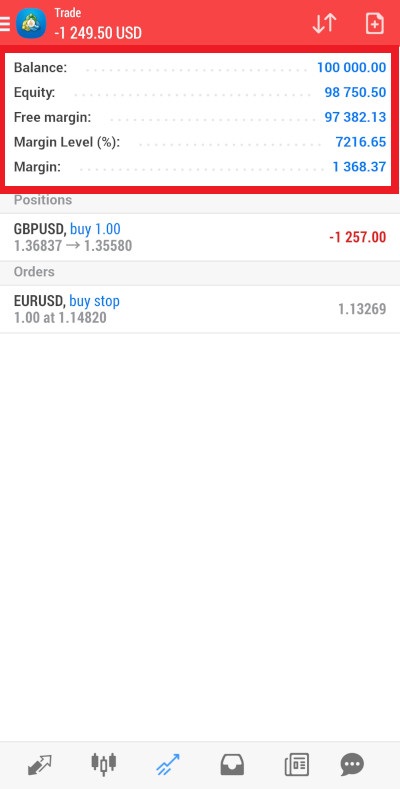
Below, you will see the details about your account balance. Balance shows your account balance disregarding any profits or losses from your open positions. Equity shows your account balance including the net profit or loss from your open positions. The Free margin shows the funds in your account that are not attributed to any open positions. Margin level is the amount of funds in your account divided by the margin requirement for opening a position. The Margin shows the amount of funds attributed to open positions.
The Positions section shows all your open positions.
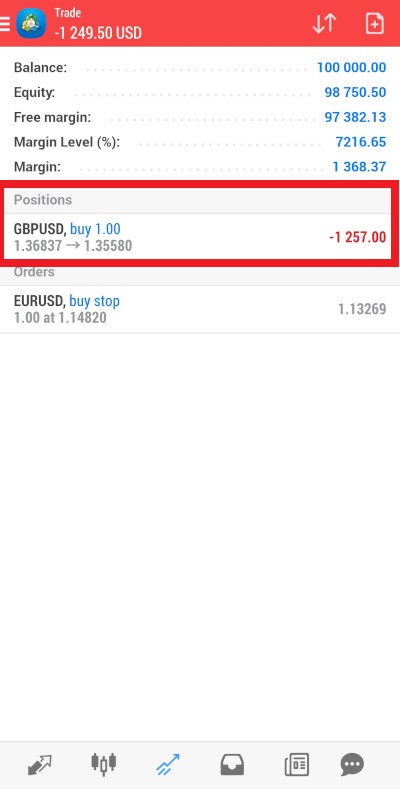
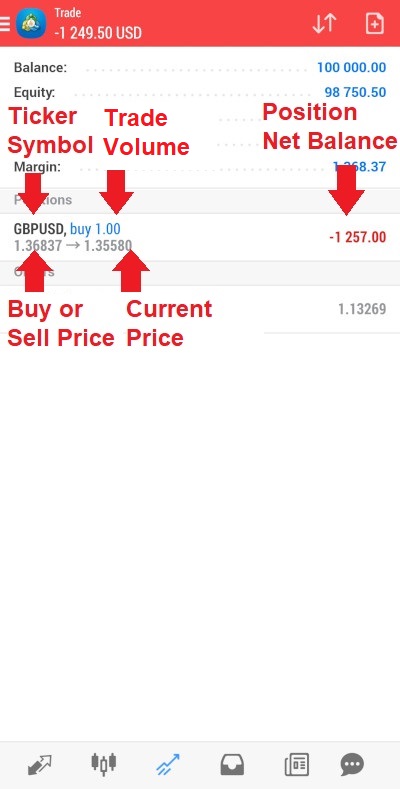
Each entry shows details about a particular position: ticker symbol, the amount bought or sold, the price at which the asset has been bought or sold, the current price, the current loss or profit on the position.
The Orders section shows all the orders you have placed.
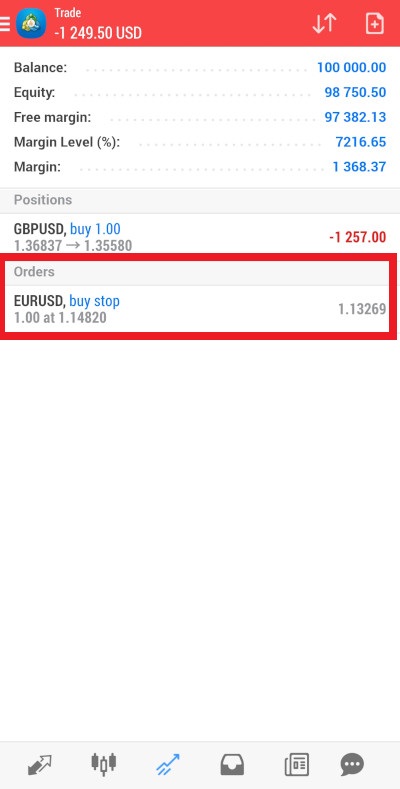
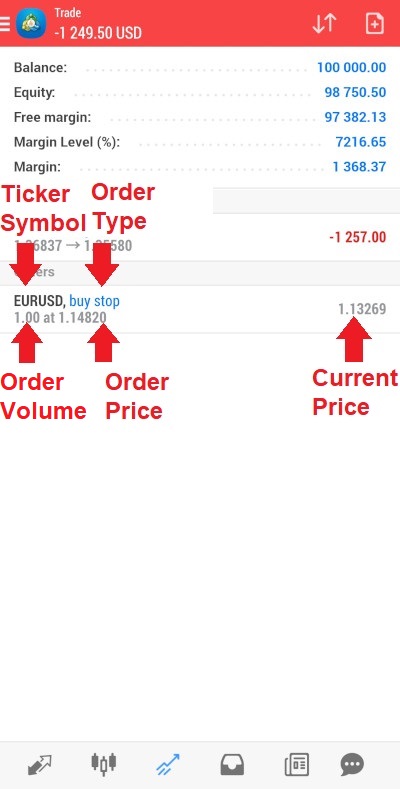
Each entry shows details about a particular order: ticker symbol, type of order, the amount to buy or sell, the price at which you wish to buy or sell, the current price.
You can tap on any entry to see additional details about it. Open positions and orders have some similar details shown: stop-loss level, profit-taking level, the ID of the particular trade. Any position will also show additional details: swap amount, tax amount, and commission. Orders will have their own additional details: price at which the order will be executed, and also date and time of expiration in case you set up the order to expire if it is not realized until that date. Tap on the entry again to hide the additional details.
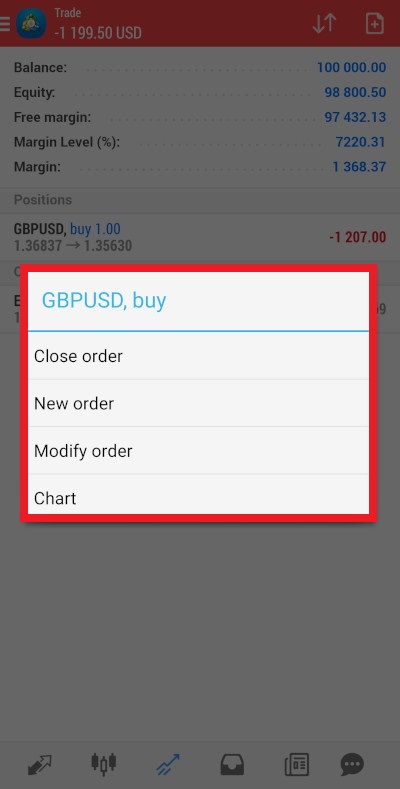
Long-press on any entry to open a menu to modify it. The menu will depend on whether you have pressed on a position or an order. If you have pressed on an open position, you will have the following options: Close order, New order (which will open the New order screen discussed in the previous chapter), Modify order, Chart (which will move you to the Charts screen for that market).
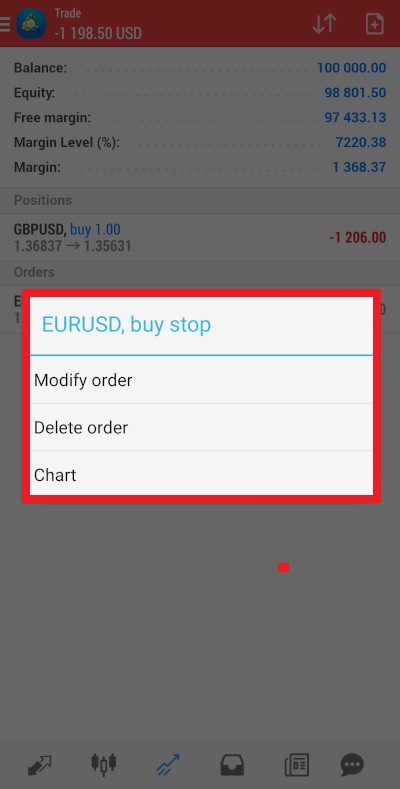
If you have pressed on an order, you will have the following options in the menu: Modify order, Delete order, Charts (which will bring you to the Charts screen).
If you slide any entry to the left, you will see a Quick menu for that entry with three options. The checkmark icon will send you to the Close order screen.
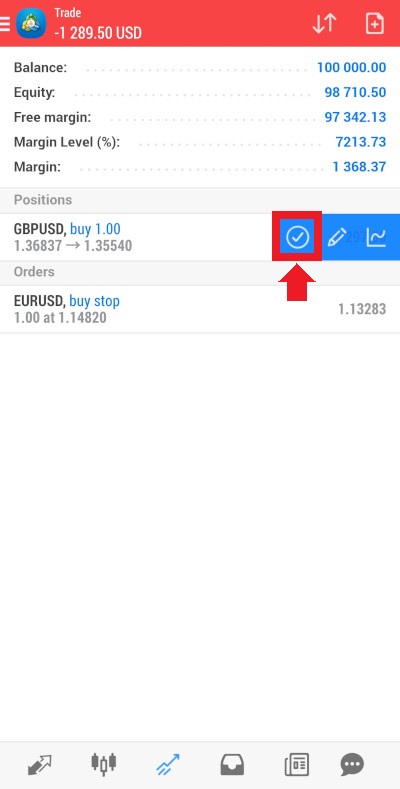
The pencil icon allows you to modify the order.
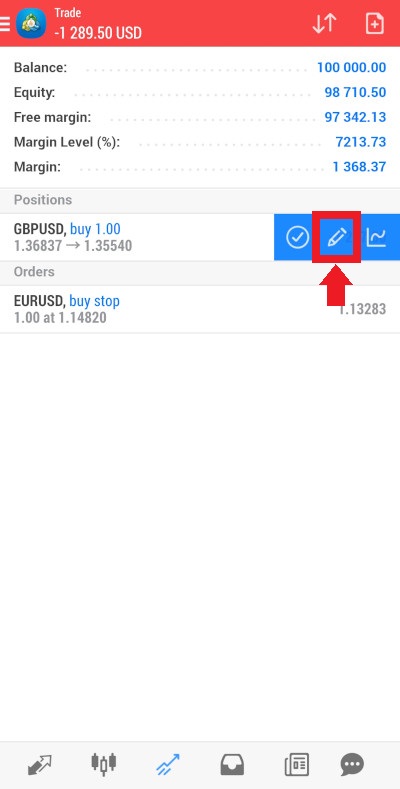
The icon with a chart will send you to the Charts screen for that market.
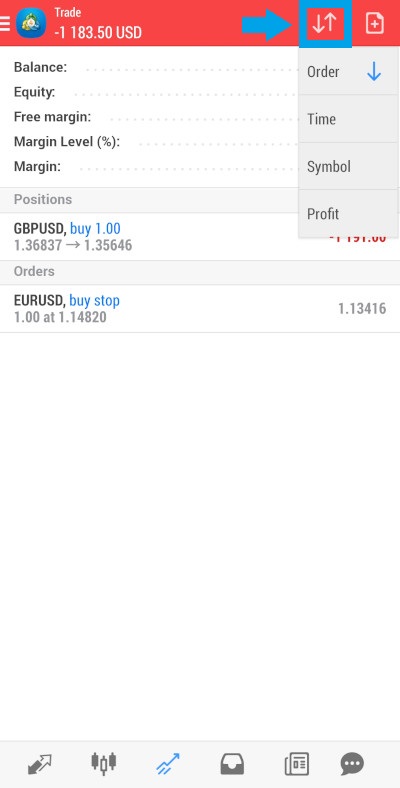
To choose the order of entries, click on the icon with the up and down arrows (Sorting) in the Instruments panel. It will bring up a
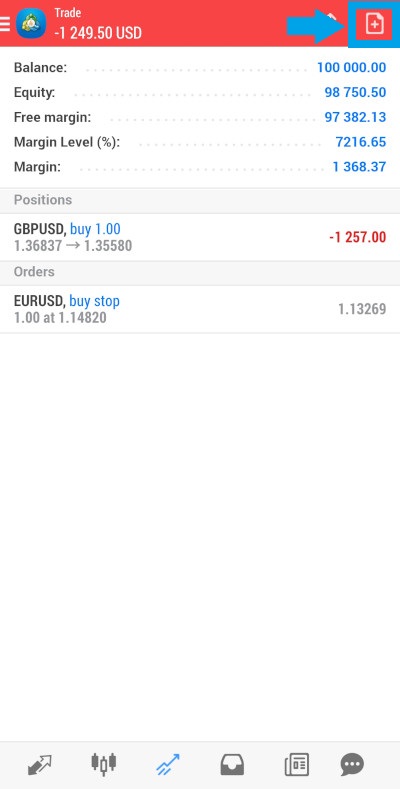
To the right of the Sorting icon is the New Order icon. It will send you to the New order screen discussed in the previous chapter.
History screen
The History screen shows all of your realized trades. To get to the screen, choose it from the Navigation Menu at the bottom.
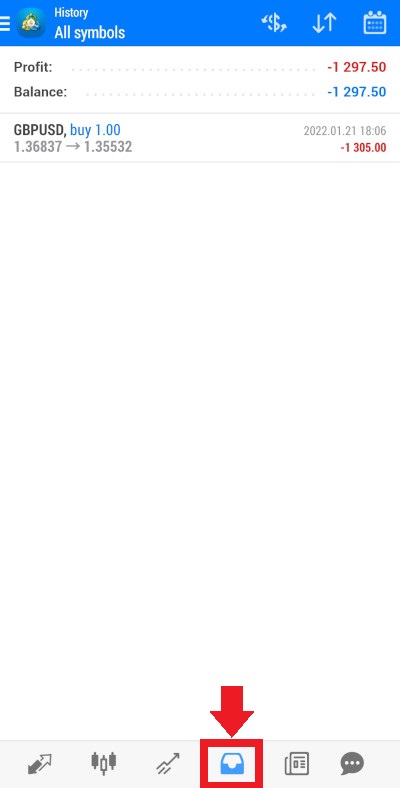
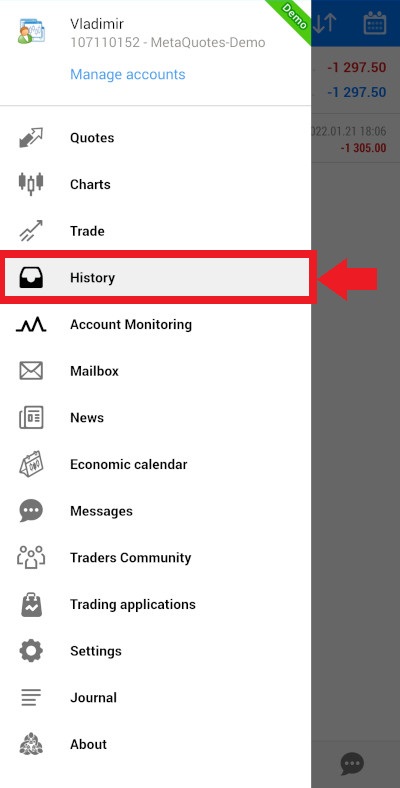
Or choose the History option from the Main Menu.
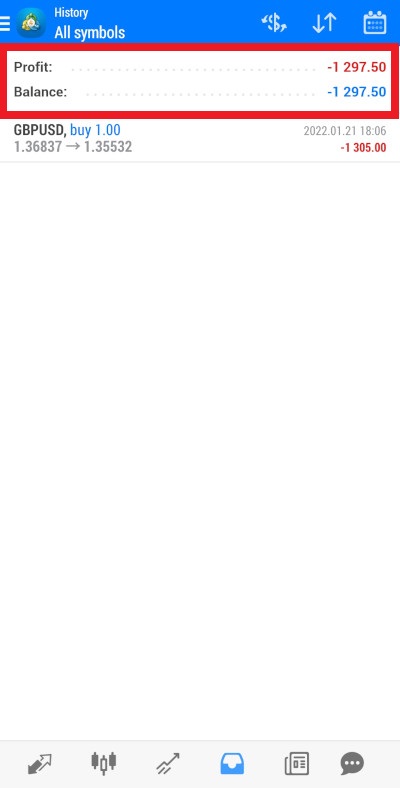
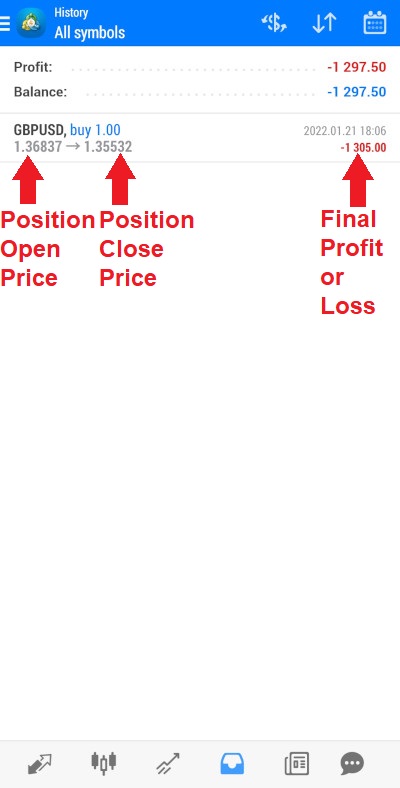
The screen shows the net profit or loss for the displayed period, deposits/withdrawals, and the total balance change.
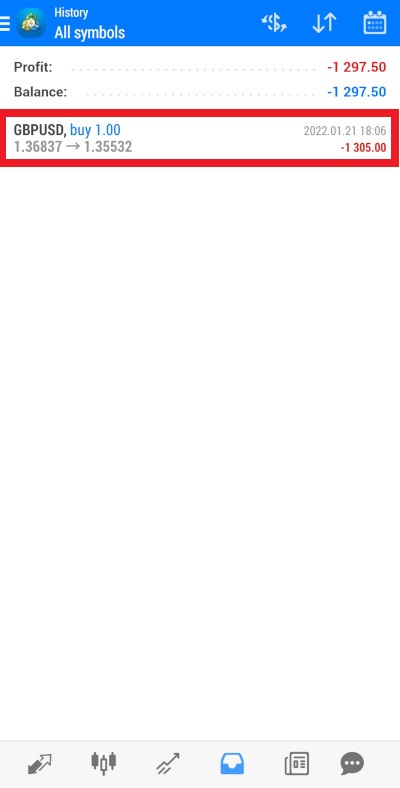
Beneath, you can see all the realized positions for the chosen period.
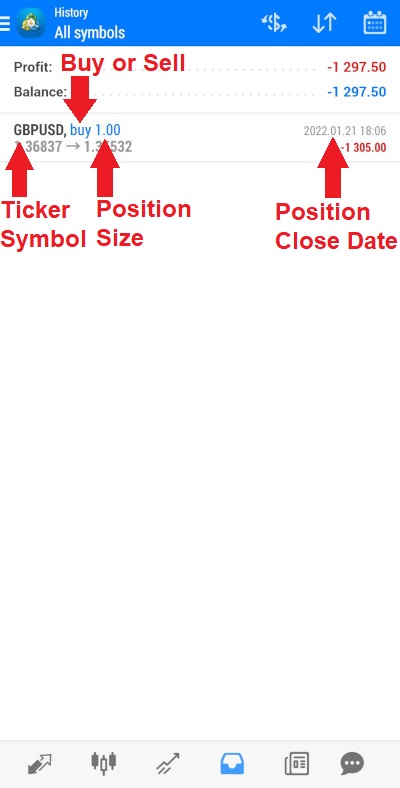
The details for each entry are similar to those on the Trade screen: ticker symbol, whether you were buying or selling, position size, price the position was opened at, price the position was closed at, date and time when the position was closed, the resulting profit or loss.
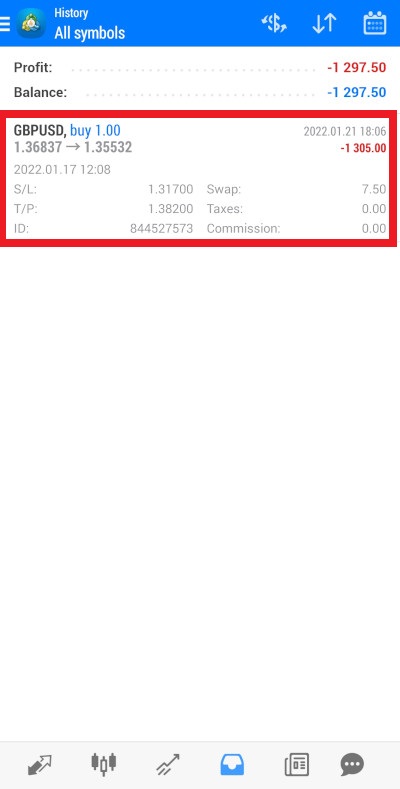
Tap on any entry to see additional details. They are the same as on the Trade screen, except you will also see the date and time when the position was opened. Tap on the entry again to hide additional details.
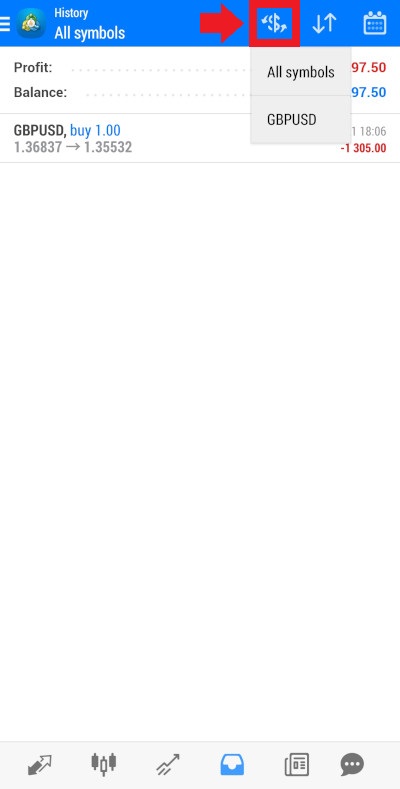
Tapping the $ (Symbol) icon in the Instruments panel will bring a
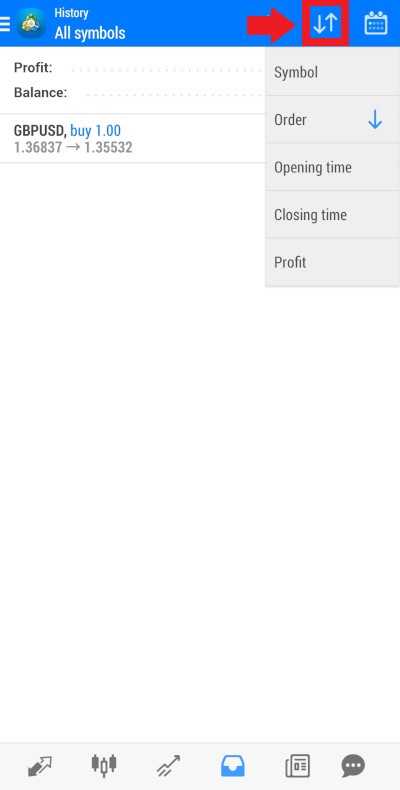
Tapping the up and down arrows icon (Sorting) will bring a
To choose the period for which to show the history, tap on the calendar icon (Period:) in the Instruments panel. By default, the history is shown only for the current day (Today setting). You can choose from the following predetermined settings: Today, Last week, Last month, Last 3 months.
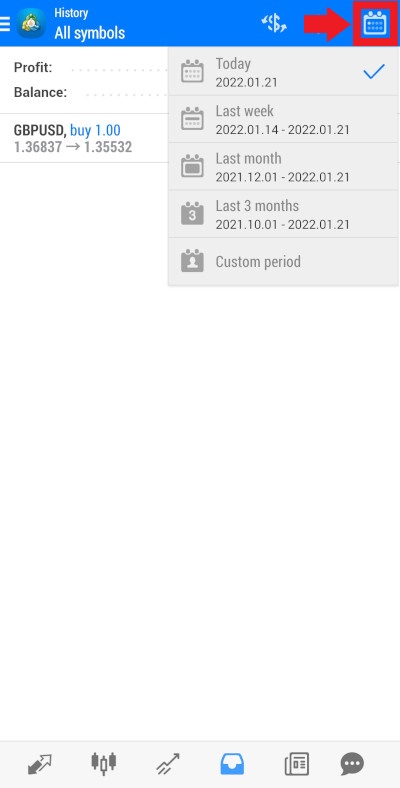
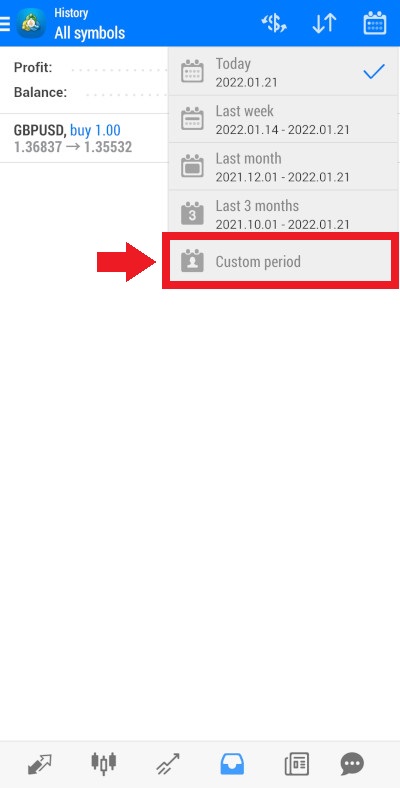
Additionally, you can set a Custom period.
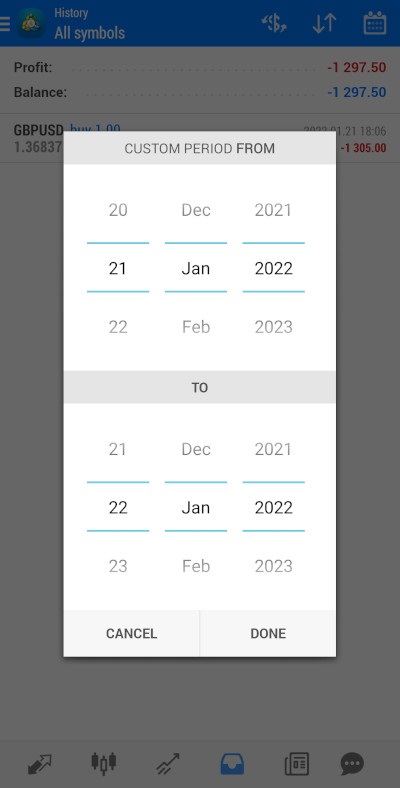
It will bring up the screen for setting up the day, month, and year for the start and the end of the period. Slide each value up or down to change it. Click Done after you have finished setting up a custom period. Or click Cancel if you changed your mind and no longer want to set a custom period.
News screen
To get to the New screen, choose it from the Navigation Menu at the bottom.
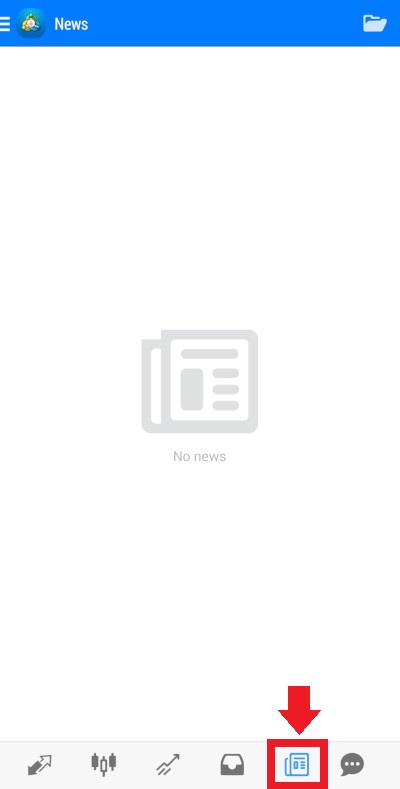
Or choose the News option from the Main Menu.
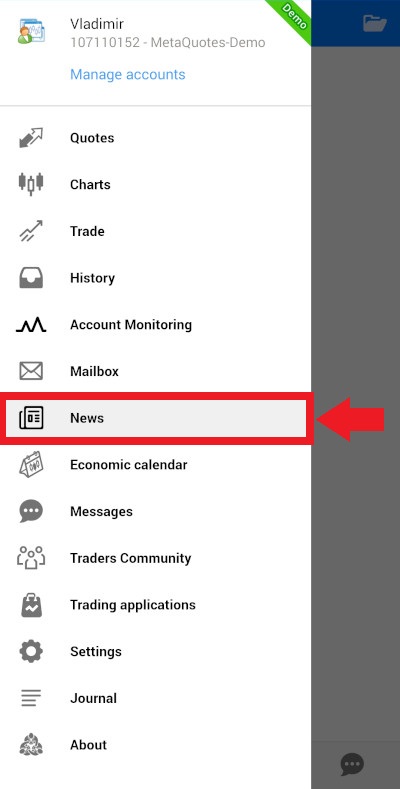
News is provided by your broker. Not all brokers use this feature, so do not be surprised to see an empty News screen.
Messages screen
To get to the Messages screen, tap on the Messages icon on the Navigation Menu at the bottom.
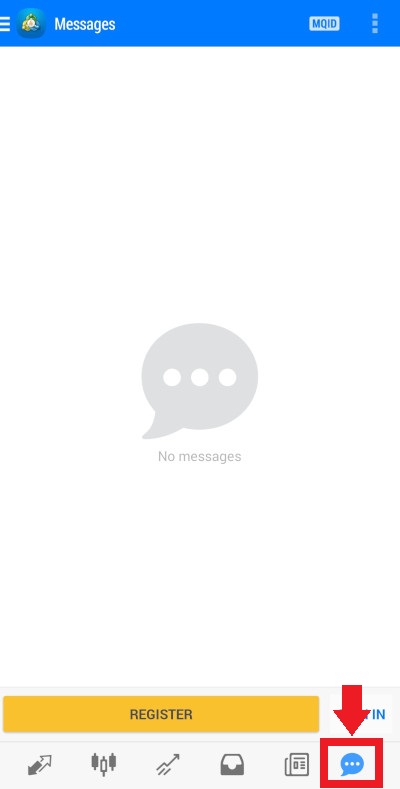
Or choose the Messages option from the Main Menu.
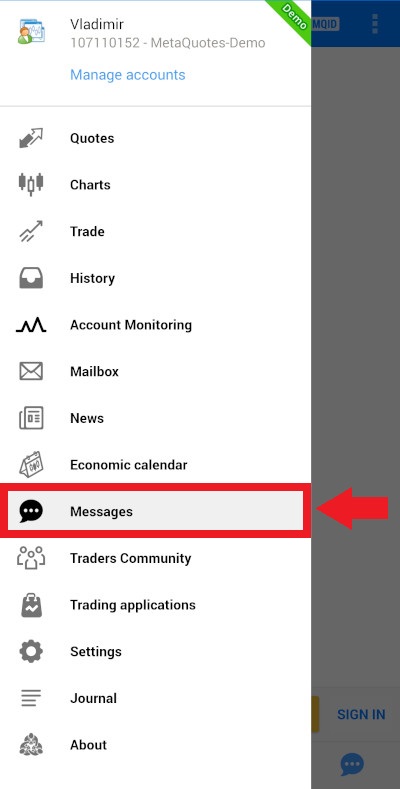
To use the chat, you will have to register on the MQL5 site. If you have an account on the site, you will be able to chat with other traders registered on the MQL5 site.
Mailbox
Tap on the Mailbox option in the Main Menu to see the emails you have received in the MetaTrader 4 app.
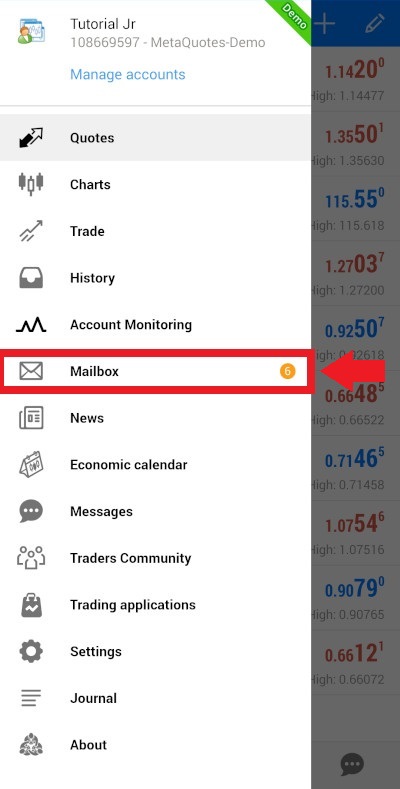
The Mailbox screen shows you the list of all the emails you have received from the platform. There is a chance that your broker will send you mail through the platform too, though it is most likely that for any important information your broker will contact you directly through phone or email.
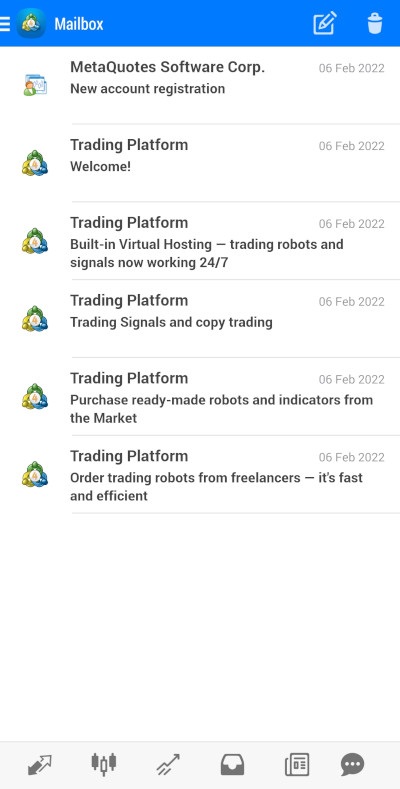
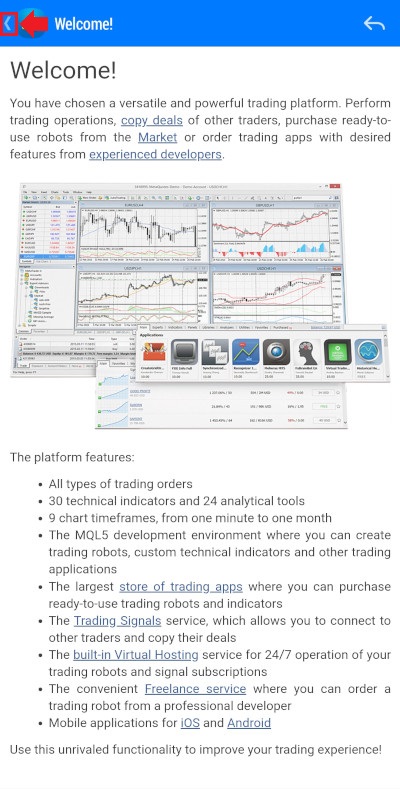
Initially, all the messages in the list are in Bold font, indicating that you have not read them. Tap on the message you want to read to open it. After reading the message tap the Back button.
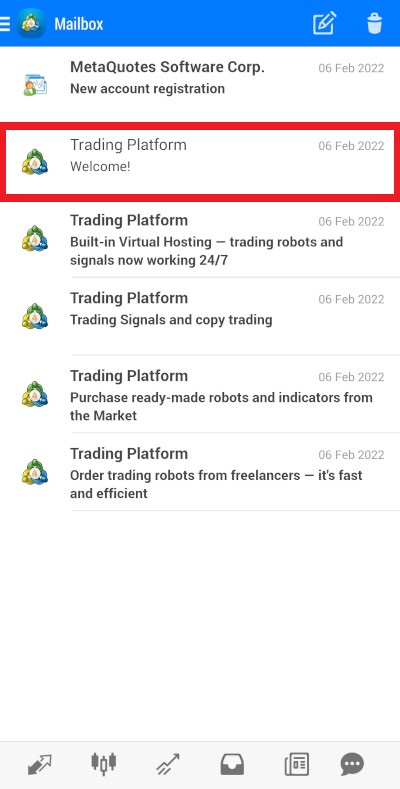
The messages you have already read will now be displayed in normal font.
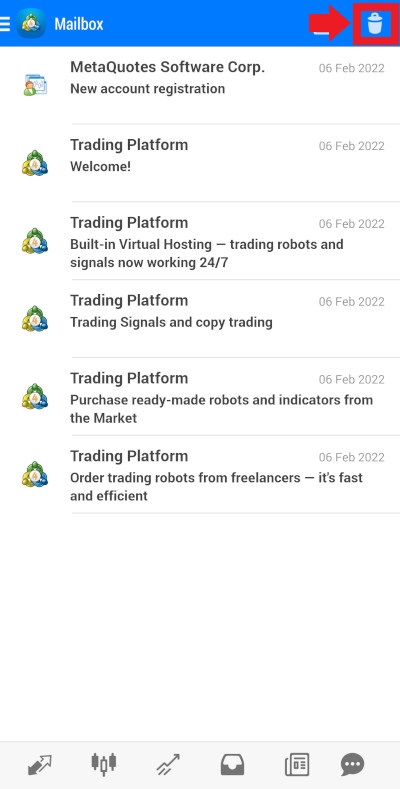
To delete unwanted messages, tap on the Delete button in the Instruments panel.
The Delete screen works similarly to the Delete screens described previously. Tap on the empty box opposite the message you want to delete. The checkmark will appear in the box to indicate that the message is selected for deletion. You can select several messages or tap on the box with the checkmark to deselect the message. You can tap the Select all button in the Instruments panel to select all the messages.
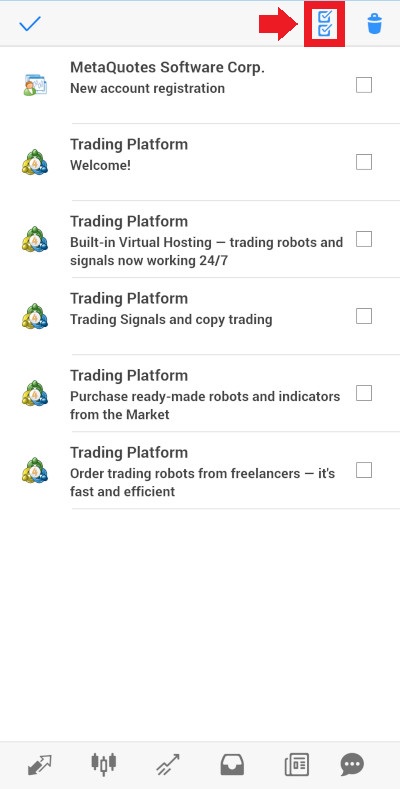
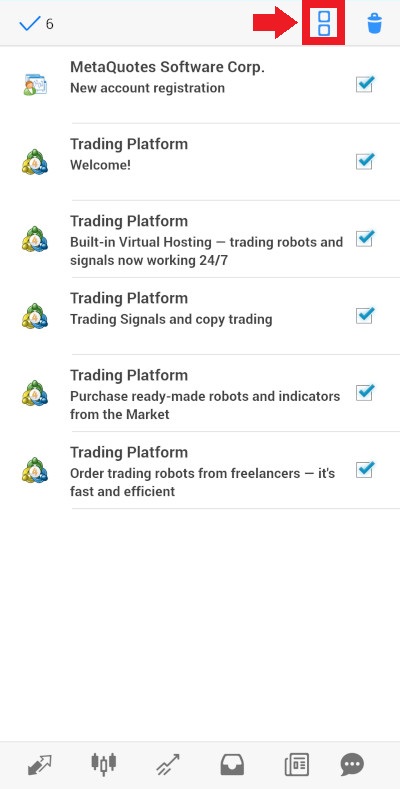
The Select all will change its appearance if you tap it to select all the messages. Tapping it again will deselect all the messages.
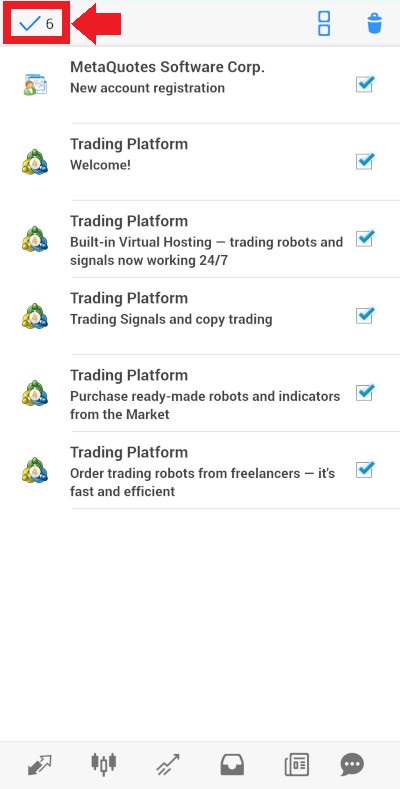
The Checkmark at the top left of the Delete screen shows the number of selected messages. You can tap on the Checkmark to exit the Delete screen without deleting messages.
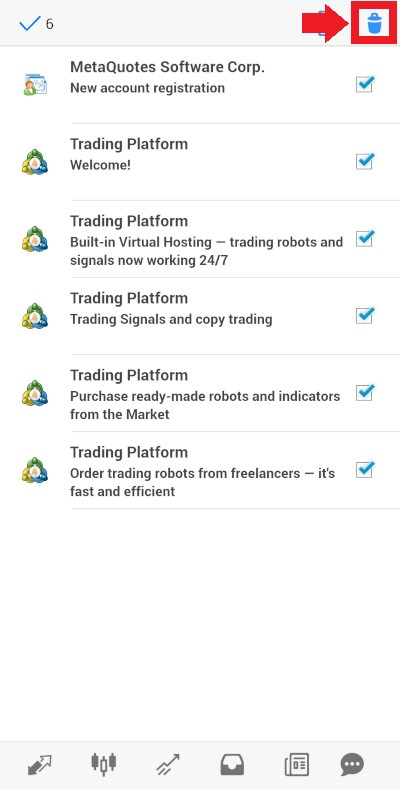
Tapping the Delete button in the Instruments panel will delete the selected messages.
You can write your own email by tapping on the pencil icon (Compose email button) in the Instruments panel.
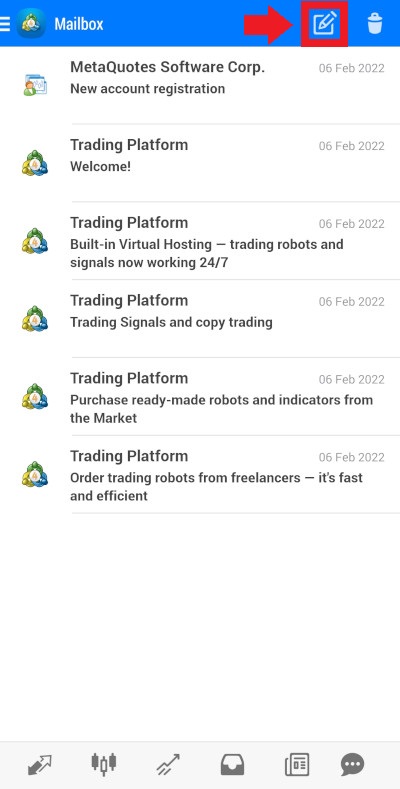
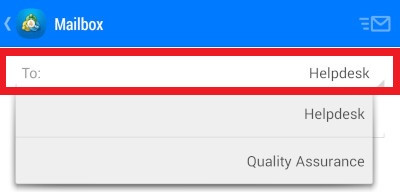
You can write a mail to the system administrator or technical support, at least if your broker permits it. Specify to whom you are sending the mail in the To field. You can choose only one recipient. On the MetaQuotes demo accounts, you have two choices: Helpdesk and Quality Assurance.
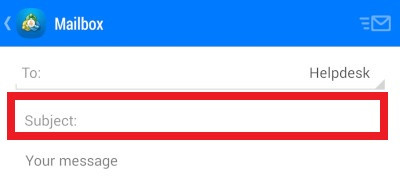
Specify the subject of your mail in the Subject field.
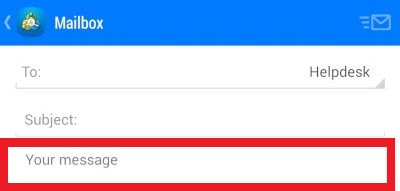
Then write the message itself in the Your message field.
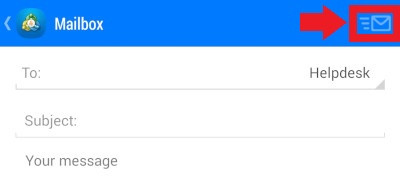
Tap the Send mail button at the top right of the screen to send the message when you have finished writing it.
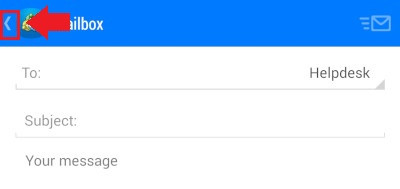
Or tap the Back button if you wish to exit the screen without sending the message.
Journal
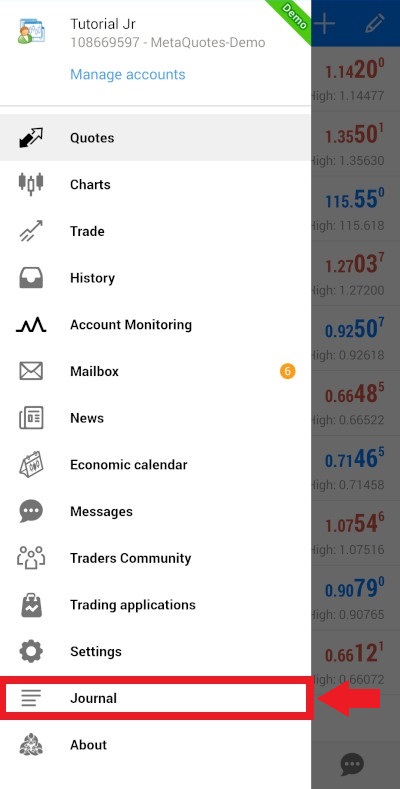
Tap on the Journal option in the Main Menu to get to the Journal screen.
The Journal screen shows all the events that happened with your MetaTrader 4 platform. It is important to remember that the Journal screen shows only technical events with your platform and does not show your trades. To see active trades, go to the Trade screen. To see closed trades, go to the History screen.
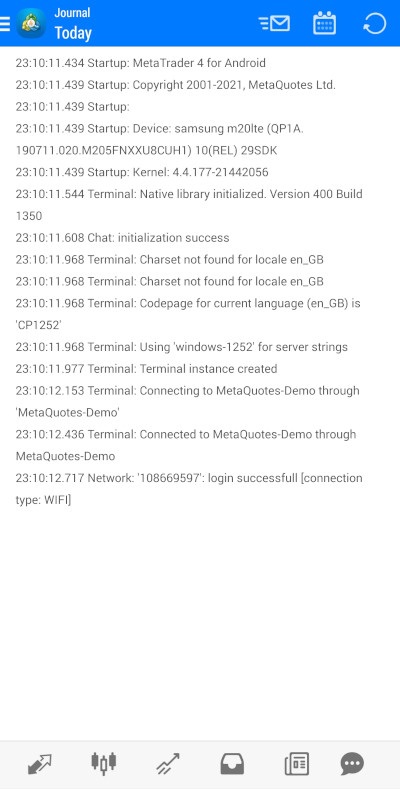
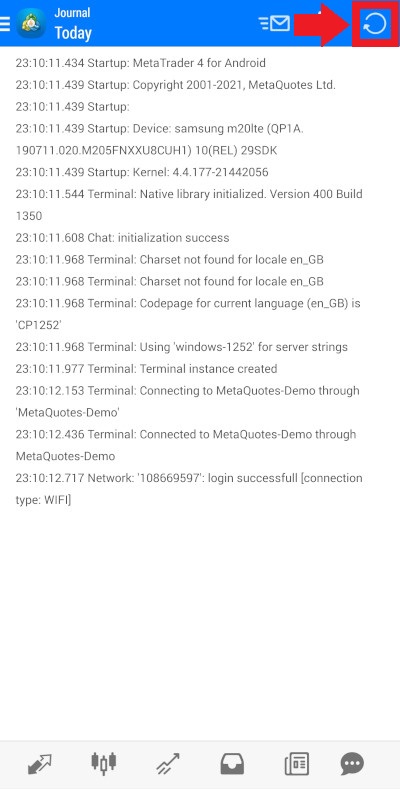
The Refresh button in the Instruments panel allows you to refresh the events list.
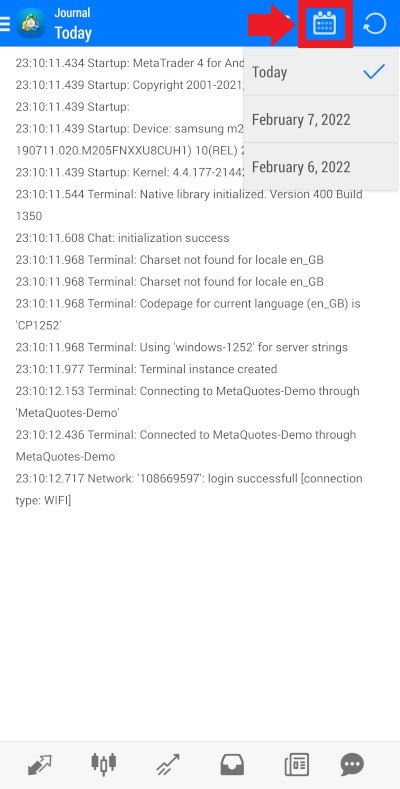
The Show list of logs button opens the list of all available logs. Each trading day has a separate log.
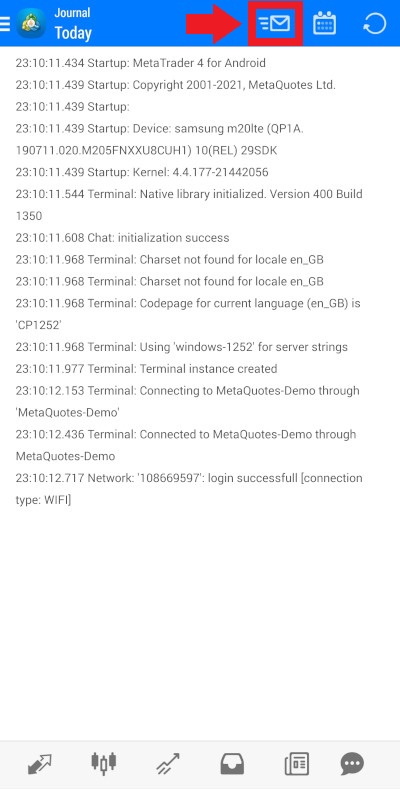
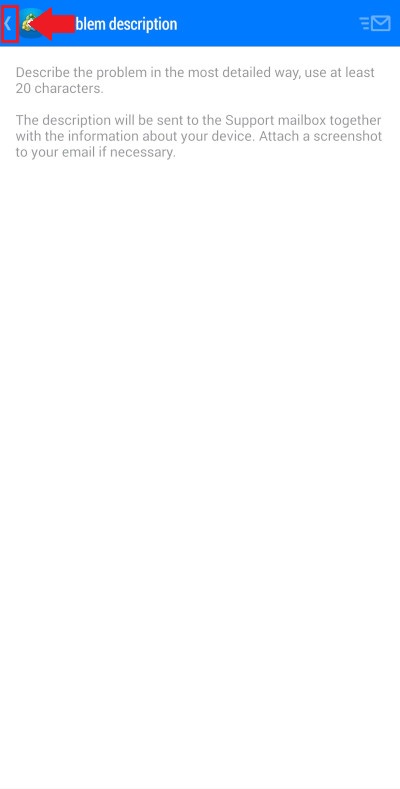
If you have some technical problems with the MetaTrader 4 platform, you can use the Send log button to report the problem to technical support. Choose the log for the day when the problem occurred and tap the Send log button.
You will then be prompted to describe the problem. When you have finished writing the report about the problem, tap Done at the top right of the screen to send the log and the report.
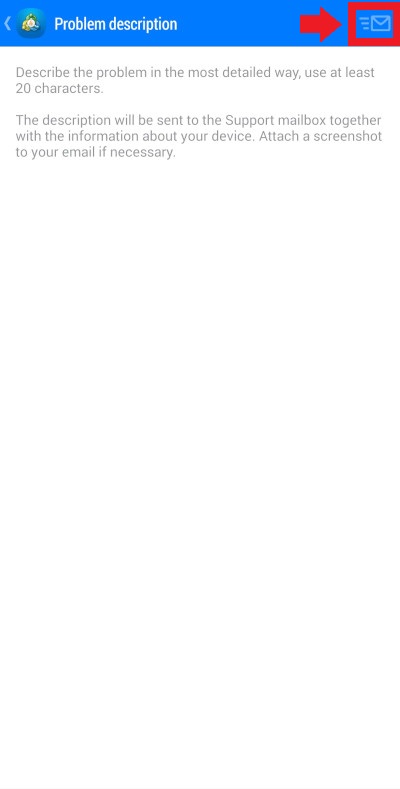
Or tap Back at the top left to exit without sending the report.
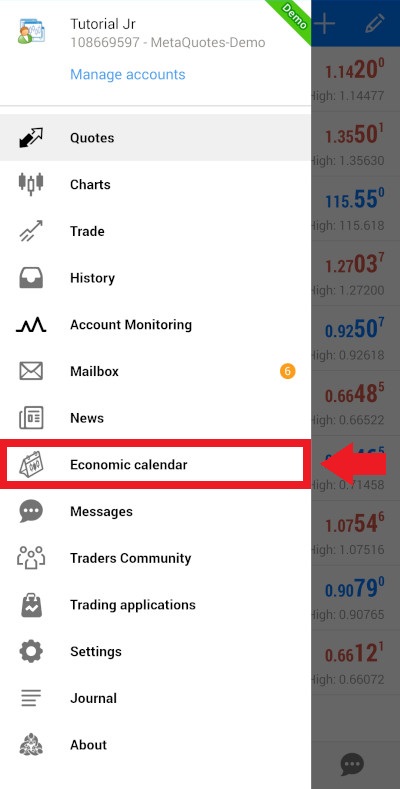
Economic calendar
The Economic calendar option in the Main Menu lets you use the Tradays app to view the economic calendar.
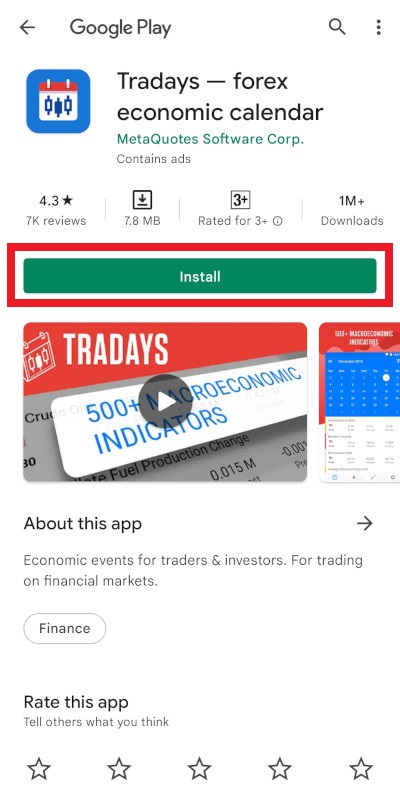
If you do not have the Tradays app, tapping the option in the Main Menu will send you to the app page in Google Play. Tap Install if you to install the app.
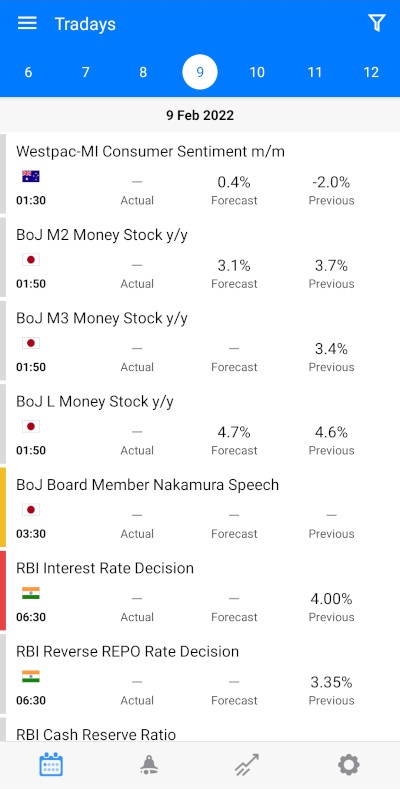
Tapping the Economic calendar option in the Main Menu of the MetaTrader 4 app while you have the Tradays app installed opens the Tradays app.
Settings
The Settings screen can be accessed from the Main Menu and allows you to adjust the MetaTrader 4 application behavior to your liking.
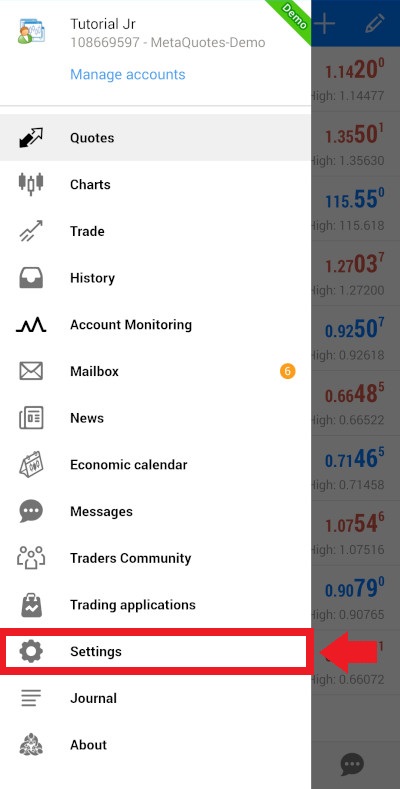
A checkmark in the checkbox means that the appropriate setting is on. An empty checkbox means it is off. Tap on the checkbox to change between the on and off modes.
Some of the settings were discussed in the previous chapters. This chapter explains the rest of them.
Quotes
This section allows you to change settings for the Quotes screen.
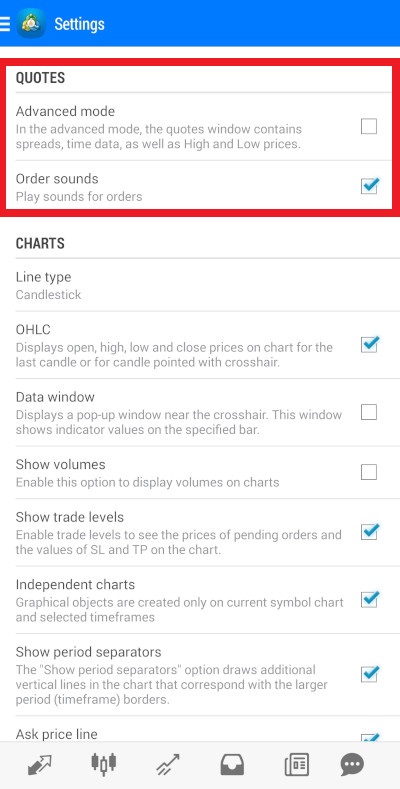
As was discussed previously, the Advanced mode setting changes between the Simple and Advanced modes of the Quotes screen. The Order sounds setting allows you to turn on or off sound alerts for changes in the status of your orders.
Charts
This section allows you to change settings for the Charts screen.
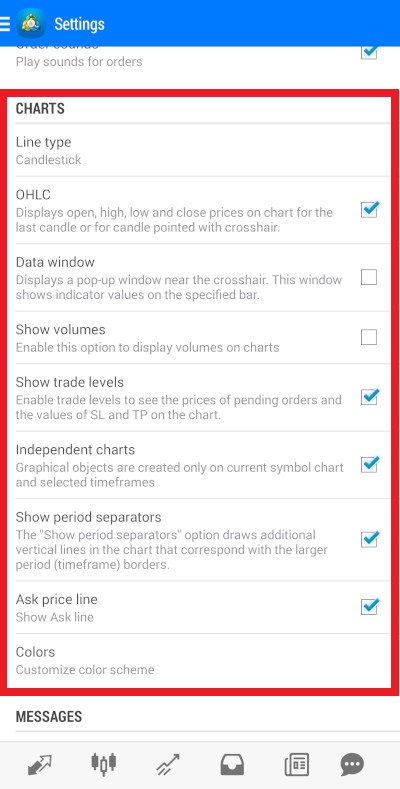
As was discussed in the Charts screen section, the Line type setting allows you to choose between different chart types.
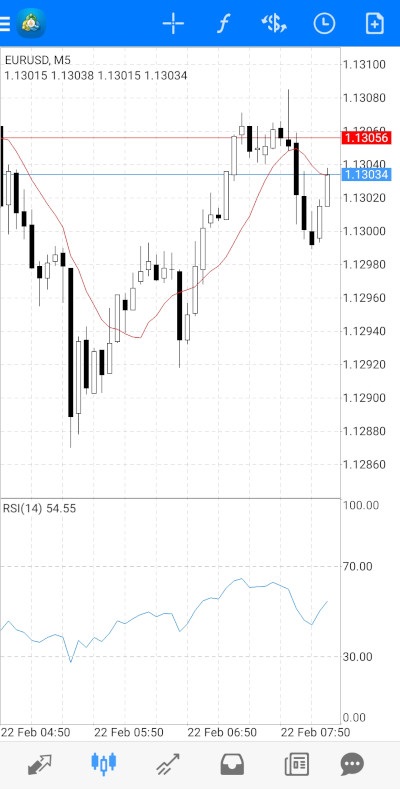
Here are examples of the available chart types:
Candlestick
Bar chart
Line chart
The OHLC setting determines whether the Charts screen shows the open, high, low, and close prices for the last candle or the candle pointed with the crosshair.
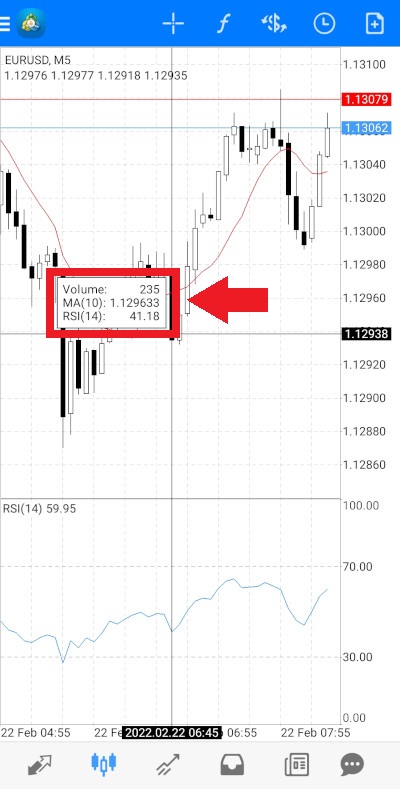
The Data window setting turns on and off a pop-up window that shows indicator values for the candle or bar pointed with the crosshair.
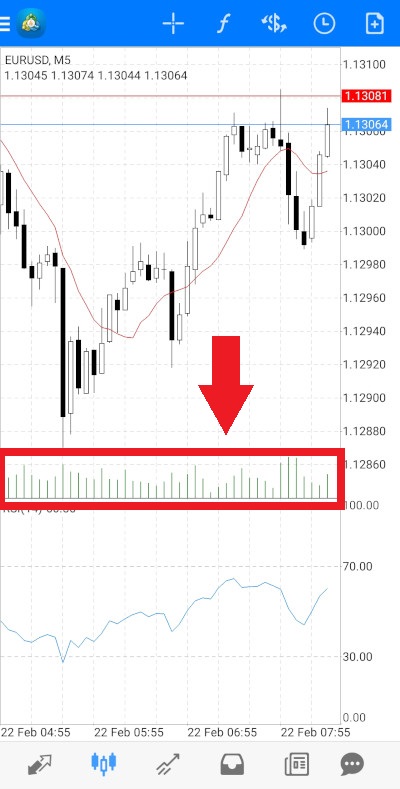
The Show volumes setting allows you to see trade volumes on the chart.
The Show trade levels setting determines whether the chart shows the prices of pending orders as well as the stop-loss and take-profit levels.
If you turn the Independent charts setting on, graphical objects will only be created on the current symbol chart and the selected timeframe. If you turn it off, the description will say that graphical objects will be created on charts of all symbols and all timeframes.
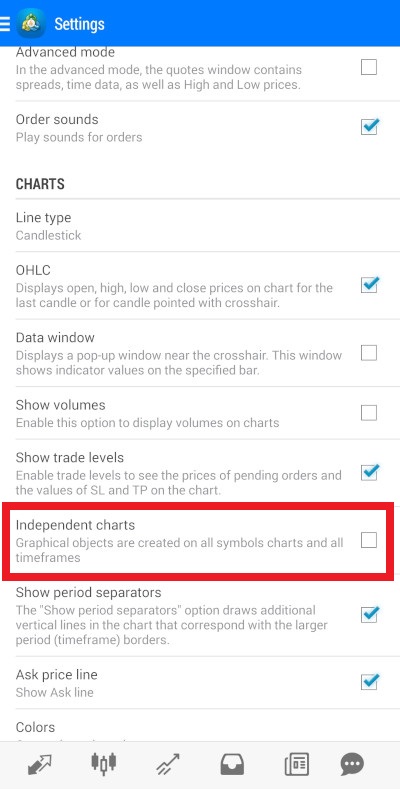
But in practice, it looks like objects will be created only on the current symbol chart even with the setting turned off, though they will be shown on all the timeframes for the selected symbol.
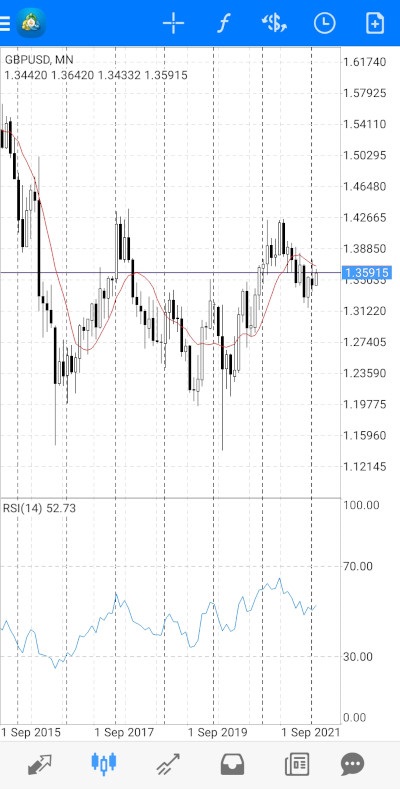
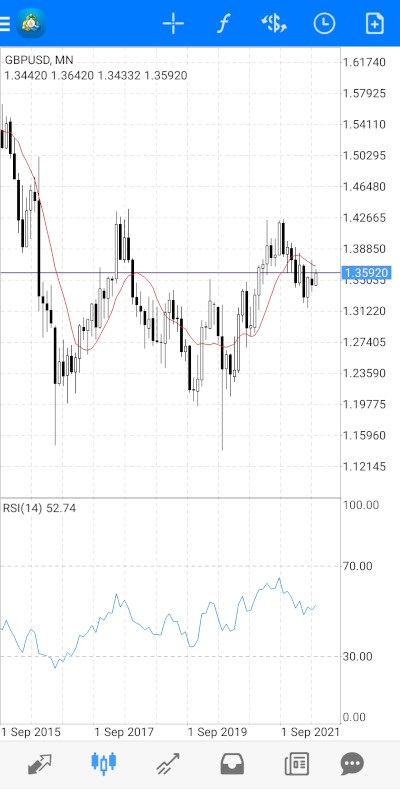
The Show period separators setting allows you to add to the chart vertical lines that show the larger timeframe borders. For the monthly and weekly timeframes, it will show years. For the daily timeframe, it will show months. And for all the timeframes below daily it will show days.
The chart with the separators.
And without them.
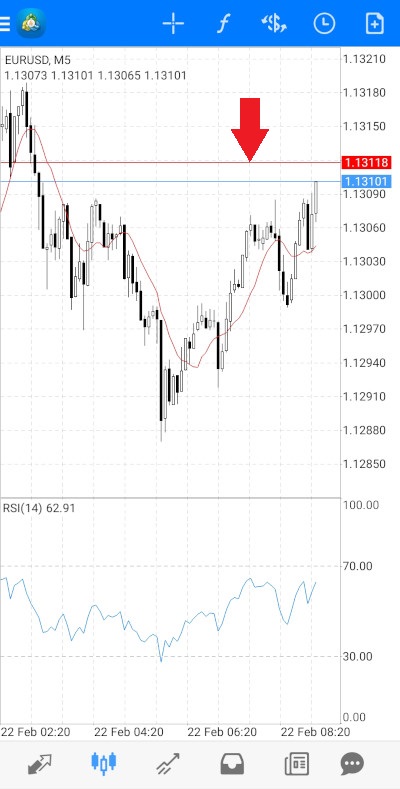
The Ask price line determines whether the chart shows the red Ask line.
Colors
The Colors setting sends you to a separate screen that allows you to modify the colors of various elements on the chart.
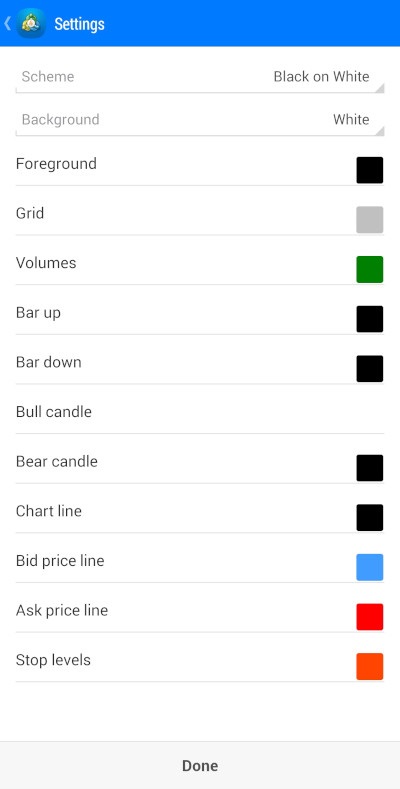
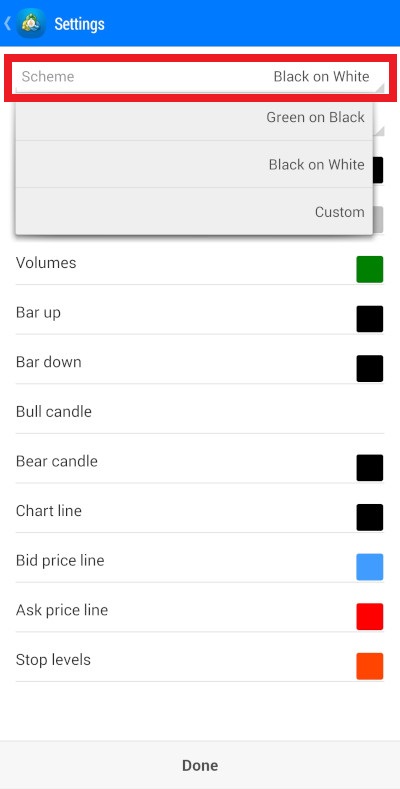
You can choose one of the predetermined color schemes from the dropdown menu in the Scheme option. You can choose Black on White (the default scheme), Green on Black (the scheme that makes the app look similar to the desktop version), or Custom (your own custom scheme).
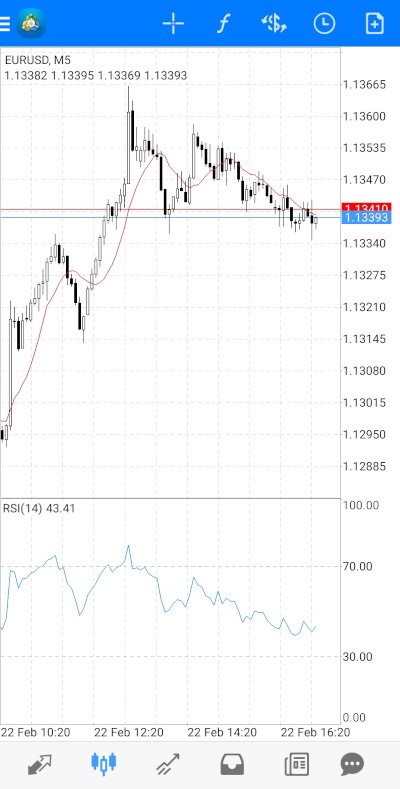
The chart with the Black on White color scheme.
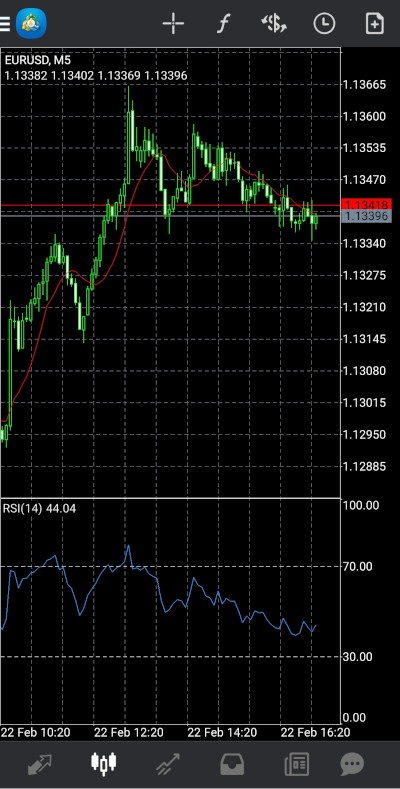
The chart with the Green on Black color scheme.
If you want to create your own custom scheme, the Background setting allows you to choose between White and Black backgrounds.
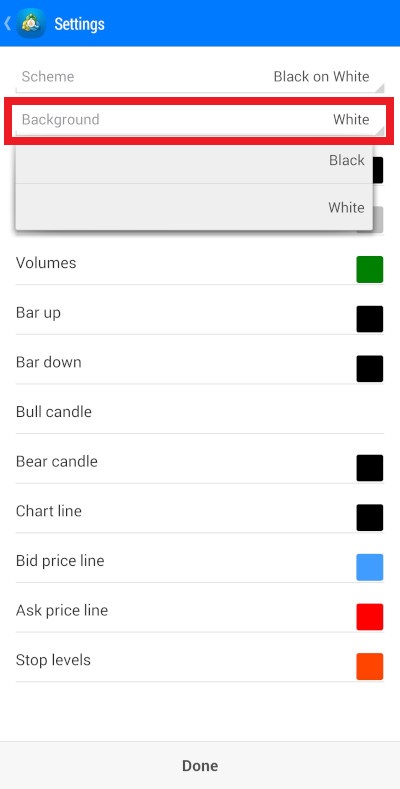
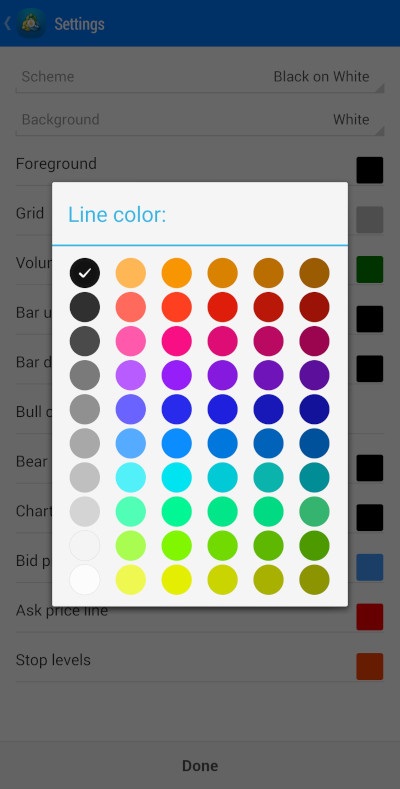
Tap on the specific element of the chart you want to choose. This will bring a color palette with a checkmark showing the currently chosen color for that element. Tap on the color you want the element to be changed to.
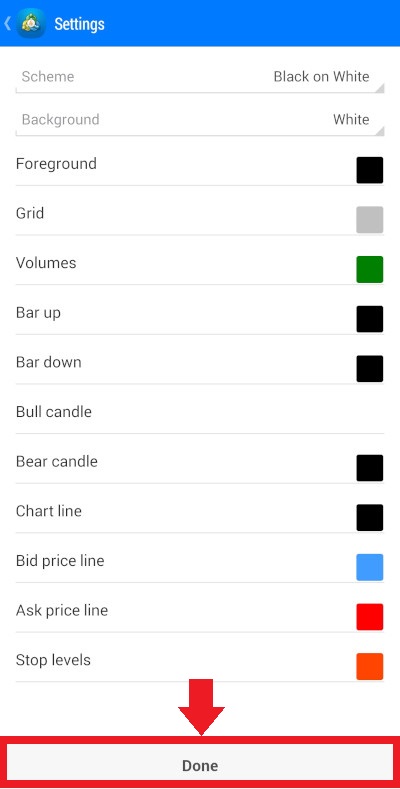
Tap Done to save the changes you have made.
Or tap Back to exit the screen without saving the changes.
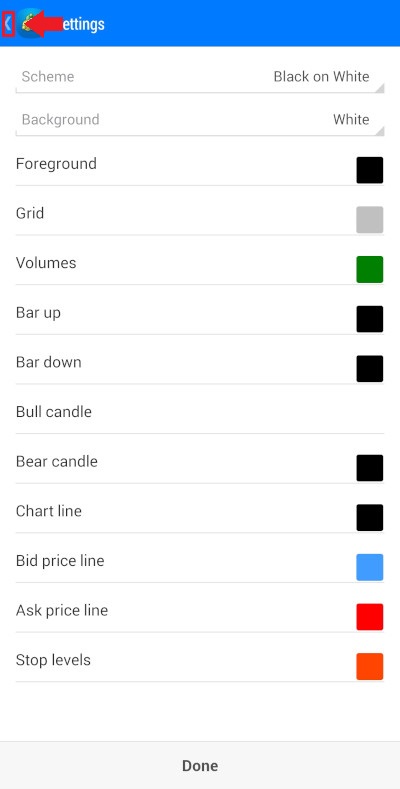
Remember that choosing one of the predetermined schemes will erase your custom scheme. Choosing the Custom scheme again will not restore your custom settings.
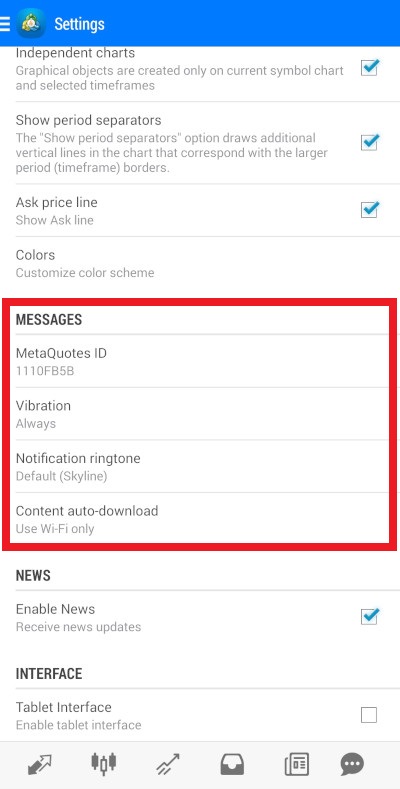
Messages
This section allows you to modify settings for notifications.
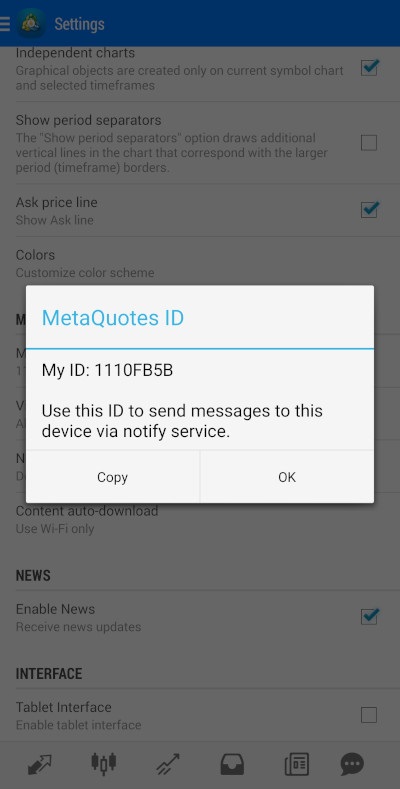
MetaQuotes ID shows the ID of the terminal on your device. It can be used to send messages to the device. Tapping on the setting brings a window with the ID, an explanation of its purpose, and two buttons. Tap Copy to copy the ID to the clipboard. Tap OK to close the window.
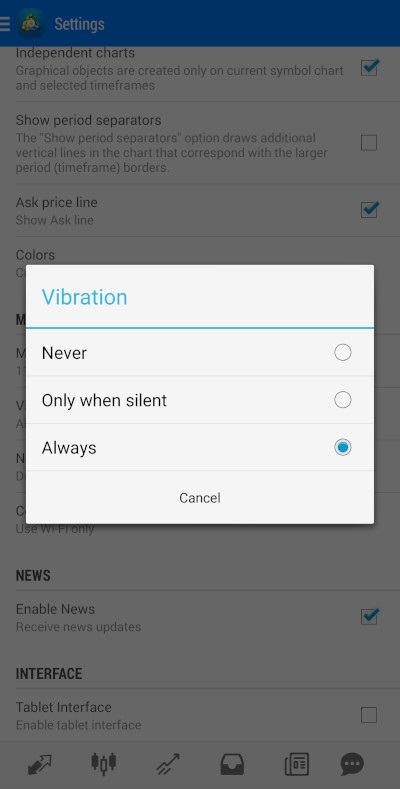
Vibration determines whether your phone vibrates when you receive a notification. The available options are: Always (the phone vibrates every time you receive a notification), Only when silent (the phone vibrates only if it is in the silent mode and will not vibrate if sounds are on), Never (the phone does not vibrate when you receive a notification).
Notification ringtone allows you to choose a ringtone for notification alerts among those installed on your phone.
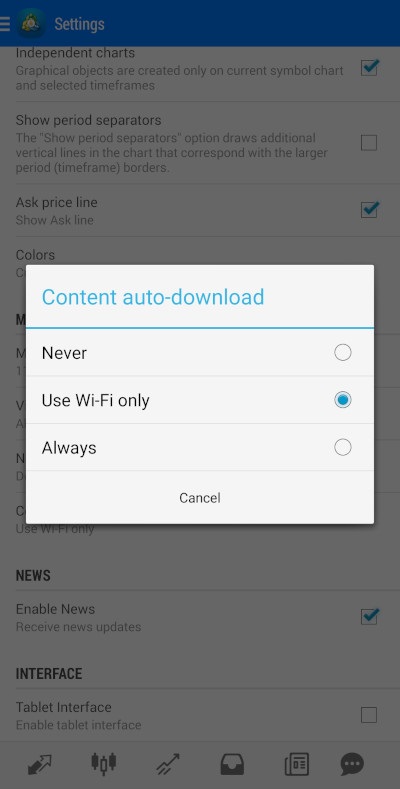
Content auto-download determines whether attachments in messages will be downloaded to your phone automatically. There following options: Always (attachments will be downloaded automatically), Use Wi-Fi only (attachments are downloaded only when you are connected to a Wi-Fi network to reduce the usage of the mobile Internet and associated fees), Never (attachments are downloaded only manually when you click on them).
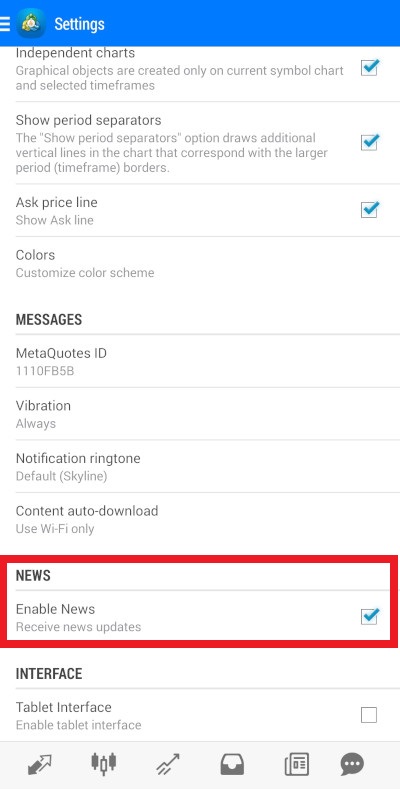
News
The Enable News setting determines whether you will be receiving news updates in the News tab.
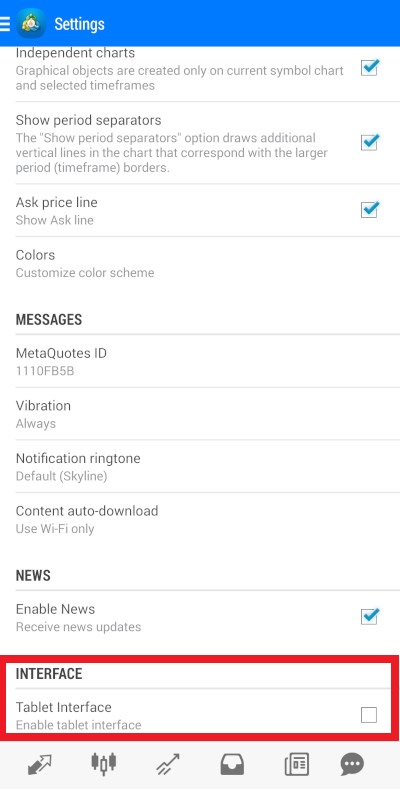
Interface
If you are using a tablet rather than a phone, turn the Tablet Interface setting on to change the interface of the MetaTrader 4 app to the one more suited for tablets.
Options that send to the MQL5 site
The few remaining options in the Main Menu will send you to the MQL5 site.
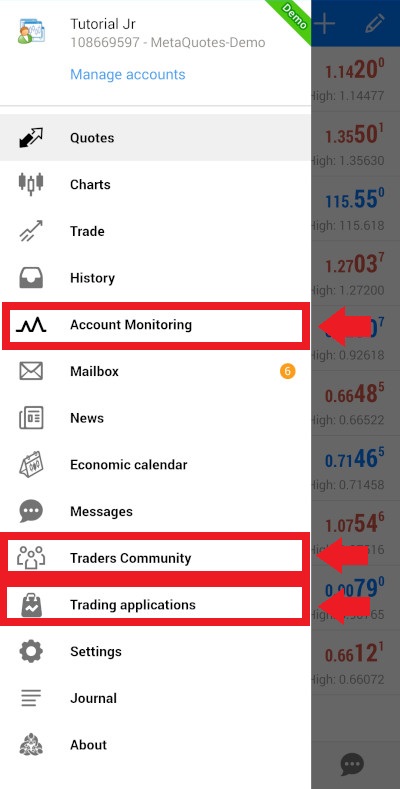
Two of them, Account Monitoring and Traders Community, send you to the registration page.
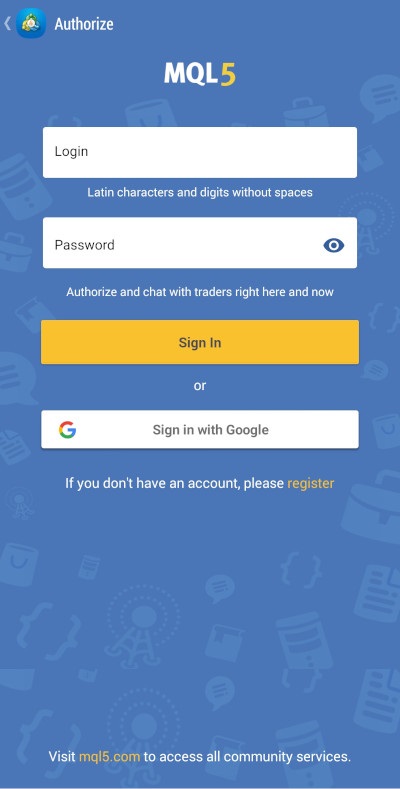
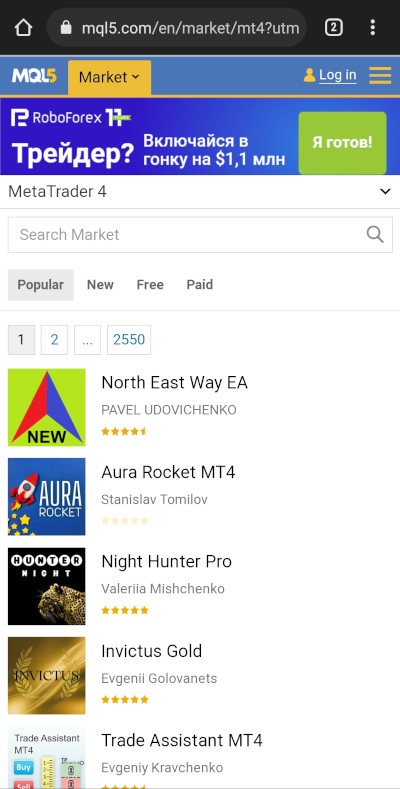
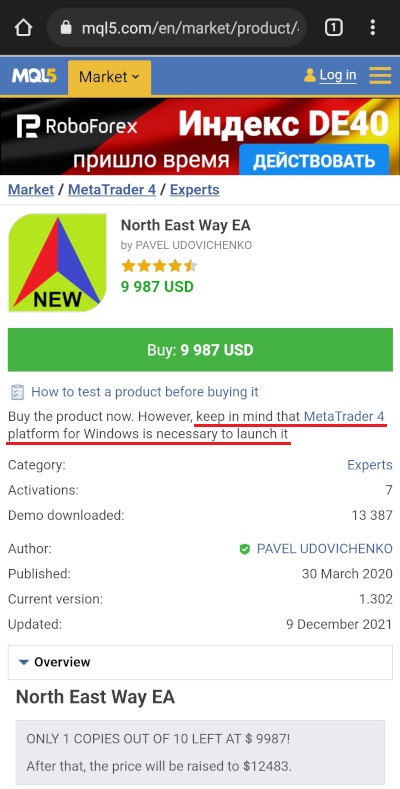
Trading applications send you to the page that allows you to download trading applications that require the MetaTrader 4 platform for Windows to work.
Differences between the desktop and mobile versions
While both the desktop and the mobile versions of the MetaTrader 4 platform share similar functionality, there are a few key differences between them that traders should consider.
The most obvious difference is the interface. The desktop interface is designed for large screens, and that makes it more convenient for studying charts. The keyboard and mouse interface is also more convenient, with different shortcuts helping to simplify and expedite common operations, though it is more down to personal preference.
The mobile app, on the other hand, has the advantage of being much more convenient for using on the go due to the portability of phones and tablets. While the desktop version also can be used on the go if you install it on a laptop, laptops are usually not as portable as tablets, let alone phones.
For professional traders, the most notable difference is probably the fact that the mobile app does not have MetaEditor, and therefore you cannot use scripts and expert advisors on it. Custom indicators are also unavailable. That can make the mobile app seriously limited for some traders, especially those who rely on algorithmic trading, as such limitation makes automated trading impossible.
Another important feature that is missing from the mobile version of the MT4 platform is trailing stop — there is no way to set up an automated trailing stop there.
Looking at discussions on the Internet, it looks like traders mostly use the mobile app for monitoring markets on the go but prefer the desktop version for making actual trades.
If you want to share your opinion, observations, conclusions, or simply to ask questions regarding the Meta Trader 4 mobile application, feel free to join a discussion on our forum.