Popular results
Position Sizer
Calculate risk-based position size directly in your MetaTrader platform and execute a trade in one click or a press of a button.What Is Forex
Learn what Forex is and how it works from this simple explanation.Supertrend
Download the Supertrend indicator for MT4 and MT5 to detect trend changes based on the price action.Position Size Calculator
Calculate your position size based on risk, stop-loss, account size, and the currencies involved. A simple online calculator for quick results.MT5 Hollow Candlesticks Chart Indicator
Table of contents
- What is hollow candlestick chart?
- What is Hollow Candlesticks MT5 indicator?
- Hollow Candlesticks indicator's input parameters
- How to configure your MT5 chart optimally to work with hollow candlesticks?
- Advantages and disadvantages of hollow candlestick charts
- Hollow Candlesticks for MetaTrader 4?
- Downloads
- Discussion
- Changelog
Hollow Candlesticks MetaTrader 5 indicator is an indicator that can plot a hollow candlesticks chart directly in the main window of your normal MT5 chart. Hollow candles is a kind of a candlestick chart that is similar to Japanese candles but has some important differences.
What is hollow candlestick chart?
While Japanese candlesticks have only two types of candles (bullish and bearish) and depend only on the Open, High, Low, and Close of the current period, hollow candlesticks come in six varieties and include the Close of the previous period in their calculations. The hollow candle charts can feature the following candlesticks:
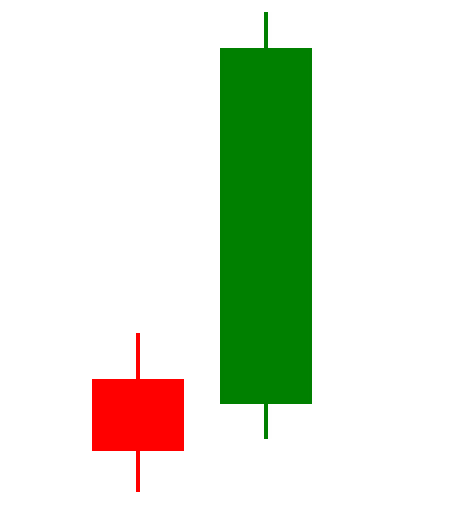
- A hollow green candle is drawn when the current Close is higher than the current Open and than the previous Close. It means that the candle is showing growth not only for the current period but also compared to the previous period's Close.
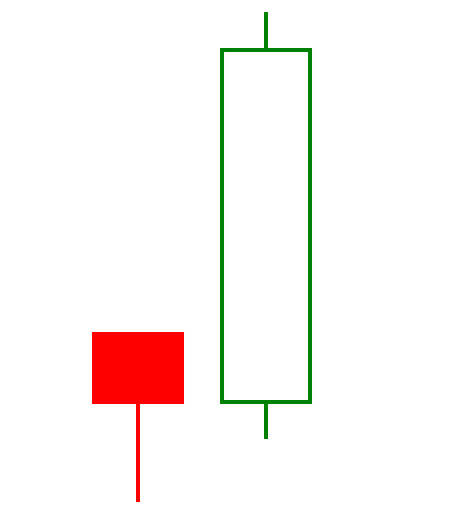
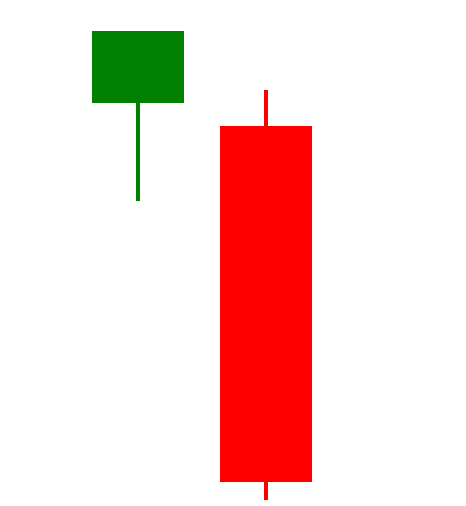
- A hollow red candle is drawn when the current Close is higher than the current Open but is lower than the previous Close. It means that the price rose during the current period but failed to close above the Close of the previous one.
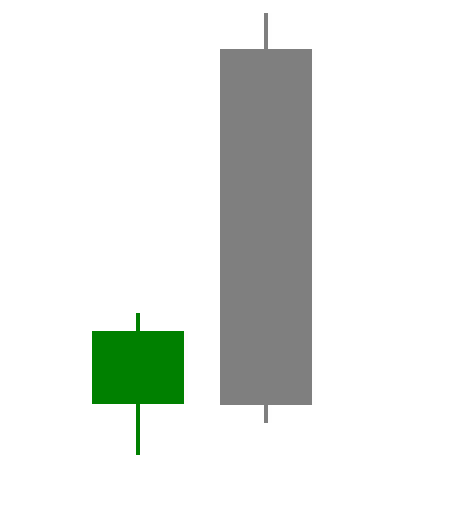
- A hollow gray candle is drawn when the current Close is higher than the current Open and is exactly the same as the previous Close. It means a positive change during the period but that the price remained unchanged compared to the previous period.
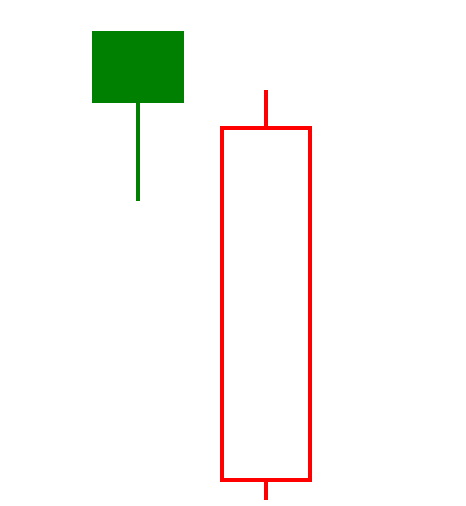
- A solid green candle is drawn when the current Close is lower than the current Open but is higher than the previous Close. It means that the candle is showing a decline for the current period but that the price actually rose compared to the previous period's Close.
- A solid red candle is drawn when the current Close is lower than the current Open and is lower than the previous Close. It means that the price fell during the current period and closed below the Close of the previous period.
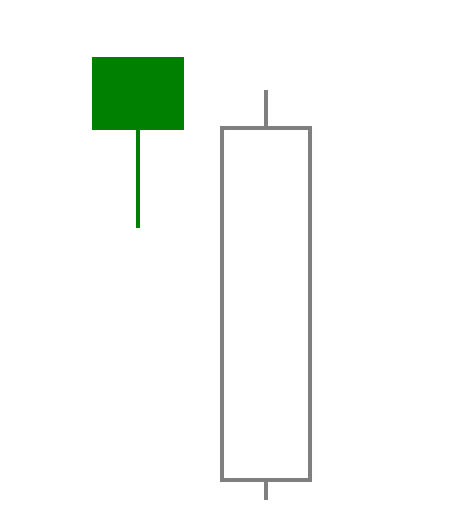
- A solid gray candle is drawn when the current Close is lower than the current Open and is exactly the same as the previous Close. It means a negative change during the period but that the price remained unchanged compared to the previous period.
A resulting chart can look like this:
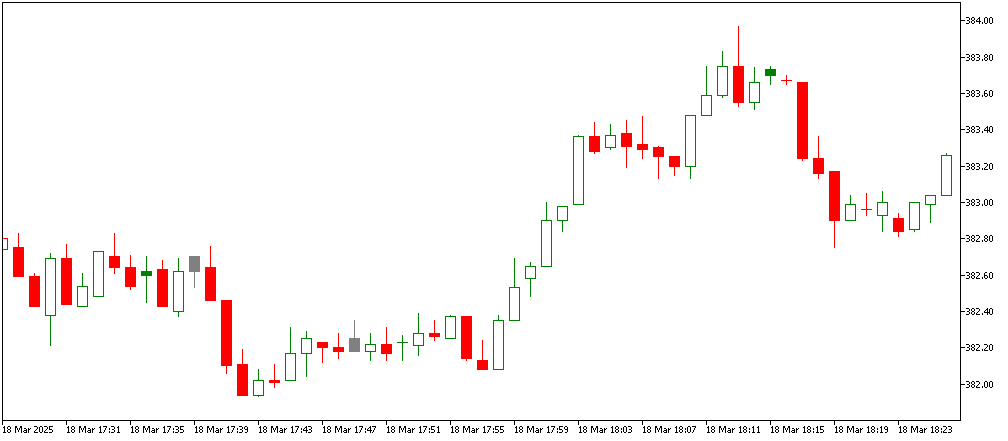
In short, there are two properties to follow on a hollow candlestick charts:
- The fill (hollow/solid) to determine whether the current period was bullish or bearish. This is normally achieved by using different colors on a normal Japanese candlestick chart.
- The color (green/red/gray) to determine whether the current period closed higher/lower/same as the previous one. This information can only be derived from a normal Japanese candlestick chart by manually comparing candles.
Overall, this means that a hollow candlestick chart is more informative at a glance than a standard Japanese candlestick chart.
What is Hollow Candlesticks MT5 indicator?
Hollow Candlesticks is a free and open-source MT5 indicator that draws the hollow candlestick chart on top of the normal MetaTrader chart of your choice. If you remove the original MetaTrader chart by setting its colors to None, then you get a clear hollow candlestick chart of the asset you are trading. This can be very useful when trading stock CFDs and futures. With currency pairs, hollow candlestick charts are less useful, but can also display some irregularities that are easily missed on traditional Japanese candlestick charts.
Hollow Candlesticks indicator's input parameters
The Hollow Candlesticks indicator for MT5 does not have any input parameters because it is a simple chart indicator. You can modify the candle colors on the Colors tab of its Properties window:
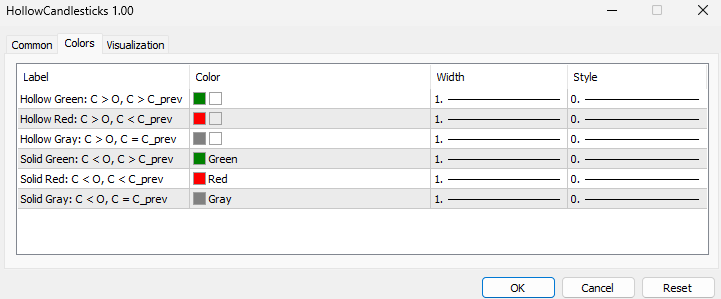
However, traditional hollow candlestick colors are green, red, and gray, and it might become quite confusing if you change these colors to something else.
How to configure your MT5 chart optimally to work with hollow candlesticks?
By default, if you just attach the Hollow Candlesticks indicator to a normal MetaTrader chart, it will display the hollow candlestick chart on top of the normal candles, which may not be optimal. It makes sense to switch the normal chart's colors to None in order to make the hollow candlesticks stand out:
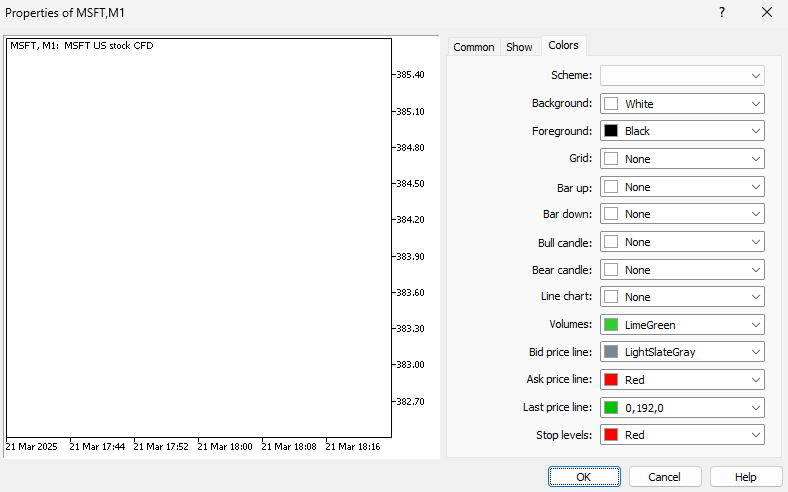
This will make the hollow candlestick chart the only plot in the window, so that you can concentrate your analysis on hollow candlesticks.
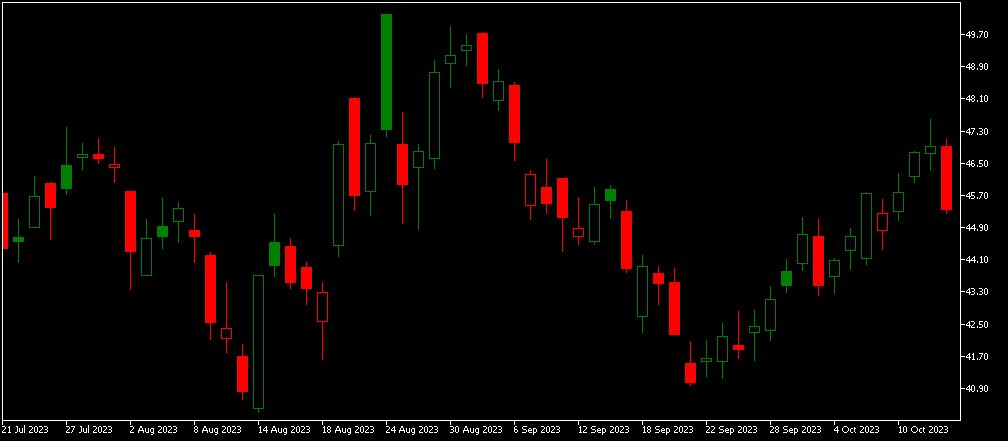
Here is an example of a properly set up hollow candlestick chart in MT5 with a dark background:
Advantages and disadvantages of hollow candlestick charts
There are some important pros and cons of hollow candlestick charts compared to traditional Japanese candlestick charts. The advantages are the following:
- More information is color-coded. If you are good at reading price information from chart colors, you will like these charts.
- At-a-glance view of the market. It just takes a few seconds to see how price fared not only inside periods but also compared to previous periods.
- Non-standard signals with advanced gap-based candlestick patterns. A lot of traders know and trade Japanese candlestick patterns. With hollow candlesticks, you can backtest and analyze even more advanced candlestick patterns.
- Perfect for stock market analysis. While Forex traders will rarely benefit from the advanced characteristics of hollow candlestick charts, equity traders may find them quite useful.
The downsides of using hollow candlestick charts are the following:
- Limited utility. When trading Forex and other markets with few gaps between previous Close and current Open, there isn't much to gain from hollow candlestick charts.
- Not available as a standard chart type in MetaTrader and some other platforms. Hence you need to use an indicator like this one to access a hollow candlestick chart.
- Confusion with Japanese candles can lead to errors. If you are not used to hollow candlesticks, you can easily confuse, for example, a solid green candle with a normal bullish candle.
- Learning curve. It takes time to get used to hollow candlestick charts.
Hollow Candlesticks for MetaTrader 4?
Is there an indicator for hollow candlestick charts in MetaTrader 4? Unfortunately, no. MT4 doesn't support candlestick drawing type for its indicators. That is why, you cannot use this Hollow Candlesticks indicator in MT4.
Download (ver. 1.00, 2025-03-24)
Hollow Candlesticks for MetaTrader 5 in .mq5 Hollow Candlesticks for MetaTrader 5 in .zipYou can use a trading account with any MT5 Forex broker to apply this indicator.
Discussion
Warning!
If you don't know how to install this indicator, please read the MetaTrader Indicators Tutorial.
Do you have any suggestions or questions regarding this indicator? You can always discuss Hollow Candlesticks with the other traders and MQL5 coders in our forums.
Changelog
1.00 - 2025-03-24
- First release of the Hollow Candlesticks indicator on EarnForex.com.