Popular results
Position Sizer
Calculate risk-based position size directly in your MetaTrader platform and execute a trade in one click or a press of a button.What Is Forex
Learn what Forex is and how it works from this simple explanation.Supertrend
Download the Supertrend indicator for MT4 and MT5 to detect trend changes based on the price action.Position Size Calculator
Calculate your position size based on risk, stop-loss, account size, and the currencies involved. A simple online calculator for quick results.Negative Volume Index indicator for MT4, MT5, cTrader
Negative Volume Index (NVI) is a free technical indicator for advanced chart analysis in MT4, MT5, and cTrader platforms. It is based on tick volume (can be substituted with real volume in MT5) and has two useful features added:
- Support for multi-timeframe (MTF) operation.
- Can be switched to show Positive Volume Index.
The Negative Volume Index is shown in a separate chart window below the main chart and doesn't use any standard or custom indicators in its code. This implementation of NVI is available for the MT4, MT5, and cTrader trading platforms.
What is Negative Volume Index (NVI) indicator?
Negative Volume Index (NVI) indicator is a rather old technical indicator that was developed by Paul L. Dysart in the first half of the 20th century and improved by Norman G. Fosback in 1976. It is composed of one oscillating line in the separate indicator window. The line rises or declines only for bars where volume is less than the preceding bar's volume.
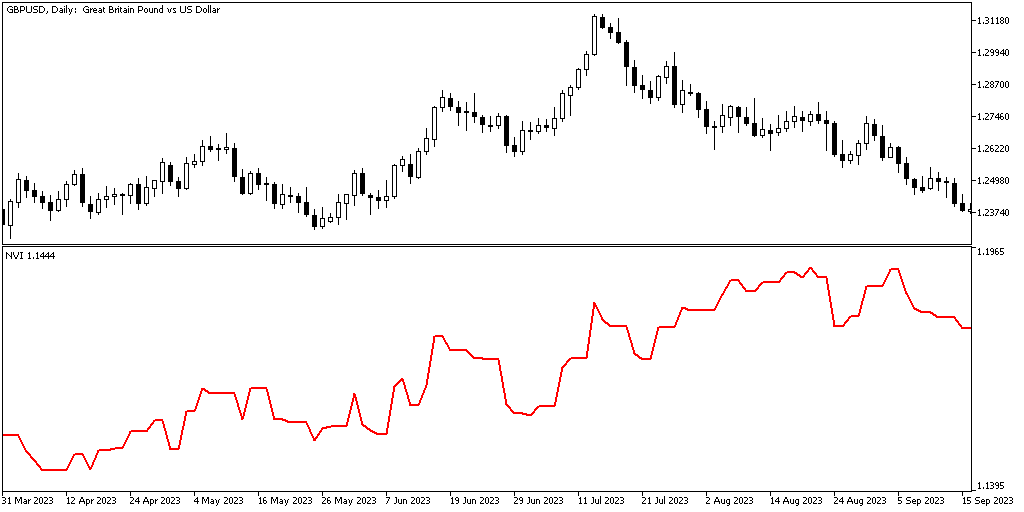
Clearly, the indicator's curve is quite different from that of the currency pair's rate chart.
How Negative Volume Index (NVI) indicator works
Negative Volume Index indicator is constructed using the following formula:


The starting value for NVI is usually set to 1 or 100. The choice of the starting value doesn't matter much as there is no hard minimum or maximum for the indicator values and it isn't normalized.
Alternatively, a Positive Volume Index (PVI) can be calculated using the nearly identical formulas:


How to use Negative Volume Index (NVI) indicator?
Classic NVI strategy
The classic interpretation of Negative Volume Index is that the trend's confirmation by a subsequent movement of the NVI signals the trend's strength. The idea is that a strong trend will continue even on falling volumes. A cross with its moving average can be considered as a trend confirmation.
As with other MA crossover strategies, this one is susceptible to produce false or lagging signals.
NVI divergence strategy
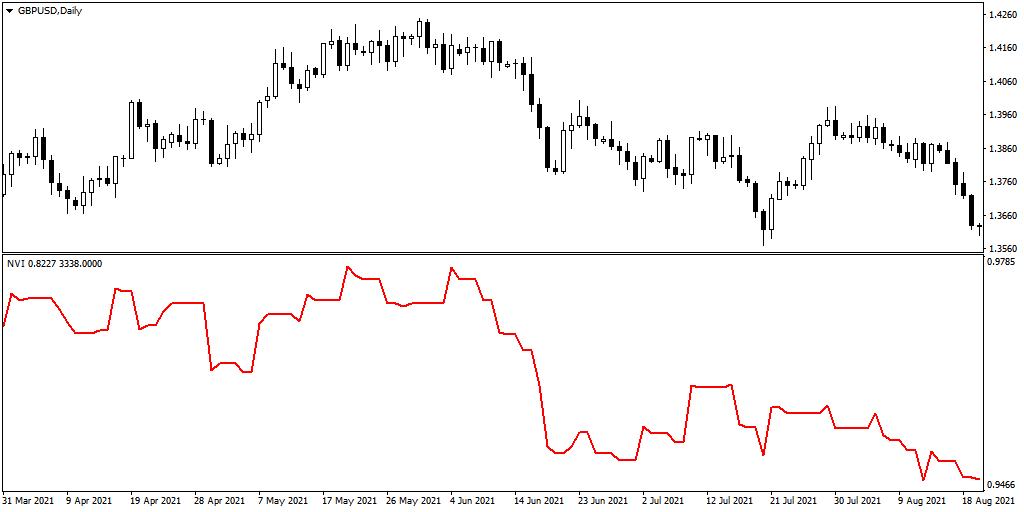
Another option is to look at the divergence between the price and its Negative Volume Index to spot trend reversal. Here, the price chart is making new higher highs while the NVI is demonstrating a lower low. A long-term downtrend ensues:
Unfortunately, such signals aren't always clear or accurate. As with other divergence indicators, it makes sense to use additional confirmations before entering or exiting a trade.
Higher timeframe perspective
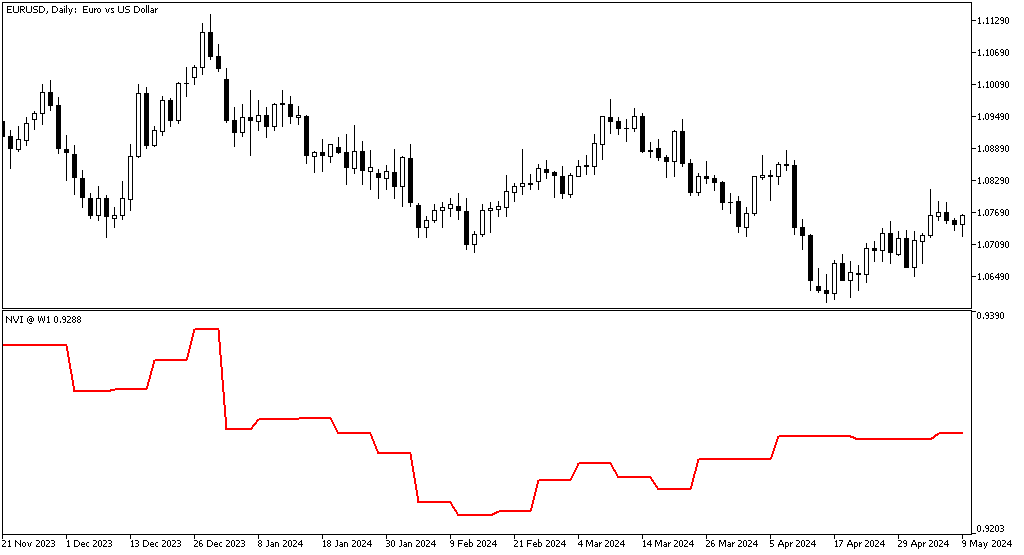
With our version of the Negative Volume Index, it is possible to set it to display higher timeframe NVI values on a lower timeframe chart. This is the same EUR/USD @ D1 chart as above but this time it has a Negative Volume Index indicator from the weekly timeframe attached:
Considering that the volume on higher timeframe bars can significantly vary from that on the lower timeframe bars, the resulting NVI curve might offer a different picture of the market situation.
Positive Volume Index (PVI)
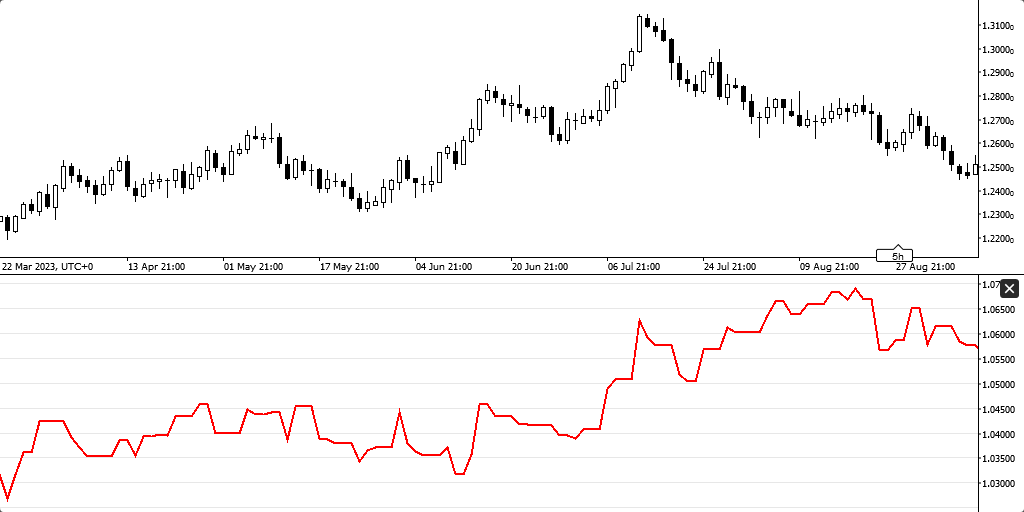
The Negative Volume Index indicator can be switched to calculate and display Positive Volume Index instead. This lets traders see the price changes accompanied by a rising volume. The resulting curve isn't much different from the price chart:
Consequently, PVI is considered less informative than NVI.
NVI input parameters
- Indicator shift (default = 0) — the horizontal shift in bars for indicator curve. Can be positive (to shift right) or negative (to shift left).
- Timeframe (default = Current) — the timeframe to calculate the NVI line on. If you set it to a timeframe that is higher than the current one, the indicator will display a higher timeframe NVI on the current chart. The parameter is ignored if set to a timeframe that is lower than the current one.
- Positive Volume Index? (default = false) — if true, the indicator will use calculate the Positive Volume Index (PVI) instead of the Negative Volume Index (NVI).
- VolumeType (default = VOLUME_TICK) — the type of volume to use in calculations — tick volume or real volume. This parameter is available only in MT5.
Download (ver. 1.00, 2024-05-09)
Negative Volume Index for MetaTrader 4 — free download
Negative Volume Index for MetaTrader 4
Negative Volume Index for MetaTrader 5 — free download
Negative Volume Index for MetaTrader 5
Negative Volume Index for cTrader — free download
Negative Volume Index for cTrader in .cs
Negative Volume Index for cTrader in .zip
You can open a trading account with any of the MT4 Forex brokers to freely use the presented here indicator for MetaTrader 4. If you want to use an MT5 version of the indicator presented here, you would need to open an account with a broker that offers MetaTrader 5. If you are with a cTrader broker, then you would need to download the cTrader version of the indicator above.
Discussion
Warning!
You can read how to install this indicator in our MetaTrader Indicators Tutorial or cTrader Indicators Tutorial.
Do you have any suggestions or questions regarding this indicator? You can always discuss Negative Volume Index with other traders and coders on the indicators forums.
Changelog
1.00 - 2024-05-09
- First release of Negative Volume Index on EarnForex.com.


