Popular results
Position Sizer
Calculate risk-based position size directly in your MetaTrader platform and execute a trade in one click or a press of a button.What Is Forex
Learn what Forex is and how it works from this simple explanation.Supertrend
Download the Supertrend indicator for MT4 and MT5 to detect trend changes based on the price action.Position Size Calculator
Calculate your position size based on risk, stop-loss, account size, and the currencies involved. A simple online calculator for quick results.Draw Grid Indicator for MetaTrader
The Draw Grid indicator is a simple tool that will help you to draw a grid on your MT4 or MT5 chart.
Although grid systems are quite popular, neither MetaTrader 4 nor MetaTrader 5 offer a built-in tool to create a grid with set intervals, but you can download one here.
Grid systems
As a trader, you have probably read about grid systems. They are quite popular in the Forex market. Here we won't go too much into details, but a short introduction is due.
Grid systems usually involve drawing a grid of horizontal lines representing buy and sell levels.
All the levels are placed at the same pip distance from each other while money management plays a key role in managing the risk.
Grid systems are also commonly used together with round numbers, usually the multiples of 50 or 100 pips.
What is Draw Grid indicator for MetaTrader?
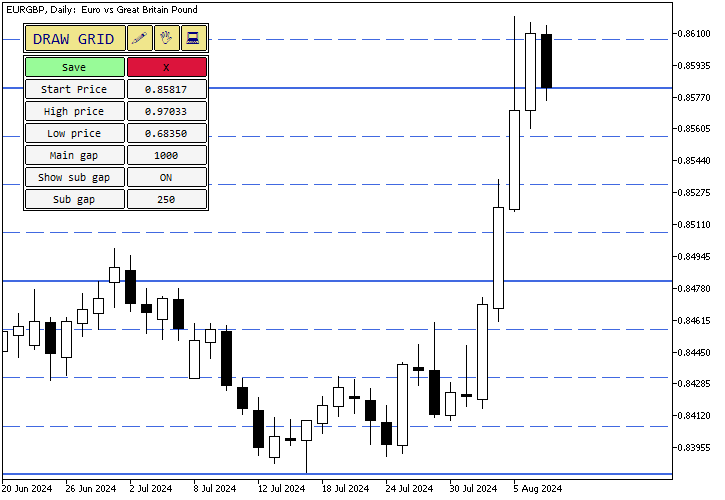
Draw Grid is a simple indicator developed for the MT4 and MT5 platforms that allows you to create a grid of horizontal lines on the chart.
The grid indicator doesn't trade by itself as it is not an expert advisor. However, it can be useful to perform chart and price analysis.
Often, once you draw a grid, you can see how levels of support and resistance are very close to the levels you set.
In other cases, you can actually find these important levels by drawing grids of different distances.
If, for example, you draw a grid using a gap (or a step) of 50-100 pips, you can see how these levels sometimes act like a magnet with the price. Usually, representing support and resistance levels. That way you can play with the distance and study the results.
Features of Draw Grid MetaTrader indicator
Draw Grid is a very simple indicator with just a few parameters. With this indicator you can:
- Draw a grid of horizontal lines.
- Change the grid range by setting the starting price, maximum price, and minimum price.
- Configure the main gap, which is the distance between lines.
- Set the secondary gap, another distance for additional lines.
- Quickly remove the grid.
Draw a grid of horizontal lines
Draw Grid will automatically draw horizontal lines based on the given settings.

Set the range
You can set a starting and finishing price, so that the grid exists only in between those boundaries.
Set the main gap
You can set the distance between the lines of the primary grid. The distance is set in points. It can be set either via the indicator's input parameters or via the panel's setting controls.
Set the secondary gap
If necessary, you can also set the distance between the lines for a secondary grid. It is also set in points and can be configured both via the input parameters and via the panel.

Quickly remove the grid
You can remove the grid with just one click when you don't need it anymore.

How can grid be useful?
A customizable grid on MetaTrader charts can help in several situations — the most common are:
- Grid systems
- Round number strategies
Grid systems involve placing orders at regular price intervals. Full control over the generated grid will allow for easier placement of pending orders for grid trading.
Round numbers also involve some actions or extra analysis at price points with multiple tail zeros.
When operating with these strategies, it is useful to have a visual representation on chart of the different price levels.
The Draw Grid indicator allows you to add a grid of horizontal lines to a chart in MT4 or MT5 with just a few parameters.

Download (1.02, 2024-08-08)
MT4 Draw Grid indicator installation
You can install the MT4 version of the Draw Grid indicator by following these instructions:
- Download the indicator archive file.
- Open the MetaTrader 4 data folder (via File→Open Data Folder).
- Open the MQL4 Folder.
- Copy all the folders from the archive directly to the MQL4 folder.
- Restart MetaTrader 4 or refresh the indicators list by right-clicking the Navigator subwindow of the platform and choosing Refresh.
If you are having trouble following this installation instruction, you can read our guide to MetaTrader product installation.
MT5 Draw Grid indicator installation
To install the MT5 Draw Grid indicator please follow the instructions below:
- Download the indicator archive file.
- Open the MetaTrader 5 data folder (via File→Open Data Folder).
- Open the MQL5 Folder.
- Copy all the folders from the archive directly to the MQL5 folder.
- Restart MetaTrader 5 or refresh the indicators list by right-clicking the Navigator subwindow of the platform and choosing Refresh.
You can open a trading account with any of the MT4 Forex brokers to freely use the presented here indicator for MetaTrader 4. If you want to use an MT5 version of the indicator presented here, you would need to open an account with a broker that offers MetaTrader 5.
Discussion
Do you have any suggestions or questions regarding this indicator? You can always discuss Draw Grid with other traders and coders on our forums.
Changelog
1.02 — 2024-08-08
- Added the MT5 version of the indicator.
- Added an option to auto-update the grid start price with the current Bid value.
- Added panel scaling on hi-DPI screens.
- Added an option to draw the lines as a background.
- Optimized and rewrote the entire code.
- Fixed the chart scrolling issue when dragging the panel.