hey john..... let me reply here.....
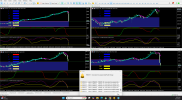
finding the trend on multiple timeframes would seem easy just by looking at the charts on each and evaluating them..... my success with that is not good.....
i tend to look for a over all balance..... the trends are meaningless if not taken with a sense of balance....
lets assume all the ma's on 240 and 1440 charts are falling..... we might feel the trend is down.... however,
there is a predictable number 60 minute counter up trends in every 1440 down trend....
there is a predictable number of 30 counter up trends in 240 and 1440 downtrend.....
you can carry that thinking down to 1 minute.....
even a 1 minute counter uptrend can hurt, even more so a 5 minute counter uptrend......
it's a rare event when all timeframe trends are the same.....
i try to time getting in when the higher timeframes agree at counter trend turning points of lower timeframes.....
i have lately been giving thought at 3 d graphing..... exporting each timeframes stochastic values into it might show how the trends on top of trends relate..... the multiple surfaces with intersection could he used..... link to it here.....
the same could be done for ma values or better still the number of bars the current trend has existed.....
but it's still a best guess......h
//-----

//----

//-----

finding the trend on multiple timeframes would seem easy just by looking at the charts on each and evaluating them..... my success with that is not good.....
i tend to look for a over all balance..... the trends are meaningless if not taken with a sense of balance....
lets assume all the ma's on 240 and 1440 charts are falling..... we might feel the trend is down.... however,
there is a predictable number 60 minute counter up trends in every 1440 down trend....
there is a predictable number of 30 counter up trends in 240 and 1440 downtrend.....
you can carry that thinking down to 1 minute.....
even a 1 minute counter uptrend can hurt, even more so a 5 minute counter uptrend......
it's a rare event when all timeframe trends are the same.....
i try to time getting in when the higher timeframes agree at counter trend turning points of lower timeframes.....
i have lately been giving thought at 3 d graphing..... exporting each timeframes stochastic values into it might show how the trends on top of trends relate..... the multiple surfaces with intersection could he used..... link to it here.....
the same could be done for ma values or better still the number of bars the current trend has existed.....
but it's still a best guess......h
//-----

//----

//-----


