USDJPY Price Action Signals Possible Bearish Continuation
The USD/JPY currency pair, often referred to as the "Ninja," represents the exchange rate between the U.S. dollar and the Japanese yen, two of the world's most traded currencies. This forex pair is heavily influenced by macroeconomic factors, including monetary policy decisions from the Federal Reserve and the Bank of Japan. Today, upcoming U.S. economic data, including JOLTS Job Openings and Factory Orders, will provide key insights into labor market strength and industrial activity, potentially impacting the dollar's direction. Additionally, FOMC members Bostic and Daly’s speeches could offer further clarity on future interest rate decisions, shaping market sentiment. Meanwhile, Japan's Monetary Base and 10-year bond auction may give traders clues about potential shifts in the Bank of Japan's stance, adding to the volatility of the USDJPY price action.

Chart Notes:
• Chart time-zone is UTC (+02:00)
• Candles’ time-frame is 4h.
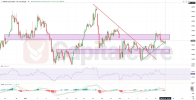
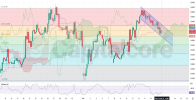
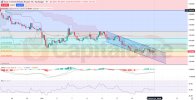
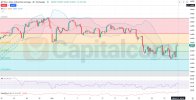
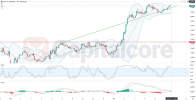
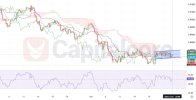
Analyzing the USD/JPY H4 chart, the price remains within a well-defined bearish channel. A recent bullish breakout attempt failed to hold above the channel’s upper boundary, and the USD-JPY’s price has now re-entered the structure, positioning itself in the upper half but still below key resistance levels. The Relative Strength Index (RSI) is struggling against a descending trendline (marked in red), indicating a lack of strong bullish momentum. Meanwhile, the MACD histogram is shifting downward, with the signal and MACD lines converging, suggesting an imminent bearish wave. Given these technical indicators, the most probable price action scenario involves continued downward movement, with the lower boundary of the bearish channel serving as the next key target.
• DISCLAIMER: Please note that the above analysis is not an investment suggestion by “Capitalcore LLC”. This post has been published only for educational purposes.
Capitalcore
The USD/JPY currency pair, often referred to as the "Ninja," represents the exchange rate between the U.S. dollar and the Japanese yen, two of the world's most traded currencies. This forex pair is heavily influenced by macroeconomic factors, including monetary policy decisions from the Federal Reserve and the Bank of Japan. Today, upcoming U.S. economic data, including JOLTS Job Openings and Factory Orders, will provide key insights into labor market strength and industrial activity, potentially impacting the dollar's direction. Additionally, FOMC members Bostic and Daly’s speeches could offer further clarity on future interest rate decisions, shaping market sentiment. Meanwhile, Japan's Monetary Base and 10-year bond auction may give traders clues about potential shifts in the Bank of Japan's stance, adding to the volatility of the USDJPY price action.

Chart Notes:
• Chart time-zone is UTC (+02:00)
• Candles’ time-frame is 4h.
Analyzing the USD/JPY H4 chart, the price remains within a well-defined bearish channel. A recent bullish breakout attempt failed to hold above the channel’s upper boundary, and the USD-JPY’s price has now re-entered the structure, positioning itself in the upper half but still below key resistance levels. The Relative Strength Index (RSI) is struggling against a descending trendline (marked in red), indicating a lack of strong bullish momentum. Meanwhile, the MACD histogram is shifting downward, with the signal and MACD lines converging, suggesting an imminent bearish wave. Given these technical indicators, the most probable price action scenario involves continued downward movement, with the lower boundary of the bearish channel serving as the next key target.
• DISCLAIMER: Please note that the above analysis is not an investment suggestion by “Capitalcore LLC”. This post has been published only for educational purposes.
Capitalcore


