Micron Technology, Inc. (MU) designs, develops, manufactures, and sells memory and storage products worldwide. The company operates through four segments: Compute and Networking Business Unit, Mobile Business Unit, Embedded Business Unit, and Storage Business Unit. It provides memory and storage technologies comprising dynamic random access memory semiconductor devices with low latency that provide high-speed data retrieval; non-volatile and re-writeable semiconductor storage devices; and non-volatile re-writable semiconductor memory devices that provide fast read speeds under the Micron and Crucial brands, as well as through private labels. Micron Technology, Inc. was founded in 1978 and is headquartered in Boise, Idaho.

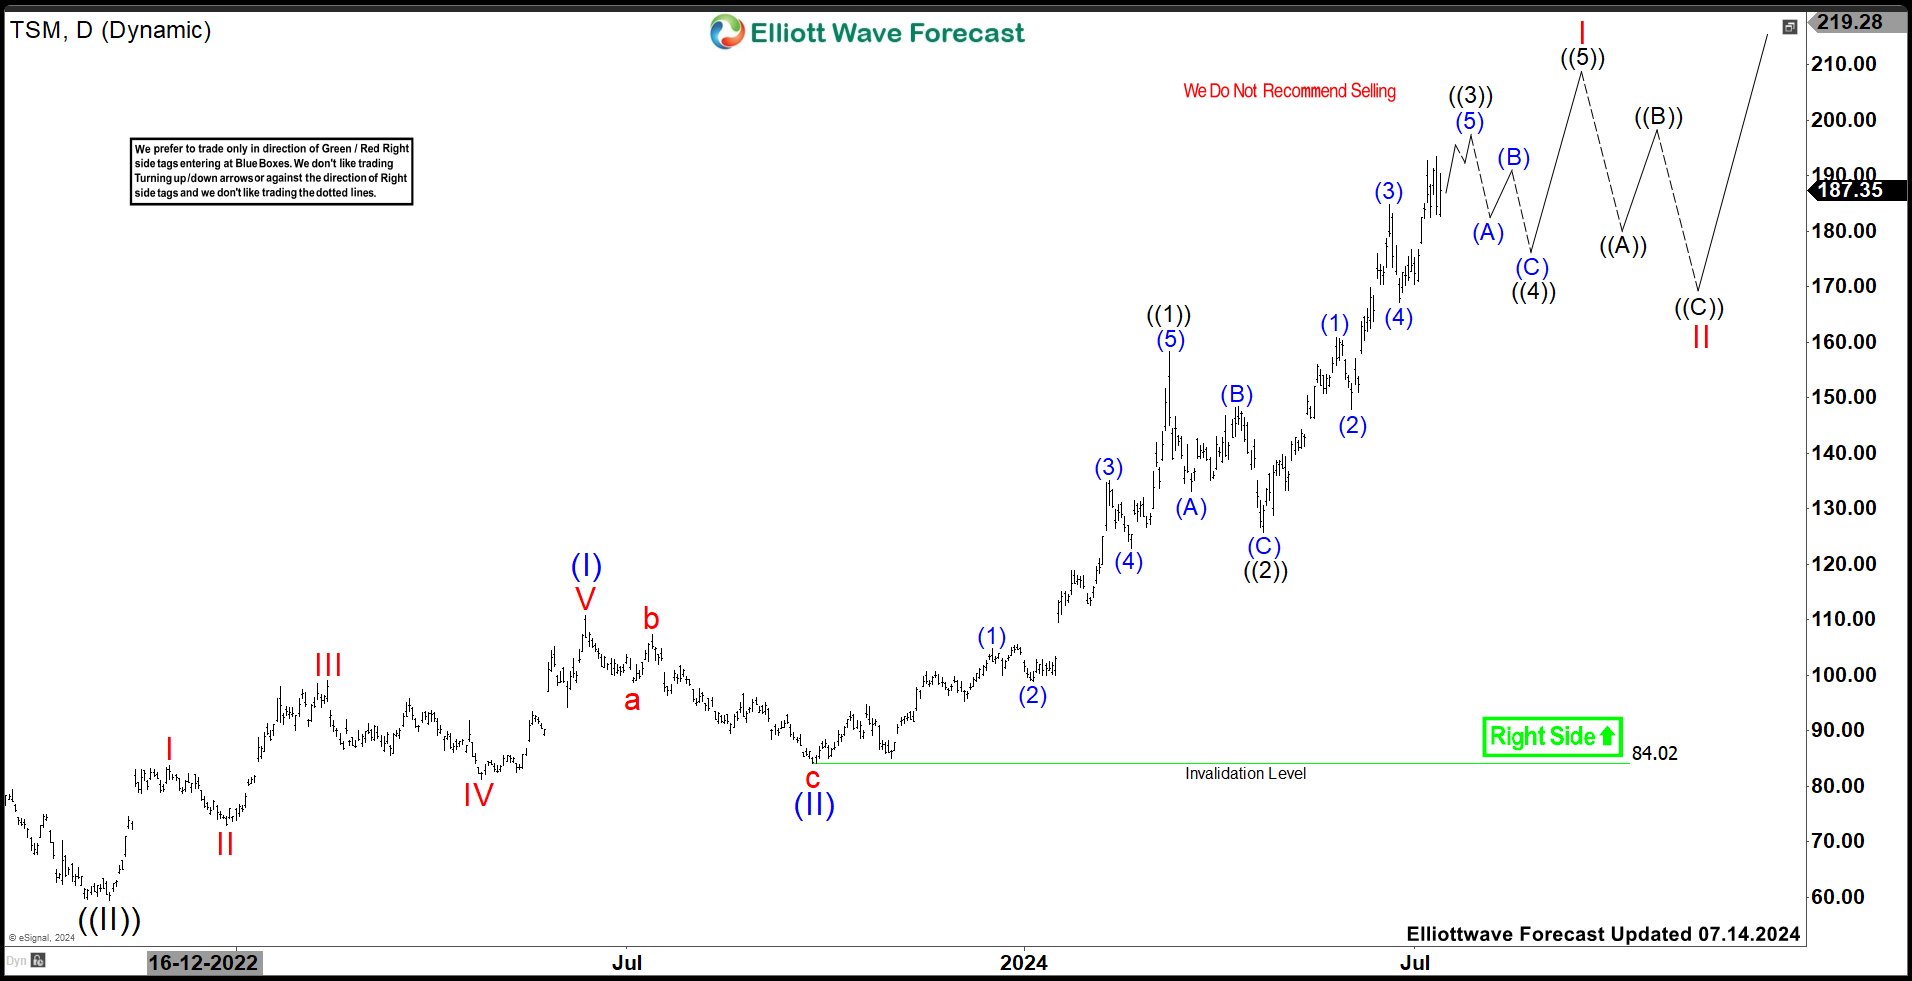
The last time we talked about MU was in March of last year. As we see in the chart above, we had ended an impulse as wave I at $96.96 high. Then, the market did an expanded flat correction (3-3-5) causing the price to drop to $48.43. We labelled this low as wave II. From here, we expected to continue the rally as long as the price does not break below 48.43.
MU Weekly Chart July 2024

Above we have the weekly chart updated. We have adjusted the labels by calling (I) and (II) where waves I and II were on the chart a year ago. As you can see, MU hit the bottom and began a new bullish cycle, breaking above $150.00. This has generated a return of more than 200% on capital. Right now, the structure shows us that we are trading in wave (III) and it has not ended yet. We hope to reach the ideal zone of $164.83 - $176.47 where we should see a market reaction. If the reaction is correct, then we would start wave (IV) before continuing the rally. However, we cannot rule out that wave (III) continues rising and not as we show. You have to pay attention to the area that we indicate.
Source: https://elliottwave-forecast.com/stock-market/micron-technology-mu-rallied-making-200/
MU Weekly Chart March 2023

The last time we talked about MU was in March of last year. As we see in the chart above, we had ended an impulse as wave I at $96.96 high. Then, the market did an expanded flat correction (3-3-5) causing the price to drop to $48.43. We labelled this low as wave II. From here, we expected to continue the rally as long as the price does not break below 48.43.
MU Weekly Chart July 2024

Above we have the weekly chart updated. We have adjusted the labels by calling (I) and (II) where waves I and II were on the chart a year ago. As you can see, MU hit the bottom and began a new bullish cycle, breaking above $150.00. This has generated a return of more than 200% on capital. Right now, the structure shows us that we are trading in wave (III) and it has not ended yet. We hope to reach the ideal zone of $164.83 - $176.47 where we should see a market reaction. If the reaction is correct, then we would start wave (IV) before continuing the rally. However, we cannot rule out that wave (III) continues rising and not as we show. You have to pay attention to the area that we indicate.
Source: https://elliottwave-forecast.com/stock-market/micron-technology-mu-rallied-making-200/
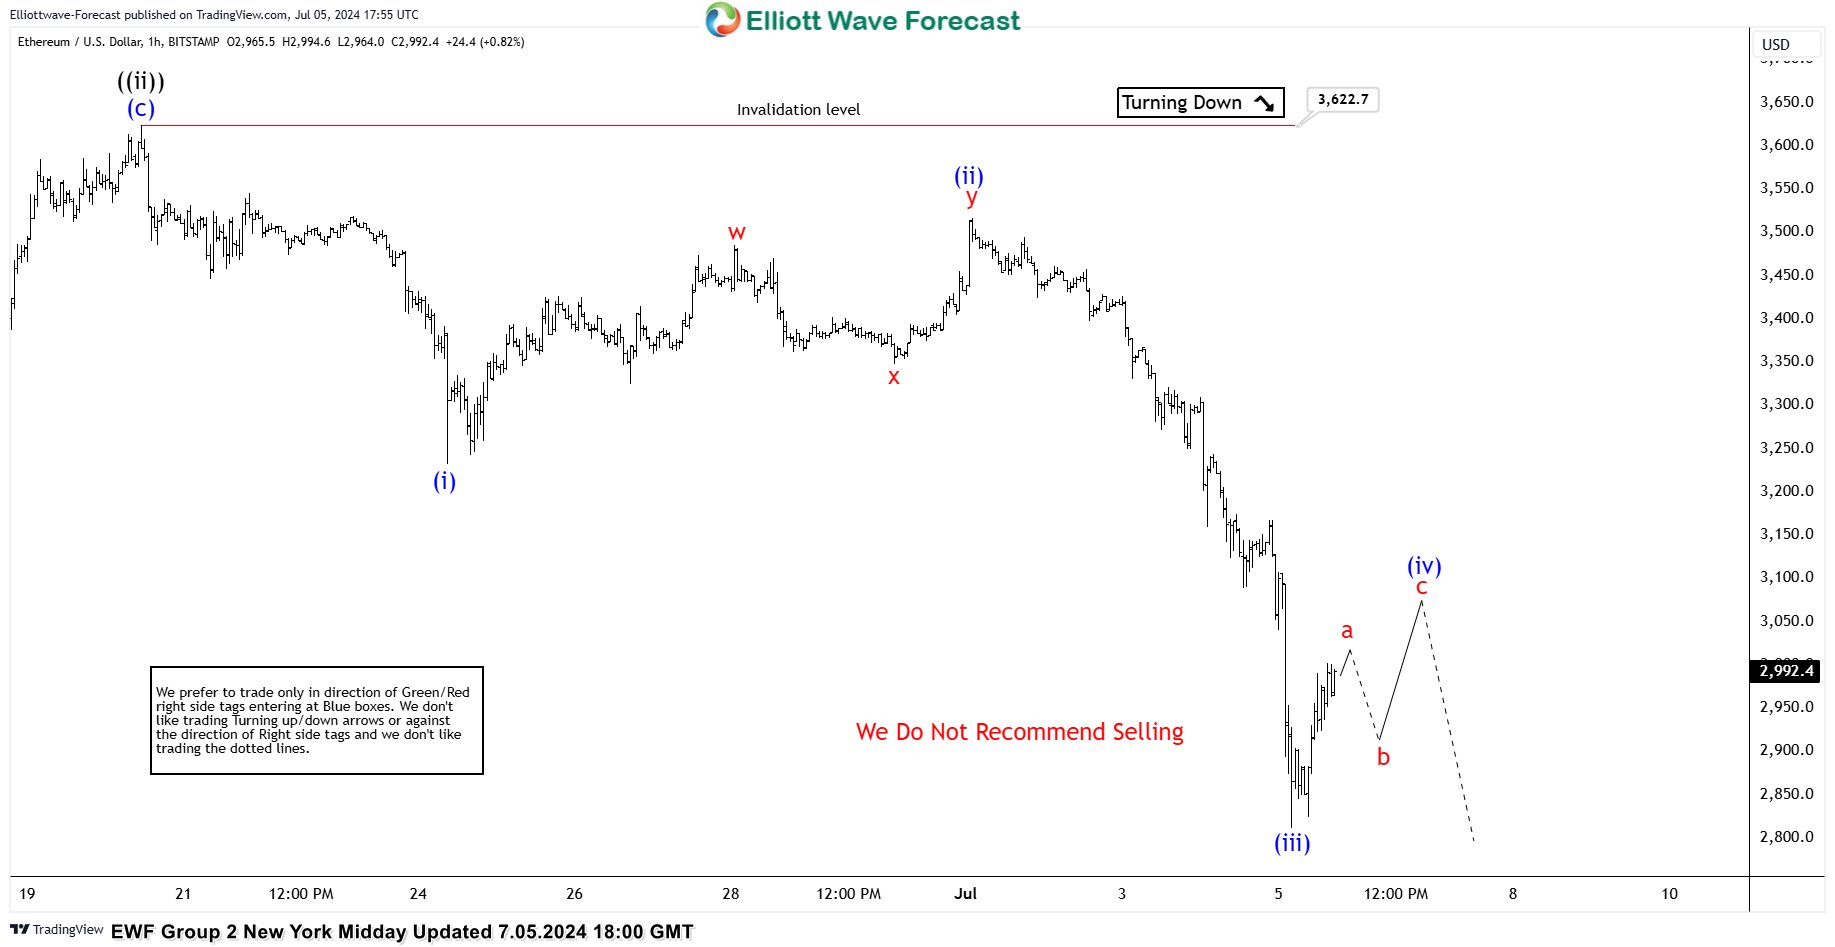
 Perfect Reaction Higher From Blue Box Area")
 Perfect Reaction Higher From Blue Box Area")


 Elliott Wave Chart")