Elliottwave-Forecast

Master Trader
Feb 17, 2017
2,836
10
84
www.elliottwave-forecast.com
IWM barely breached the November 2021 high before a significant pullback followed. However, the larger bullish cycle should resume in the coming weeks while current pullback ends above 161.69 pivot point. Where should buyers look for the next opportunity?

The iShares Russell 2000 ETF (IWM) is one of the most widely traded exchange-traded funds (ETFs) that tracks the performance of the Russell 2000 Index. This index represents the smallest 2,000 companies in the broader Russell 3000 Index, focusing on small-cap U.S. companies

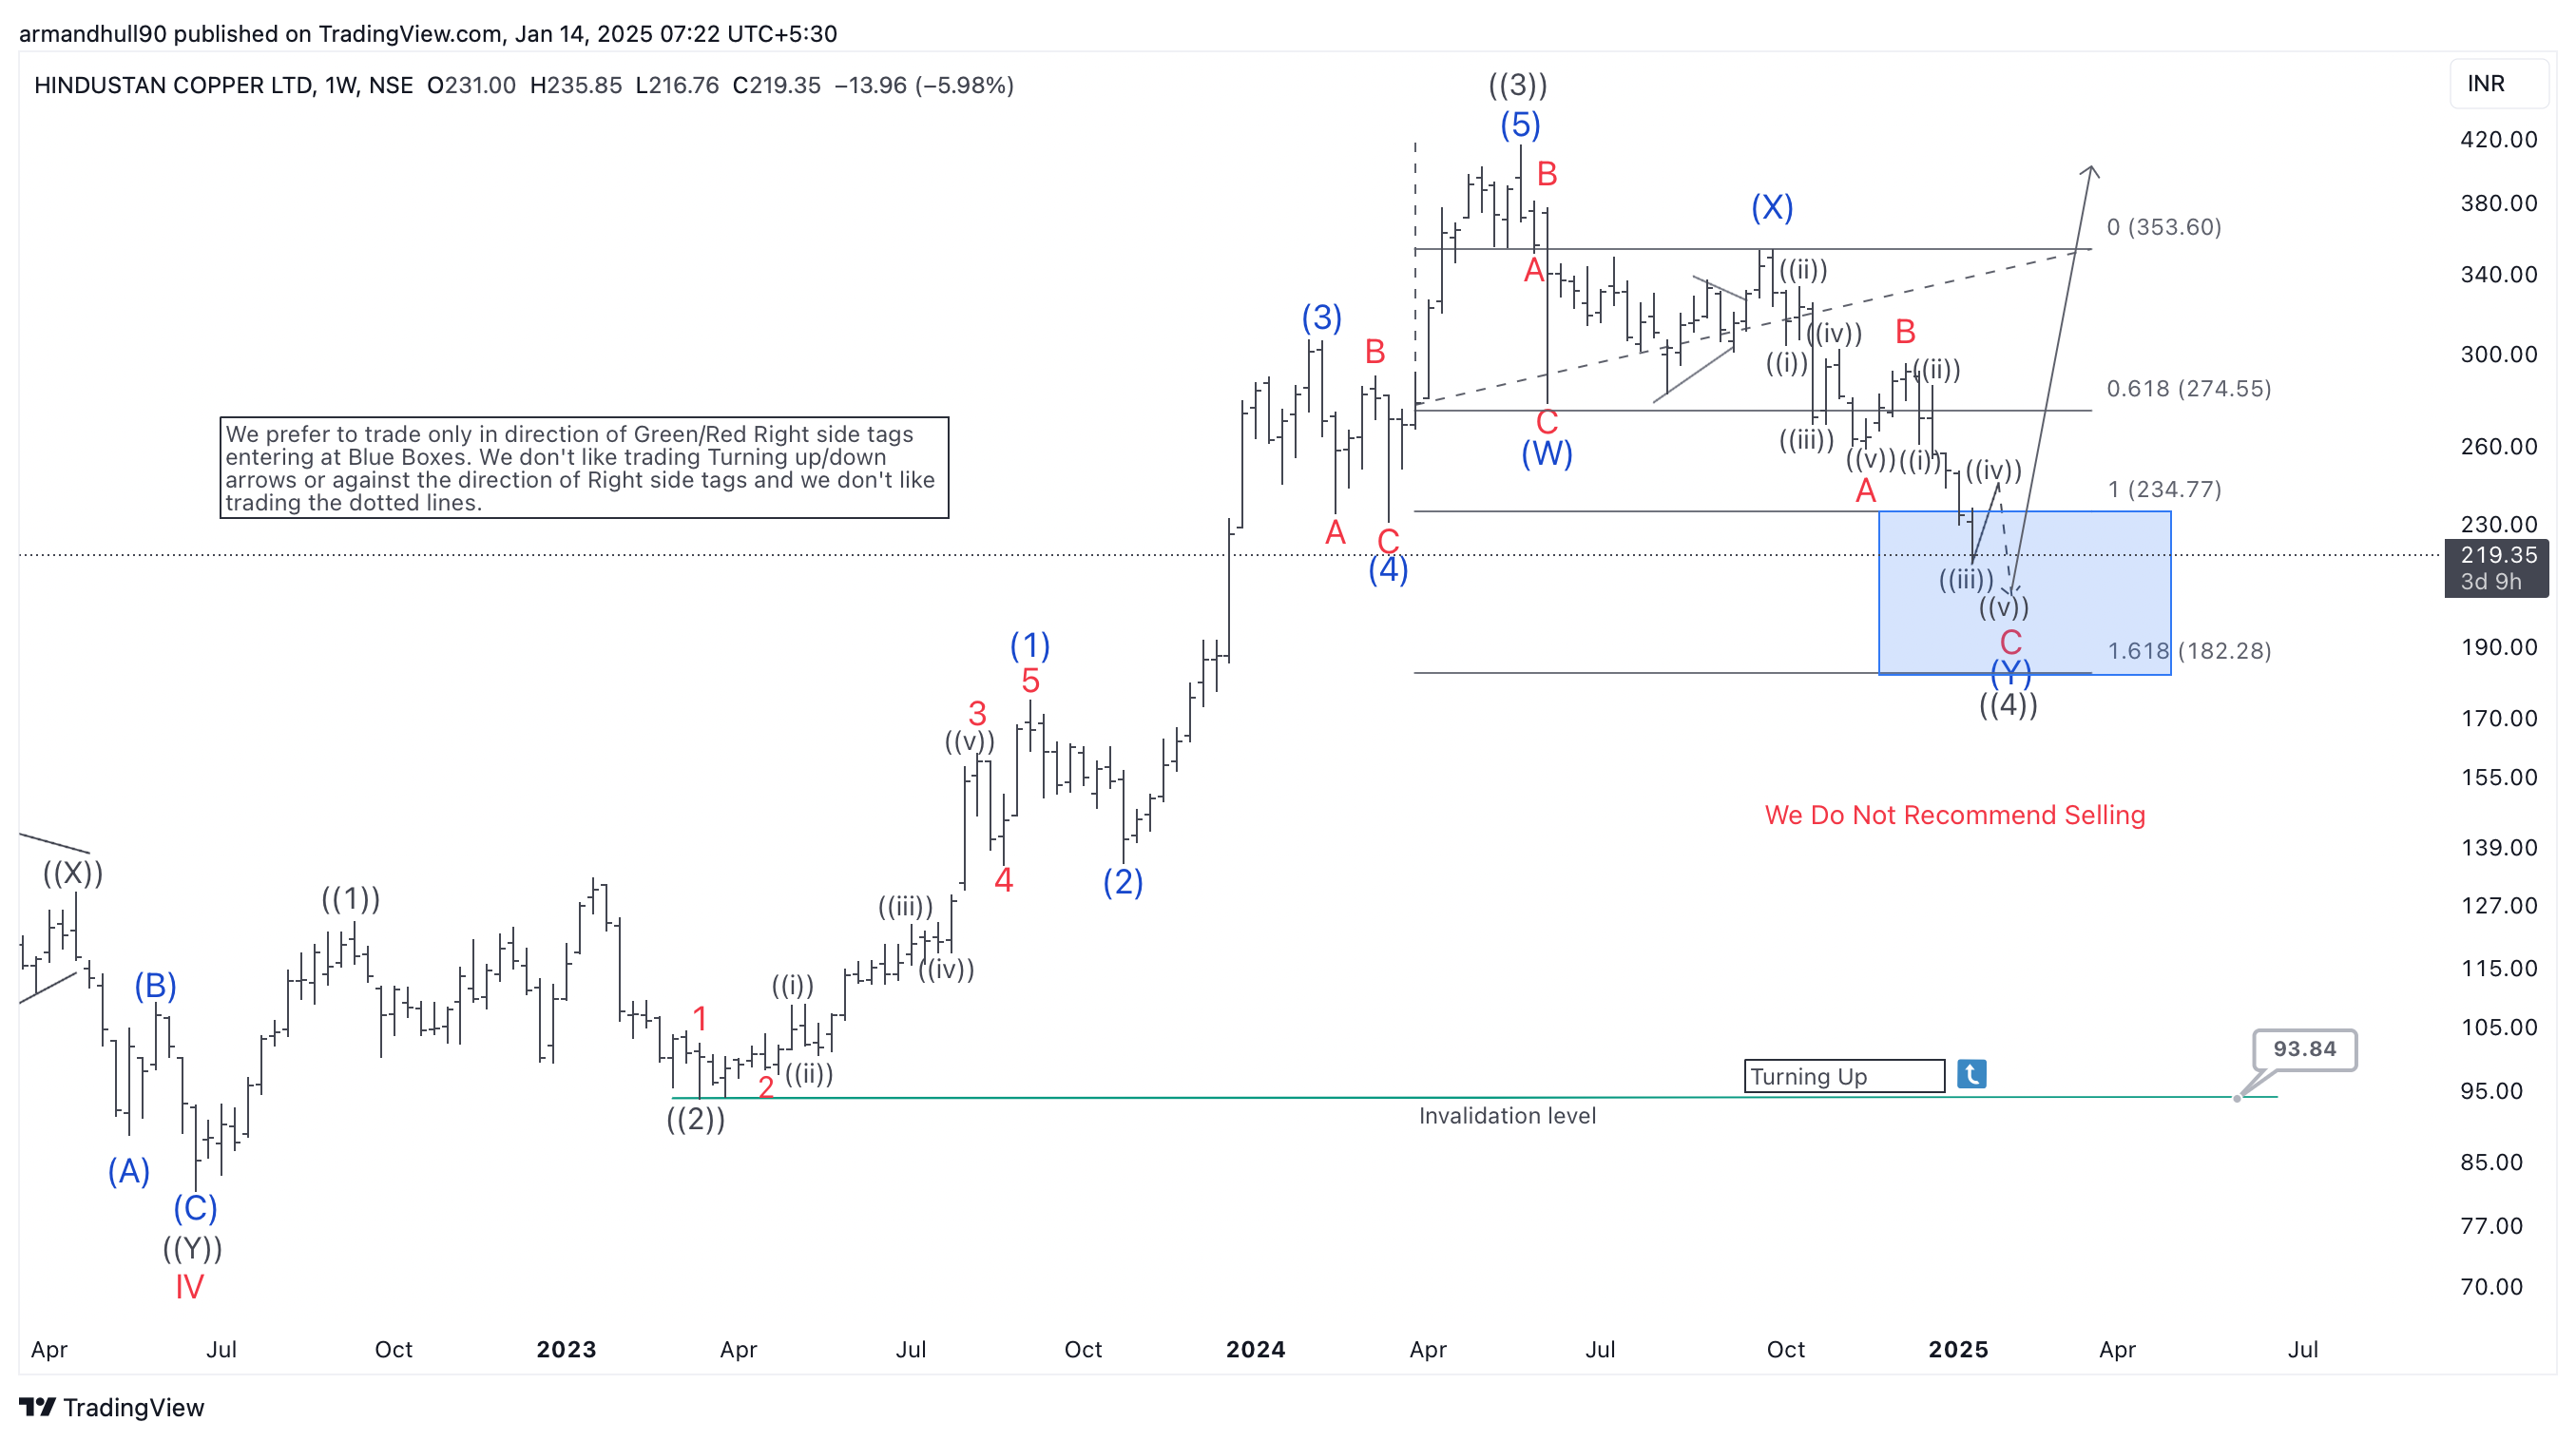
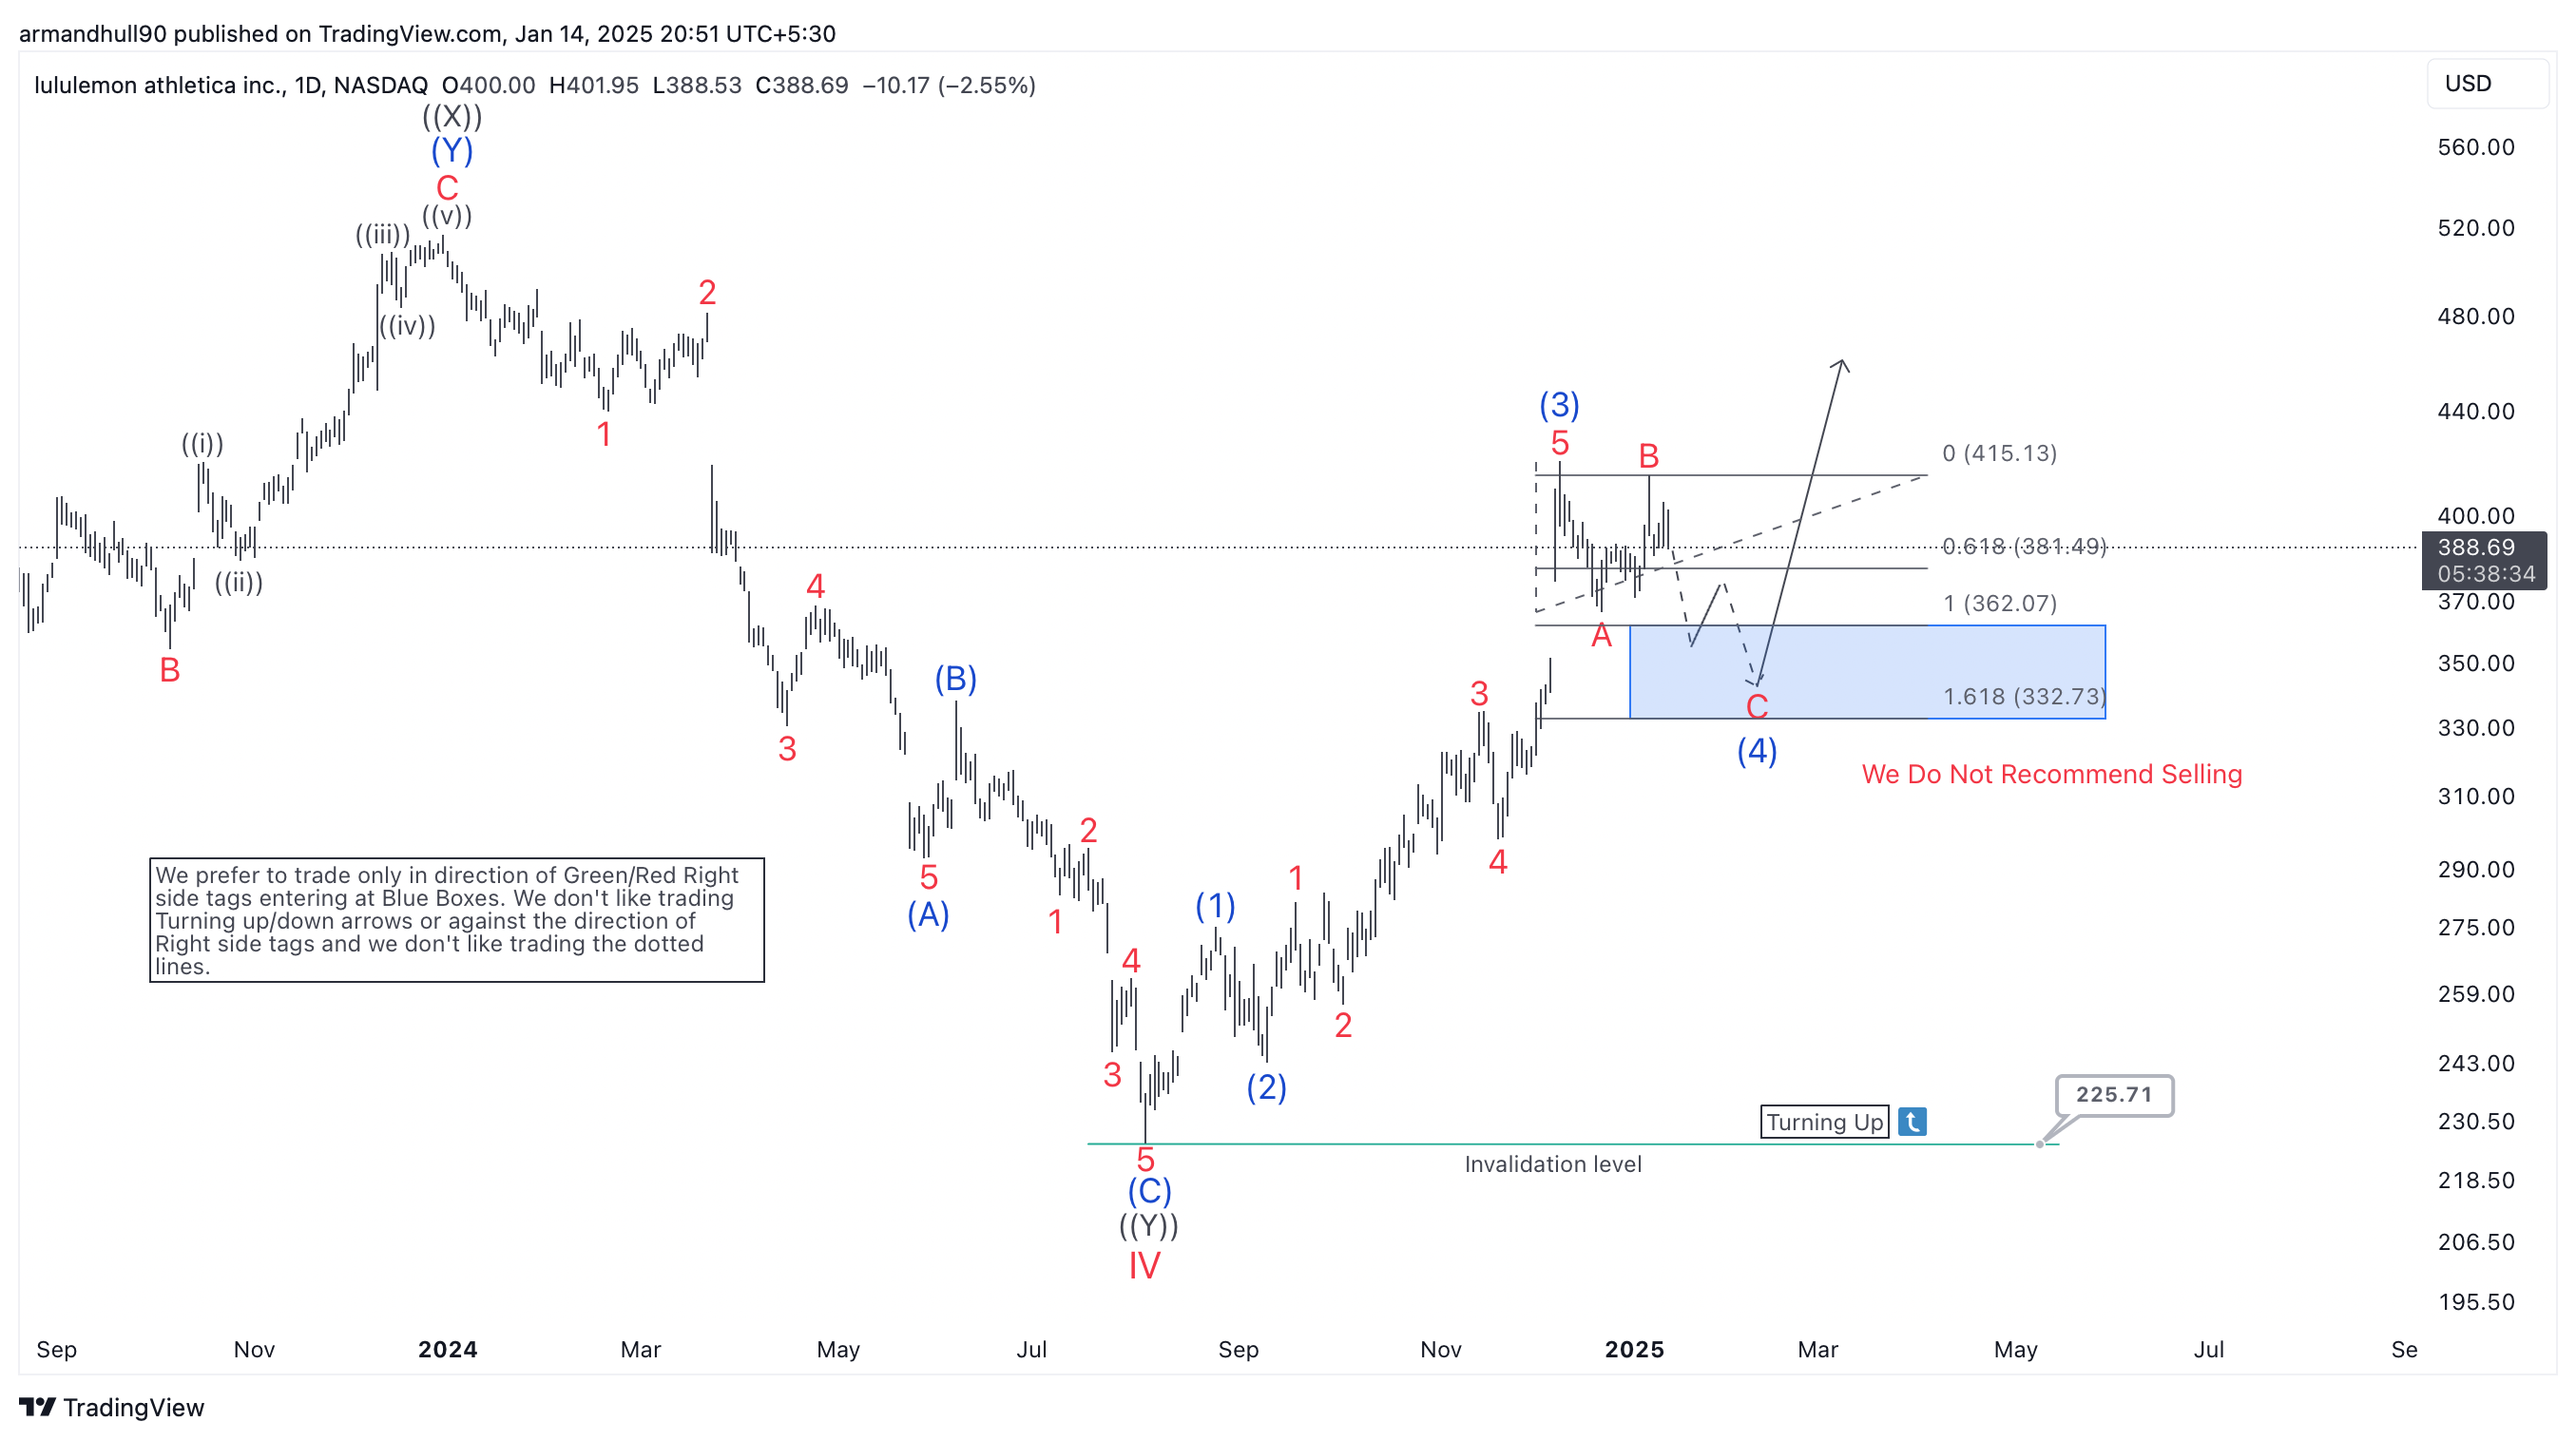
IWM is bullish on both the weekly and daily charts against the March 2020 and October 2023 lows respectively. Despite the current pullback from the November 2024 high, the ETF remains in a clear bullish trend. Before this pullback, prices completed a corrective cycle in October 2023 after a 5-wave bullish sequence that spanned March 2020 to November 2021. The bullish move from October 2023 is forming a 5-wave sequence that should surpass the November 2021 high. While the 3rd wave of this sequence broke above the November 2021 peak, the 5-wave structure is not yet complete. Thus, the current pullback from the November 2024 high likely represents wave ((4)).

In long-term bullish trends like this, pullbacks often present favorable buying opportunities. In contrast, during bearish trends, sellers target the extremes of rallies. Buyers should wait for wave ((4)) to reach its extreme before entering long positions. The pullback from the November 2024 high appears incomplete. Where will wave ((4)) find its bottom and invite new bids?

IWM Daily Chart Updated on 12.01.2024

IWM

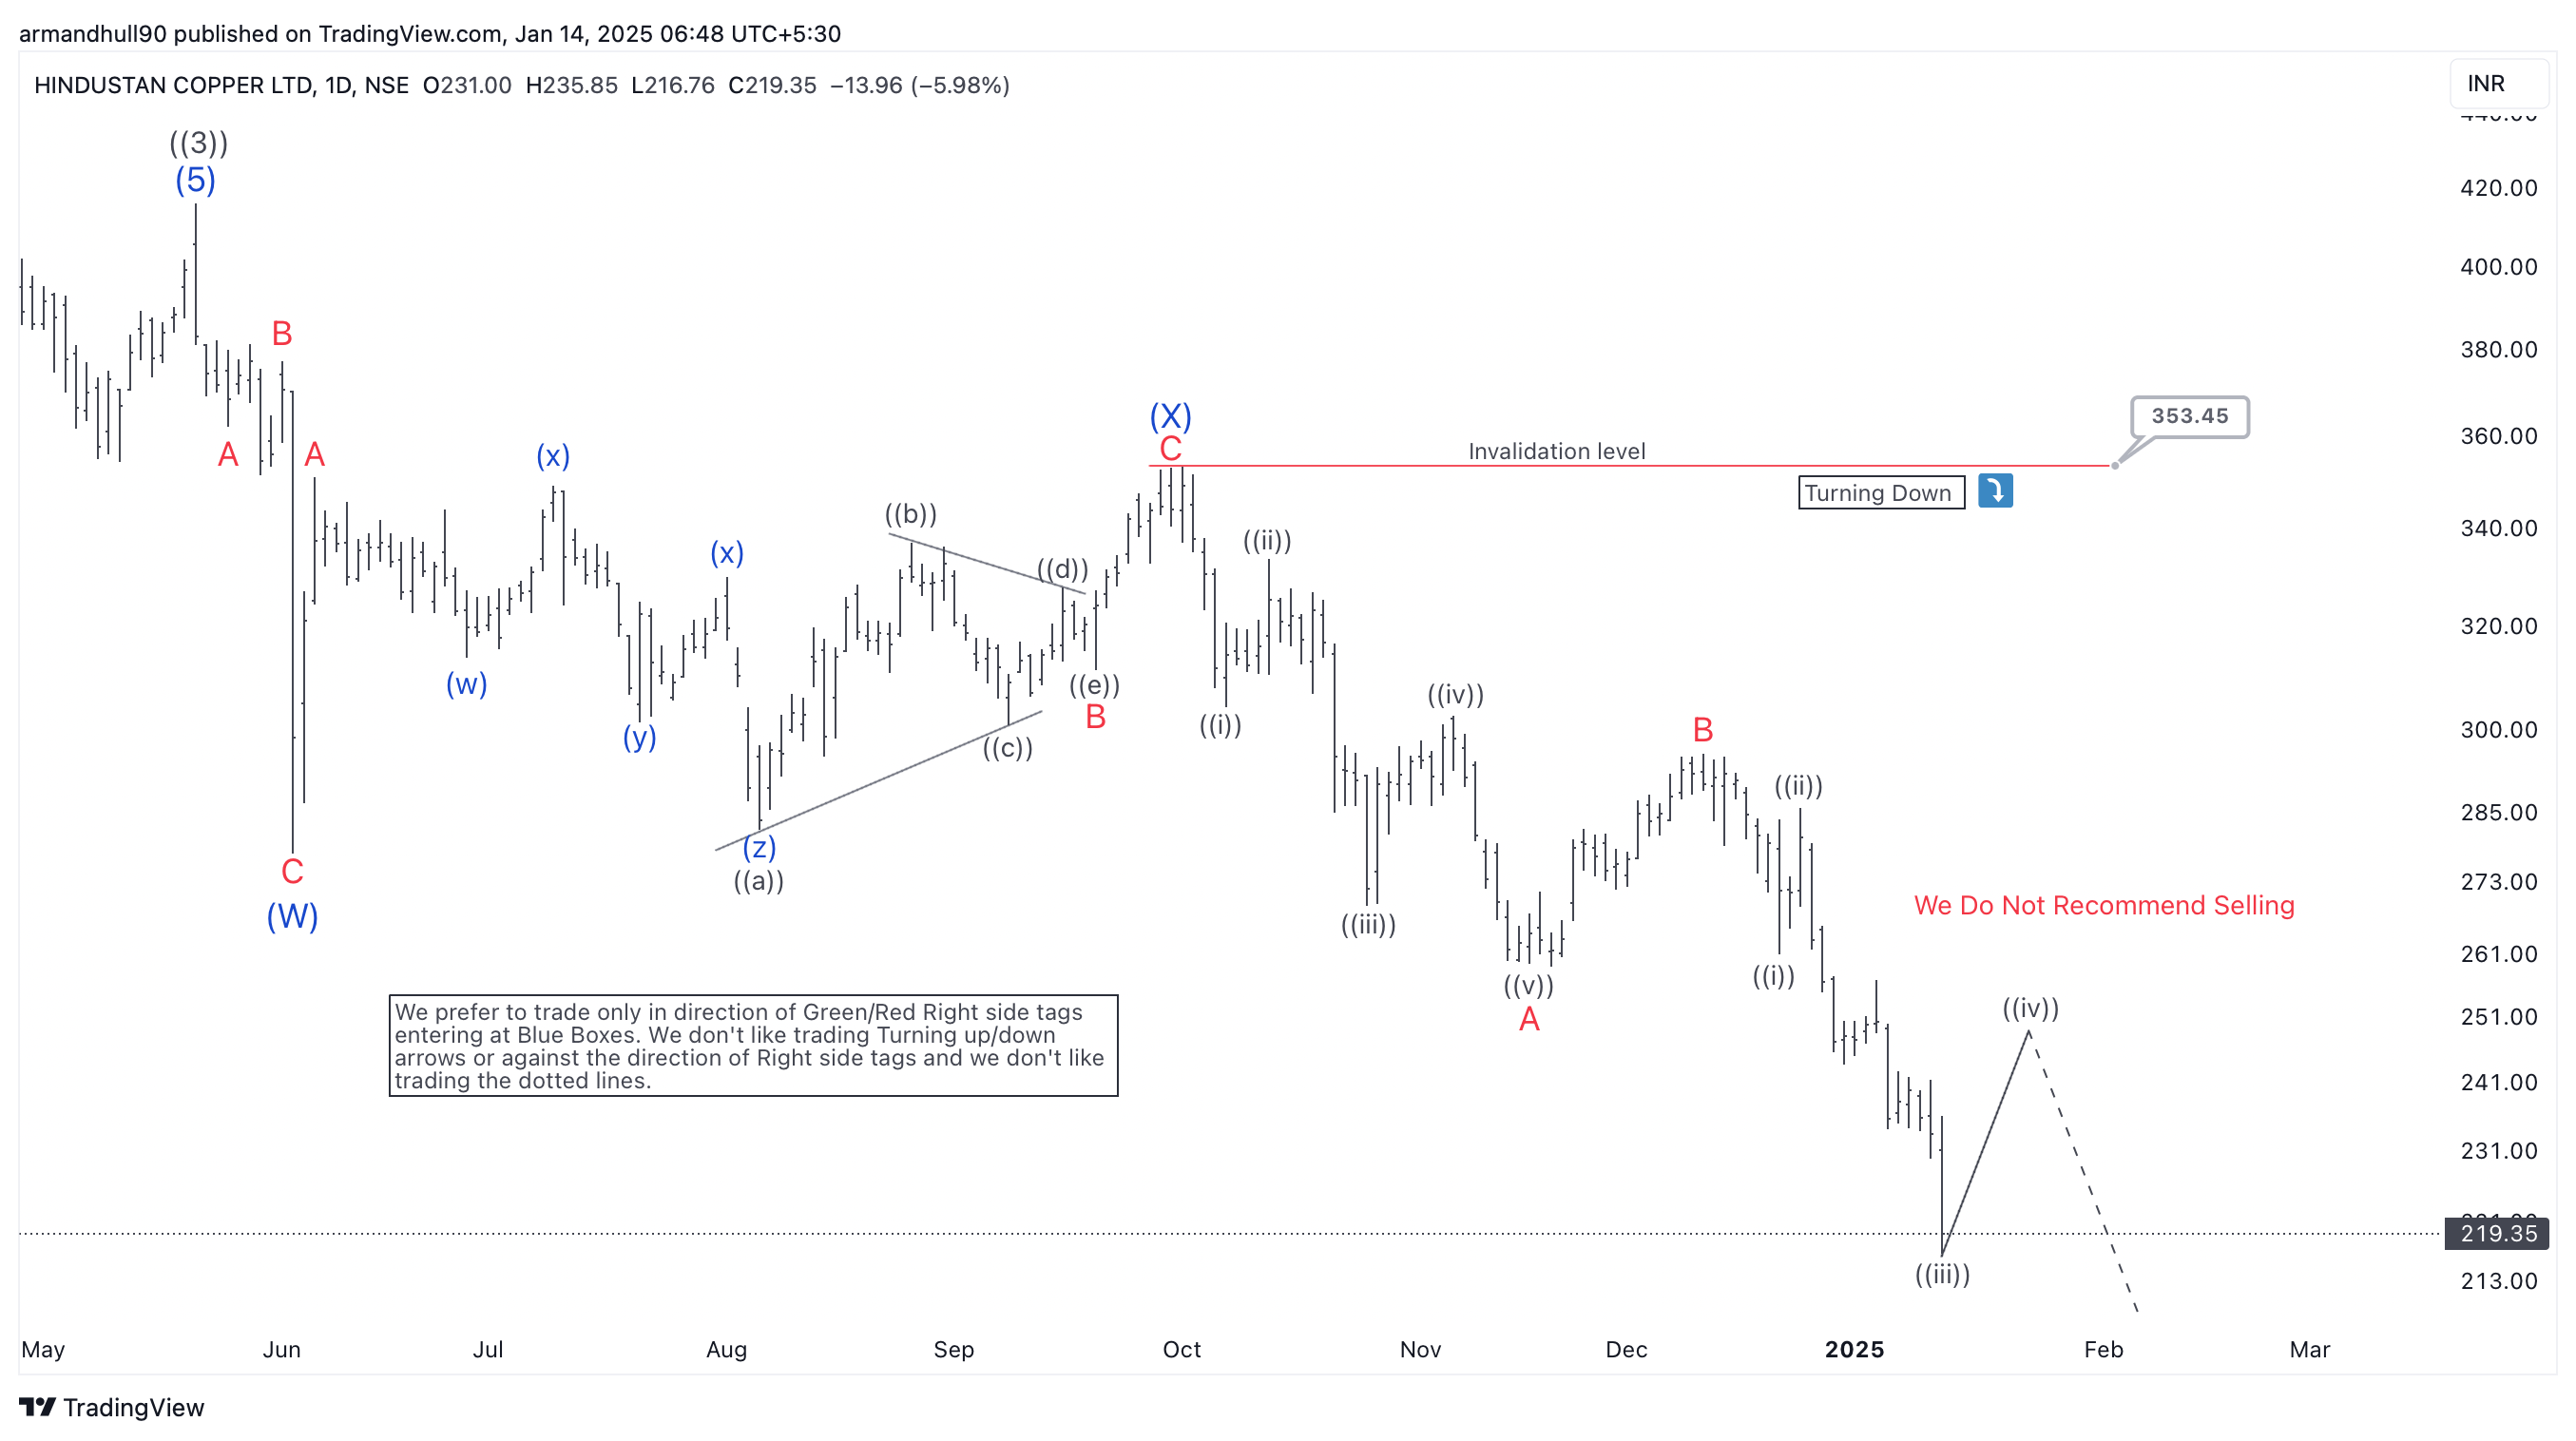
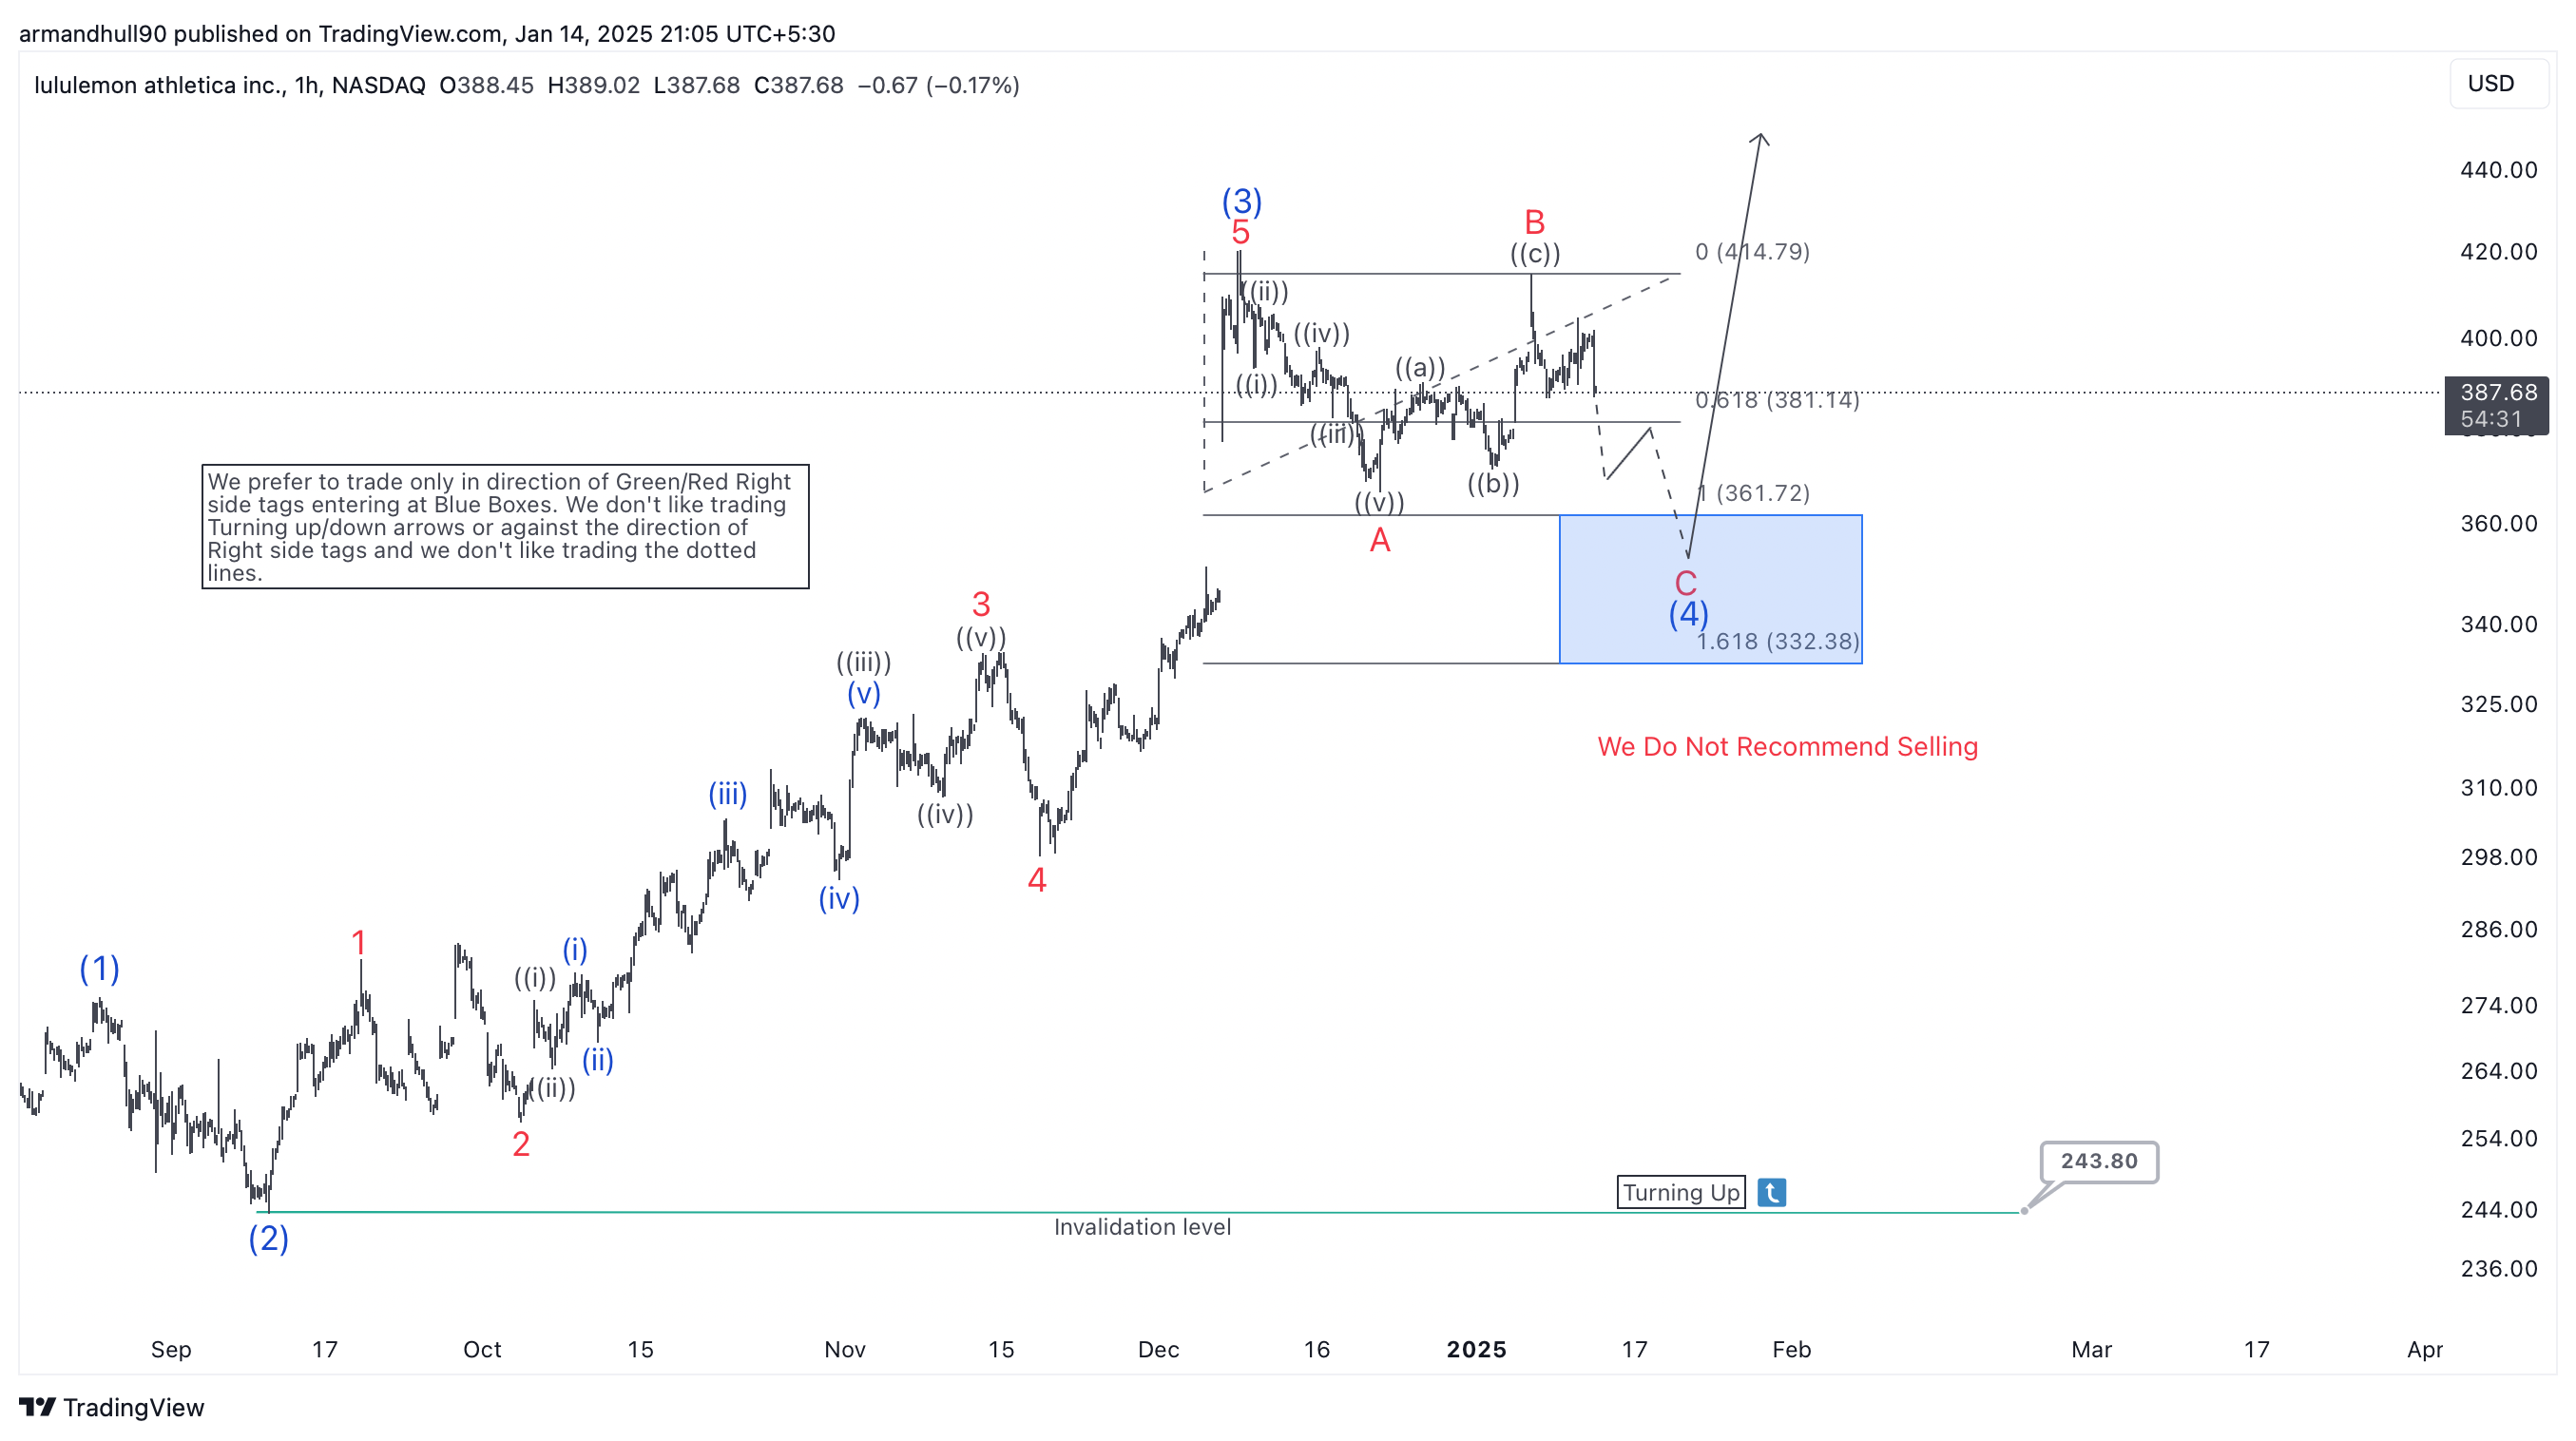
As the daily chart above shows, IWM is evolving lower with a double zigzag (7-swing) structure. Wave (W) of ((4)) ended on 20.12.2024, followed by wave (X) on 06.01.2025. Although wave (X) appears shallow, the break below the wave (W) low confirms that wave (Y) is in progress. Wave (X) acts as the connector within the double zigzag. As long as the 227.17 level (wave (X) high) remains intact, wave (Y) should continue lower toward the 198.65–181.06 Fibonacci extreme. At this zone, wave ((4)) is expected to complete, and wave ((5)) should begin. Buyers will likely focus on this area for new opportunities.

Why can't we sell now?

Of course, you may be wondering, "Why not sell now?" While we expect the dip in wave (Y) to reach the extreme area, the probability of this playing out exactly as forecast is less than 50%. Price could take an alternative path and complete the pullback at a different extreme. However, if the dip does extend as expected, there is at least a 70% chance that a 3-swing bounce will occur at the projected extreme area.

This high probability is supported by two key reasons:
  1. The bullish overall trend: Institutional buyers often take advantage of dips in a bullish market to buy low and sell high, just as they sell into bounces in a bearish market to maximize profits.
  2. Historical patterns in pullbacks: More than 70% of the time, 3- or 7-swing pullbacks/bounces in bullish or bearish sequences react strongly near the equal leg zone (100-138.2%).
We will closely monitor IWM’s price action for Elliottwave-Forecast members in the coming days across all time frames. When a buy setup emerges, we ensure our members don’t miss the opportunity.

Source: https://elliottwave-forecast.com/stock-market/where-should-buyers-expect-iwm-long/
 

Elliottwave-Forecast

Master Trader
Feb 17, 2017
2,836
10
84
www.elliottwave-forecast.com
Hello fellow traders. In this technical article we’re going to take a quick look at the Elliott Wave charts of EURUSD , published in members area of the website. As our members know, EURUSD is still trading within the cycle from the September’s peak. Recently, we saw a 3-wave recovery, followed by a decline toward new lows as expected. In the further text, we are going to explain the wave count.

EURUSD H1 New York 01.07.2025​

The current view suggests that EURUSD pair completed a 3-wave recovery at 1.0437 peak , labeled as wave ((ii)) black. A sharp drop followed from this high, appearing impulsive . We have labeled this short-term cycle as wave i red. As far as the price stays below 1.0437 high, we believe next leg down can be in progress. We expect EURUSD to continue finding intraday sellers in 3, 7, and 11 swings

Reminder : You can learn more about Elliott Wave Patterns at our Free Elliott Wave Educational Web Page.

90% of traders fail because they don’t understand market patterns. Are you in the top 10%? Test yourself with this advanced Elliott Wave Test

EURUSD

EURUSD H1 Weekend update 01.11.2025​

The 1.0437 high held as expected. We got a decent decline when the price broke toward new lows, confirming wave ((iii)) is in progress. We don't recommend buying the pair yet, and expect to see further weakness in upcoming days.

Remember, the market is dynamic, and the presented view may have changed in the meantime. For the most recent charts and target levels, please refer to the membership area of the site. The best instruments to trade are those with incomplete bullish or bearish swing sequences. We put them in Sequence Report and best among them are presented in the Live Trading Room

Reminder for members: Our chat rooms in the membership area are available 24 hours a day, providing expert insights on market trends and Elliott Wave analysis. Don’t hesitate to reach out with any questions about the market, Elliott Wave patterns, or technical analysis. We’re here to help.

EURUSD

Source: https://elliottwave-forecast.com/forex/eurusd-elliott-wave-forecasting-decline/
 

Elliottwave-Forecast

Master Trader
Feb 17, 2017
2,836
10
84
www.elliottwave-forecast.com
Hello Traders! In today’s update, we’ll revisit the Elliott Wave structure of Modine Manufacturing Co. ($MOD) and provide insights into the next phase of its price action. You can check the last article here. As anticipated, the 5-wave impulsive cycle from May 2023 has concluded, and a corrective pullback has begun. This pullback presents a potential buying opportunity in the coming weeks. Let’s break it down.

5 Wave Impulse Structure + ABC correction​

$ADBE

$MOD Weekly Elliott Wave View November 25th 2024:​

$MOD

$MOD Weekly Elliott Wave View January 13th 2025:​

$MOD

Since our last update, $MOD has confirmed the completion of wave (5) within the broader wave ((3)). The stock has now entered a corrective phase, consistent with Elliott Wave Theory. Here’s how the structure is unfolding so far:

  1. The first leg lower, labeled wave (A), has already formed, marking the initial phase of the pullback.
  2. This was followed by a bounce in wave (B), which appears to have concluded.
  3. The stock is now likely entering wave (C) of the larger wave ((4)) correction, which should target the Blue Box area at $94.23–$72.73.

Blue Box Area: A Key Buying Opportunity

The Blue Box area represents a high-probability reversal zone where buyers could re-enter for the next bullish cycle. This correction, which follows the 5-wave impulse, allows the market to reset and create new opportunities for traders.

  • Blue Box Target Zone: $94.23–$72.73
  • Wave Structure: Corrections typically unfold in 3 swings (ABC), with wave (C) often extending into the Blue Box.
As $MOD approaches this zone, traders should closely monitor price action for signs of reversal and a resumption of the larger uptrend.

What’s Next for $MOD?

Once wave ((4)) completes in the Blue Box area, we expect $MOD to resume its bullish trend with a rally in wave ((5)). This next impulsive move could take the stock to new highs, continuing its long-term uptrend.

However, traders should exercise patience and wait for confirmation before entering new positions. Risk management is crucial, as corrections can sometimes extend beyond expected levels.

Key Takeaways for Traders

  1. Wave Completion: Wave (5) of ((3)) has ended, and the corrective pullback in wave ((4)) is underway.
  2. Current Focus: $MOD is trading lower in wave (C), targeting the Blue Box area between $94.23–$72.73.
  3. Buying Opportunity: The Blue Box offers a high-probability zone for buyers to re-enter before the next bullish wave ((5)).
  4. Long-Term Outlook: After completing wave ((4)), $MOD is expected to resume its larger uptrend, providing significant upside potential.

Conclusion

The current correction in Modine Manufacturing Co. ($MOD) aligns with our Elliott Wave analysis and offers a strategic buying opportunity. As the stock approaches the $94.23–$72.73 Blue Box, traders should prepare to capitalize on the next leg of the uptrend. Stay patient, focus on risk management, and let the Elliott Wave structure guide your decisions.

Keep an eye on $MOD’s price action as it progresses toward the Blue Box, and we’ll provide further updates as the market develops. Happy trading!

Source: https://elliottwave-forecast.com/st...e-5-waves-ended-corrective-pullback-underway/
 

Elliottwave-Forecast

Master Trader
Feb 17, 2017
2,836
10
84
www.elliottwave-forecast.com

Weekly Elliott Wave Counts Suggest The Correction Is Nearing Completion​

The Elliott Wave analysis for Hindustan Copper Ltd. (NSE) indicates a correction on the weekly chart. The broader structure follows a five-wave sequence, with waves ((1)) and ((3)) already completing their upward moves. Currently, wave ((4)) is unfolding as a double zigzag pattern (W-X-Y). Wave (Y) aims for the area of 1 and 1.618 Fibonacci extension of wave (W), between 234 and 182 INR.

Importantly, the analysis identifies a blue box zone, which signals a high-probability reversal area. Wave ((4)) is likely to end here, after which wave ((5)) should resume the bullish trend. This wave is expected to break above the high of wave ((3)) at 354.65 INR. However, the invalidation level lies below the blue box. If the price falls below this level, the analysis would need revision.

Daily Chart: Short Term Outlook​

On the daily chart, wave ((4)) is visible as a detailed double zigzag (W-X-Y). The final wave (Y) is progressing as a downward five-wave move. So far, the price has reached the blue box, which aligns with Fibonacci levels between 1.0 and 1.618.

A minor rebound in wave (iv) is likely, with resistance near 250–260 INR. Afterward, wave (iii) may extend further downward, targeting an area of 234-182 INR. Traders should look for confirmation of a trend reversal in the blue box before taking long positions. This zone is crucial because it could mark the end of the correction and the start of wave ((5)).


Source: https://elliottwave-forecast.com/stock-market/elliottwave-counts-explained/
 

Elliottwave-Forecast

Master Trader
Feb 17, 2017
2,836
10
84
www.elliottwave-forecast.com
NextEra Energy, Inc., (NEE) through its subsidiaries generates, transmits, distributes & sells electric power to retail & wholesale customers in North America. The company generates electricity, through wind, solar, nuclear, natural gas & other clean energy. It comes under Utility sector & trades as “NEE” ticker at NYSE.

As shown in the last article, NEE shown impulse sequence of I ended at $86.10 high. Below there, it favors pullback in II in double three correction against October-2023 low before rally continue. It favors pullback towards $65.86 – $57.50 area before turning higher either in ((X)) or may be new rally.

NEE - Elliott Wave Latest Weekly View:

In Weekly, it ended ((I)) sequence at $93.73 high in December-2021. Below, it ended ((II)) at $47.15 low in October-2023 as double three correction. Within ((II)), it placed (w) at $67.22 low as 3 swing pullback, (x) as triangle connector ended at $76.67 high & (y) at $47.15 low in extreme areas. Above there, it favors upside in ((III)) sequence, which confirms when break above $93.73 high.

NEE - Elliott Wave Weekly View from 10.07.2024:

Since October-2023 low, it ended I impulse at $86.10 high in September-2024. Within I, it placed ((1)) at $64.59 high, ((2)) at $53.95 low, ((3)) at $80.47 high, ((4)) at $68.97 low & finally ((5)) at $86.10 high. Currently, it favors double three correction lower in II. It placed (W) at $72.69 low, (X) at $79.38 high & favors lower in (Y) towards $65.86 - $57.50 area to finish ((W)) of II. Buyers should take control from the extreme areas to bounce either in ((X)) or upside in III, which confirms above I high. In any situation, it should see at least 3 swing bounce soon towards $70 or higher levels.

Source: https://elliottwave-forecast.com/stock-market/nextera-nee-expect-bounce-from-inflection-area/
 

Elliottwave-Forecast

Master Trader
Feb 17, 2017
2,836
10
84
www.elliottwave-forecast.com
In this technical blog, we will look at the past performance of the 1-hour Elliott Wave Charts of the Gold miners ETF ticker symbol: GDX. In which, the decline from the 24 October 2024 high is unfolding in a corrective sequence. Also showed a lower low sequence with a bearish sequence stamp. Therefore, we knew that the structure in GDX is incomplete to the downside & should see more weakness. So, we advised members to sell the bounces in 3, 7, or 11 swings at the blue box areas. We will explain the structure & forecast below:

GDX 1-Hour Elliott Wave Chart From 1.10.2025​

GDX Found Sellers As Expected From Blue Box Area

Here’s the 1-hour Elliott wave Chart from the 1.10.2025 Midday update. In which, the decline to $33.42 low ended wave A of (Y) & made a bounce in wave B of (Y). The internals of that bounce unfolded as an Elliott wave zigzag correction. And managed to reach the blue box area towards $36.65- $37.98 blue box area. From there, sellers were expected to appear looking for more downside or for a 3 wave reaction lower at least.

GDX Latest 1-Hour Elliott Wave Chart From 1.14.2025​

GDX Found Sellers As Expected From Blue Box Area

This is the Latest 1-hour view from the 1.14.2025 Post-Market update. In which the ETF is showing a reaction lower taking place from the blue box area allowing shorts to get into a risk-free position shortly after taking the position. However, a break below the $33.42 low would still be needed to confirm the next extension lower & avoid a double correction higher. Now, as far as bounces fail below $36.90 high GDX is expected to resume the downside. Ideally towards $29.39- $27.07 target area lower minimum before a bounce happens.

Source: https://elliottwave-forecast.com/stock-market/gdx-found-sellers-expected-blue-box-area/
 

Elliottwave-Forecast

Master Trader
Feb 17, 2017
2,836
10
84
www.elliottwave-forecast.com
In this technical article we’re going to take a look at the Elliott Wave charts charts of Ethereum ETHUSD published in members area of the website. As our members know, we generally favor the long side in cryptos, which have recently offered good trading opportunities. However, ETHUSD can be still correcting the cycle from the August low and is not yet ready for buying at this stage. In the following text, we will explain the Elliott Wave forecast.

Ethereum ETHUSD 1h Hour Elliott Wave Analysis 01.05.2025.​

Currently, ETHUSD is correcting the cycle from the 4111.3 high. The Elliott Wave view suggests that the recovery is unfolding as Zig Zag Pattern. When we analyze the lower time frames, we can observe that the inner subdivisions of waves A and B (red) exhibit 5-wave patterns, with wave B ending as a sideways triangle. The (X) connector is approaching the 0.618 Fibonacci retracement level. We believe the (X) connector should ideally end around the 3717.7-3885.1 area. We recommend that our members avoid buying at this stage.

You can learn more about Elliott Wave FLAT and other Patterns at our Free Elliott Wave Educational Web Page

ETHUSD

Ethereum ETHUSD 1h Hour Elliott Wave Analysis 01.07.2025.​

The current view suggests the (X) connector may have ended at the 3477 peak. As long as the price stays below that level, we expect to see further weakness.

90% of traders fail because they don’t understand market patterns. Are you in the top 10%? Test yourself with this advanced Elliott Wave Test


ETHUSD

Ethereum ETHUSD 1h Hour Elliott Wave Analysis 01.10.2025.​

The 3744 peak held well, and we saw further separation from that high as expected. The crypto made a decent drop, forming a clear 5-wave pattern from the 3744 high. We expect to see a 3-wave bounce in red wave B before the further decline continues, ideally toward new lows. ETHUSD can target the 2713 area, as long as the pivot at the 3744 high holds. Overall, the view remains bullish. So .we don't favor selling and would wait for an extreme zone to be reached before looking to buy again.

Keep in mind that market is dynamic and presented view could have changed in the mean time. You can check most recent charts in the membership area of the site. Best instruments to trade are those having incomplete bullish or bearish swings sequences. For additional information on the best trading strategies for Bitcoin, visit our Live Trading Room and stay updated with the latest insights in our 24H Chat Room.

ETHUSD

Source: https://elliottwave-forecast.com/cryptos/ethereum-ethusd-elliott-wave-forecast/
 

Elliottwave-Forecast

Master Trader
Feb 17, 2017
2,836
10
84
www.elliottwave-forecast.com
The Elliott Wave analysis for Lululemon Athletica (NASDAQ: LULU) provides a detailed examination of its ongoing corrective structure within a larger five-wave impulsive sequence.

Daily Elliott Wave Counts:​

On the daily chart, the stock remains in wave (4), a corrective phase within a larger impulsive trend. Wave (4) appears to follow an ABC zigzag pattern. Wave A has already ended as a five-wave decline. Meanwhile, wave B is still developing. It might take the form of a flat or expanded flat correction with three distinct waves.

Once wave B completes, wave C is likely to move downward. It could reach the Fibonacci extension zone between 1.0 ($361.72) and 1.618 ($332.38). This area corresponds with the "blue box," a key high-probability reversal zone. The blue box signals where wave (4) might end, offering a potential entry for the bullish wave (5). The invalidation level is positioned below $225.71, ensuring a clear boundary for risk management.


Hourly Counts: Short-term Outlook​

On the hourly chart, wave (4) reveals crucial details, especially the structure of wave B. This wave is developing as a complex correction, likely a flat or double zigzag. Wave A already ended with a clear five-wave decline. Meanwhile, wave B is unfolding in a three-wave corrective pattern.Next, wave C is expected to complete as a five-wave decline. It will likely reach the blue box between $361.72 and $332.38. This area acts as a strong support zone and provides a high-probability reversal point. If the price reverses here, wave (5) could begin. This upward move may surpass the wave (3) high of $415.13, offering significant bullish potential.

Moreover, the analysis highlights the importance of trading in the direction of green right-side tags. These tags indicate favorable trends. Traders should avoid speculative positions, such as shorting in the blue box or relying on dotted-line projections. When wave (5) materialises as expected, it will likely confirm the Elliott Wave analysis and unlock further upside potential.


Source: https://elliottwave-forecast.com/st...n-athletica-nasdaq-lulu-different-timeframes/
 

Elliottwave-Forecast

Master Trader
Feb 17, 2017
2,836
10
84
www.elliottwave-forecast.com
More than two years back, we were calling Gold to end a Zigzag Elliott Wave correction in the blue box area and resume the rally. Zigzag is a 5-3-5 Elliott wave structure in which wave A and C are in 5 waves and wave B is in 3 waves. Blue Boxes are High-Frequency areas and are based in a relationship of sequences, cycles and calculated using Fibonacci extensions. We refer to them as High Frequency trading areas, mainly because at Blue Boxes majority of the times, both buyers and sellers agree in the direction of the next moves and, hence why they present high probability and low-risk opportunities to enter the market in the direction of the trend. Let's take a look at the weekly Elliott wave chart of Gold from September 2022.

Gold Weekly Chart September 2022​

Gold Elliott Wave View September 2022

Gold cycle from 2015 low ended at $2075.14 on 08.03.2020 high. Following this peak, $XAUUSD started a pullback which lasted more than two years. Back in September 2022 (as shown in the chart above), we expected the yellow metal pullback to complete in the blue box area between $1668.46 - $1420.66 and rally to resume for a new high above 08.03.2020 high or for a three waves reaction higher at least. $1420.66 being the 161.8% Fibonacci extension of (( A )) related to (( B )) was the invalidation level which we expected to hold.


Gold Weekly Chart January 2025​

Gold Weekly Elliott Wave view January 2025


Gold buyers indeed appeared in the blue box as expected and it started a rally which has lasted 27 months but is still not over yet. Blue box low was seen on 09.22.2022 at $1615.01 and since then we see Gold rally to be in fifteen (15) swings. Gold made a new all-time high, rally is extended as third wave went past 161.8 Fibonacci extension of wave (( 1 )) related to wave ((2)) but we still expect more upside because fifteen (15) is part of a corrective sequence and we need at least 1 more high to make it seventeen (17) swings and hence complete the cycle since 09.22.2022 low. As dips hold above wave (( 4 )) low at $2536.89, we are expecting more upside in Gold toward $2852.91 - $2950.50 area to complete wave ((5)). Following this, there should be a larger 3 waves pull back to correct the cycle from 09.22.2022 low. In the unlikely event of a break below $2536.89, Gold should still be in wave ((4)) and can see a test of $2474.41 - $2318.80 area before it turns higher in wave ((5)).

Source: https://elliottwave-forecast.com/commodities/gold-2022-cycle-not-over-yet/
 

Elliottwave-Forecast

Master Trader
Feb 17, 2017
2,836
10
84
www.elliottwave-forecast.com
Hello fellow traders. In this technical article we’re going to look at the Elliott Wave charts of Apple Stock ( AAPL) published in members area of the website. As probably most of the traders know, The Stock is in overall bullish trend. Recently we forecasted the pull back which has corrected the cycle from the 195.88 low. In further text we’re going to explain the Elliott Wave analysis.

AAPL Elliott Wave 1 Hour Chart 01.08.2025​

Apple stock is showing incomplete sequences in the cycle from the 260.11 peak. A break of the (W) low created a lower low sequence, which calls for further weakness in the stock as long as the pivot at 247.35 (X) blue high holds. Apple could be heading toward the $229–$225 area.

Let's analyze the price structure further.
We see a corrective structure from the peak, labeled as ABC red, followed by a three-wave bounce and another break lower. The current view suggests the correction may be unfolding as an Elliott Wave double-three pattern, labeled as (W)(X)(Y) blue, with wave ((x)) acting as a connector in the form of an Elliott Wave Zig Zag pattern.

We don’t recommend forcing trades at this stage. The strategy is to wait for the extreme zone to be reached before buying the stock again.

You can learn more about Elliott Wave Patterns at our Free Elliott Wave Educational Web Page

90% of traders fail because they don’t understand market patterns. Are you in the top 10%? Test yourself with this advanced Elliott Wave Test

AAPL

AAPL Elliott Wave 1 Hour Chart 01.16.2025​

The price remained below the 247.35 peak during short-term recoveries, and the stock made a further decline as expected. The price is heading toward our target area of $229–$225, where we would like to become buyers again. We don’t recommend selling the stock and prefer the long side from the mentioned extreme zone.

Remember, the market is dynamic, and the presented view may have changed in the meantime. For the most recent charts and target levels, please refer to the membership area of the site. The best instruments to trade are those with incomplete bullish or bearish swing sequences. We put them in Sequence Report and best among them are presented in the Live Trading Room

Reminder for members: Our chat rooms in the membership area are available 24 hours a day, providing expert insights on market trends and Elliott Wave analysis. Don’t hesitate to reach out with any questions about the market, Elliott Wave patterns, or technical analysis. We’re here to help.


AAPL

Source: https://elliottwave-forecast.com/stock-market/apple-stock-aapl/
 

Elliottwave-Forecast

Master Trader
Feb 17, 2017
2,836
10
84
www.elliottwave-forecast.com
The VanEck Semiconductor ETF (SMH) is an exchange-traded fund that tracks a market-cap weighted index composed of 25 of the largest U.S.-listed semiconductor companies. The top holdings of SMH include companies like NVIDIA, Taiwan Semiconductor Manufacturing, Broadcom Inc., Texas Instruments, QUALCOMM, ASML Holding N.V., Applied Materials, Inc., Lam Research Corporation, Micron Technology, Inc., and Advanced Micro Devices, Inc.

SMH 4 Hour Chart September 11th SMH 4 Hour Chart September 11th

Last September 11th, we talked about SMH. After completing wave (III), we had a deep pullback as a zig zag correction. Down from wave (III), wave "a"ended at 226.50 low and bounced as wave "b" ended at 251.00 high. Last push lower completed wave "c" and a wave (IV) at 197.50 low. Then, SMH started the uptrend again and wave (V). It built an impulse structure ending at 253.32 high as wave I. Pullback as wave II ended at 213.57 low. From here, we were expecting to continue the rally in wave III of (V). Ideally, the market should break 284.26 high as target to end wave (V). In case, if this rally would not break above wave (III), the next target to keep an eye comes around 269.50 level.

SMH Daily Chart January 16th

Currently in the daily timeframe, the semiconductors ETF has moved sideways between 230 - 260 dollars. The market rally as expected from 222.20 as the last chart, but it has not been strong enough to break the peak and even worse to reach 269.50 level. Therefore, we adjusted the chart calling the wave I as a leading diagonal ending at 262.26 high. The ranging since October 2024 until today should be the wave II correction. We are calling a running flat correction for this purpose. For us, the wave III has started and wave ((1)) of III ended at 257.20 high and now it is trading in wave ((2)) pullback. As price action remains above 240.62 low, we are expecting for more upside to break 283.07 high.

Besides, as we are calling a running flat correctionas wave II, we cannot rule an expanded flat correction as wave II. That means, if market breaks 240.62 low, SMH should continue lower to 235.29 - 228.61 area to finish wave II before resuming the rally. Let's see how the market treats us. Trade Smart!

Source: https://elliottwave-forecast.com/stock-market/smh-semiconductor-etf-rally-continuation/
 

Elliottwave-Forecast

Master Trader
Feb 17, 2017
2,836
10
84
www.elliottwave-forecast.com
In this technical blog, we will look at the past performance of the 4-hour Elliott Wave Charts of SPX. We presented to members at the elliottwave-forecast. In which, the rally from the October 2022 low unfolding as an impulse structure. Also showed a higher high sequence with a bullish sequence stamp. Suggested that index should see more upside extension to complete the impulse sequence. Therefore, we advised members not to sell the index & buy the dips in 3, 7, or 11 swings at the blue box areas. We will explain the structure & forecast below:

SPX 4-Hour Elliott Wave Chart From 1.09.2025​

SPX Perfectly Reacting Higher From The Blue Box Area

Here’s the 4-hour Elliott wave chart from the 1.09.2025 update. In which, the short-term cycle from the 8.05.2024 low ended impulse sequence & larger wave ((3)) at $6099.97 high. Down from there, the index made a pullback in wave ((4)) to correct that cycle. The internals of that pullback unfolded as Elliott wave double three structure where wave (W) ended at $5832.30 low. Wave (X) bounce ended at $6049.75 high. Then wave (Y) managed to reach the blue box area at $5783.66- $5617.43. From there, buyers were expected to appear looking for the next leg higher or for a 3 wave bounce minimum.

SPX Latest 4-Hour Elliott Wave Chart From 1.18.2025​

SPX Perfectly Reacting Higher From The Blue Box Area

This is the latest 4-hour Elliott wave Chart from the 1.18.2025 Weekend update. In which the SPX is showing a reaction higher taking place, right after ending the double correction within the blue box area. Allowed members to create a risk-free position shortly after taking the long position at the blue box area. However, a break above $6099.97 high is yet to be seen to confirm the next extension higher in wave 5 towards minimum extension target at $6179.13- $6304.44 area.

Source: https://elliottwave-forecast.com/stock-market/spx-perfectly-reacting-higher-blue-box/
 

Elliottwave-Forecast

Master Trader
Feb 17, 2017
2,836
10
84
www.elliottwave-forecast.com
Hello fellow traders,

As our members know we have had many profitable trading setups in Indies recently. In this technical article, we are going to present another Elliott Wave trading setup we got in SPX E-Mini ( ES_F ) . ES_F completed this correction precisely at the Equal Legs zone, referred to as the Blue Box Area. In the following sections, we will delve into the specifics of the Elliott Wave pattern observed and discuss the corresponding trading setup in detail.

ES_F Elliott Wave 1 Hour Chart 01.09.2025​

The current view indicates that ES_F is forming a wave ((4)) black correction. The price action shows an incomplete 5-wave decline from the peak, suggesting that only the first leg of the proposed correction has completed. This correction is likely unfolding as an Elliott Wave Zig-Zag pattern. We anticipate an extension toward the extreme zone at 5808–5623 area, where we are looking to re-enter as buyers.

We recommend members to avoid selling ES_F . As the main trend remains bullish, we anticipate at least a 3-wave bounce from this Blue Box area. Once the price touches the 50 fibs against the ((b)) black connector, we’ll make positions risk-free and set the stop loss at breakeven and book partial profits. On other hand, breaking below the 1.618 Fibonacci extension level at 5338.5 would invalidate the trade.

Official trading strategy on How to trade 3, 7, or 11 swing and equal leg is explained in details in Educational Video, available for members viewing inside the membership area.

Quick reminder on how to trade our charts :

Red bearish stamp+ blue box = Selling Setup
Green bullish stamp+ blue box = Buying Setup
Charts with Black stamps are not tradable.

ES_F

ES_F Elliott Wave 1 Hour Chart 01.19.2025​

The futures has made extension down toward Blue Box and found buyers as expected. ES_F is showing a decent bounce from the Buying Zone. Consequently, any long positions from the Blue Box should now be risk-free. We’ve set our stop loss at breakeven and have already secured partial profits. Now, we would like to see a break of the ((3)) black peak to confirm that the next leg up is in progress.

90% of traders fail because they don’t understand market patterns. Are you in the top 10%? Test yourself with this advanced Elliott Wave Test

Reminder for members: Our chat rooms in the membership area are available 24 hours a day, providing expert insights on market trends and Elliott Wave analysis. Don’t hesitate to reach out with any questions about the market, Elliott Wave patterns, or technical analysis. We’re here to help.


Source: https://elliottwave-forecast.com/trading/sp-500-e-mini-es_f-elliott-wave/
 

Elliottwave-Forecast

Master Trader
Feb 17, 2017
2,836
10
84
www.elliottwave-forecast.com
NU Holdings Ltd., (NU) provides digital banking platform in Brazil, Mexico, Colombia, Germany, Argentina, United States & Uruguay. It offers spending solutions comprising credit & prepaid cards, mobile payment solutions & integrated mall that enables customers to purchase goods & services from various ecommerce retailers. It comes under Financial services sector & trades as “NU” ticker at NYSE.

As shown in the previous article, NU ended ((A)) as 5 swings lower at $10.18 low. Above there, it favors bounce in ((B)) in 3, 7 or 11 swings & expect to fail below $16.15 high to turn lower in ((C)) to finish II.

NU - Elliott Wave Latest Weekly View:

It ended impulse sequence I at $16.15 high from June-2022 low. Within I sequence, it placed ((1)) at $5.88 high & ((2)) at $3.39 low as dip pullback. It ended ((3)) as extended sequence at $13.64 high in July-2024 & ((4)) as sharp pullback at $9.67 low as 0.382 Fibonacci retracement of ((3)). Finally, it ended ((5)) as diagonal sequence from August-2024 low at $16.15 high as I expected from last update.

NU - Elliott Wave View From 12.03.2024:

Below $16.15 high, it ended ((A)) of II at $10.18 low. It ended (1) at $13.19 low, (2) at $14.51 high, (3) at $11.48 low, (4) at $12.38 high & (5) as ((A)) at $10.18 low. Currently, it favors bounce in (A) of ((B)) as overlapping structure & expect some upside before pullback starts in (B). The pullback in (B) should remain above $10.18 low to bounce in (C) to finish ((B)) towards equal leg area. ((B)) should unfold in 3, 7 or 11 swings before lower in ((C)) as 5 swings down to finish II. We can project the exact area for ((C)), once it finished ((B)) connector, where it will find next support in weekly.

Source: https://elliottwave-forecast.com/stock-market/nu-holdings-favors-corrective-bounce-lower/
 

Elliottwave-Forecast

Master Trader
Feb 17, 2017
2,836
10
84
www.elliottwave-forecast.com
The Global X Uranium ETF (URA) is an investment vehicle aimed at tracking a market-cap-weighted index of companies in the uranium mining and nuclear components sector. URA has gained attention due to the resurgence in nuclear energy demand, particularly from tech and AI sectors, with its performance recently showing strong recovery and volatility, reaching near multi-year highs. The ETF includes major players like Cameco Corp, has a market cap of about $3.9 billion, and offers a dividend yield of around 6.07%, with technical indicators suggesting further potential growth.

$URA Elliott Wave Chart Monthly Chart​

Monthly chart of $URA above shows that the ETF has ended wave ((II)) Grand Super Cycle at 7.01. From there, the instrument is nesting higher in an impulsive structure. Up from 3.18.2020 low, wave I ended at 31.6 and pullback in wave II ended at 17.65. The ETF extended higher in wave ((1)) towards 33.66 and pullback in wave ((2)) ended at 22.79. Expect the ETF to extend higher while above 7.01 low.

$URA Daily Elliott Wave Chart​

Daily chart of $URA above shows that rally to 33.66 ended wave ((1)). Pullback in wave ((2)) unfolded as a zigzag structure. Down from wave ((1)), wave (A) ended at 28.56 and rally in wave (B) ended at 31.52. Wave (C) lower ended at 22.84 which completed wave ((2)) in higher degree. Up from there, wave (1) ended at 33.99 and wave (2) ended at 26.6. While above 22.84, expect the ETF to extend higher.

Source: https://elliottwave-forecast.com/stock-market/uranium-miners-etf-ura-looking-resume-higher/
 

Elliottwave-Forecast

Master Trader
Feb 17, 2017
2,836
10
84
www.elliottwave-forecast.com
NASDAQ E-Mini Futures (NQ) appears to be extending the bullish sequence from October 2022. Will the sequence finish soon and lead to a big sell-off across the US indices? While the sequence persists, where should traders eye the next opportunity?

The NQ chart is very clear. After the markets recovered from Covid in March/April 2020, a massive bullish cycle followed. This rally continued until November 2021 and was identified as wave (I). From November 2021, a sell-off began to correct the Covid recovery cycle. The sell-off ended in November 2022 and was identified as wave (II). Wave (III) then started in October 2022 and has continued to rise since. The bullish cycle from October 2022 has gained over 105% from its low and lasted nearly 28 months. Further analysis shows this rally as wave I of (III). Therefore, wave (III) still has a long way to go.

When such a bullish sequence emerges, we prefer buying pullbacks in 3, 7, or 11 swings from the blue box. These blue boxes are shown on the chart for Elliottwave-Forecast members. Within the bullish sequence from October 2022, there have been multiple pullbacks. Members have profited from these. The most recent pullback occurred on August 5, 2024. As shown on the 8.4.2024 chart below, we bought at the extreme of this pullback.


Price reached the blue box to conclude a 7-swing structure and then rallied from there. The 8.27.2024 chart below shows a later update we shared with members as we continue to provide update from this extreme area.


From the blue box, NQ gained about 29% until the recent pullback from December 2024 started. Again, pullbacks within a bullish sequence should be a perfect opportunity for buyers to go again. What are the likely scenarios buyers should look forward to, for the next perfect blue box opportunity? This post will provide two best buying scenarios for traders.

NQ Elliott Wave Analysis - 1st Scenario. 01.21.2025 Update

NQ Nasdaq

The NQ chart above shows that wave ((4)) of I ended on January 13, 2025, at 20,690. From this pullback low, wave ((5)) began to emerge. The price is now close to completing wave 1 of (1) of ((5)). A pullback for wave 2 should follow. The best entry was at the extreme of wave ((4)), but it was barely missed. The next opportunity will come after the price breaks above the December 2024 peak at 22,450 with wave 3. After this, buyers can wait for the next pullback. It could be for wave 4, wave ((ii)) of 3, or wave ((iv)) of 3 within the bullish sequence from January 13, 2025. This bullish setup depends on the price breaching the December 2024 high. But what if the price turns lower instead of breaking this high?

NQ Elliott Wave Analysis - 2nd Scenario. 01.21.2025 Update

NQ NASDAQ

If the price doesn’t breach 22,450 to confirm the first scenario, it could fall further for a deeper wave ((4)). As the chart above shows, wave ((4)) could develop into a larger 7-swing structure. Wave (W) ended on January 13, 2025, where the current bounce for wave (X) began. Wave (X) may extend to 22,044.07–22,250.96. If the price turns lower from this zone or below it, buyers can watch for the next extreme of wave ((4)) for a perfect long entry. However, if the bounce breaches 22,450, this scenario becomes invalid, and the first scenario becomes valid. In either case, we have prepared our members to act. The strategy is simple: just buy from the blue box!

Source: https://elliottwave-forecast.com/stock-market/nasdaq-nq-elliott-wave-two-scenarios/
 

Elliottwave-Forecast

Master Trader
Feb 17, 2017
2,836
10
84
www.elliottwave-forecast.com
Hello fellow traders. As many of you know, we've had many profitable trading setups recently, some of which we've shared in previous blogs and on StockTwits and Twitter. In this technical article, we're going to present something a bit different—an Elliott Wave setup that almost hit our entry point, missing it by just 0.67 points. We are going to talk about the XLY trading setup presented to members of ElliottWave-Forecast.

Recently, XLY experienced a 3-wave pullback, unfolding as an Elliott Wave Double Three pattern. We identified and shared the Blue Box – our buying zone – with our members, but unfortunately, the pullback ended just shy of our ideal entry.


XLY Elliott Wave 4 Hour Chart 01.12.2025​

The current view shows that XLY is forming a wave ((4)) black correction. The price action shows an incomplete 5-swing decline from the peak, suggesting there is still another leg down. This correction is likely unfolding as an Elliott Wave Double Three pattern. We expect an extension toward the 217.52-206.61 area, where we plan to re-enter as buyers.

We recommend members avoid selling XLY, as the main trend remains bullish. XLY should see at least a 3-wave bounce from this Blue Box area. Once the price touches the 50% Fibonacci level against the ((b)) black connector, we’ll make positions risk-free, set the stop loss at breakeven, and book partial profits. If the price breaks below the 1.618 Fibonacci extension level at 206.61, the trade will be invalid.

Official trading strategy on How to trade 3, 7, or 11 swing and equal leg is explained in details in Educational Video, available for members viewing inside the membership area.

90% of traders fail because they don’t understand market patterns. Are you in the top 10%? Test yourself with this advanced Elliott Wave Test

Quick reminder on how to trade our charts :

Red bearish stamp+ blue box = Selling Setup
Green bullish stamp+ blue box = Buying Setup
Charts with Black stamps are not tradable.

XLY

XLY Elliott Wave 1 Hour Chart 01.21.2025​

At the downgraded chart below, we can see that the pullback indeed formed a Double Three pattern. Unfortunately, the price ended the pullback as a truncation. Our entry area was 217.52, but the correction completed early at 218.19, missing our entry by just 0.67 points. As we always say, not every trading setup will work out perfectly. This is a regular part of trading and should be accepted. In such cases, we simply move on – there will always be plenty of good trading setups ahead. The current view suggests that the ETF is forming a 5-wave pattern from the 218.19 low. This is a crucial level to hold for the proposed view.

Reminder for members: Our chat rooms in the membership area are available 24 hours a day, providing expert insights on market trends and Elliott Wave analysis. Don’t hesitate to reach out with any questions about the market, Elliott Wave patterns, or technical analysis. We’re here to help.

XLY

Source: https://elliottwave-forecast.com/stock-market/xly-elliott-wave-rally-call/
 

Elliottwave-Forecast

Master Trader
Feb 17, 2017
2,836
10
84
www.elliottwave-forecast.com
Since our previous blog about Robinhood stock HOOD, the price tripled during a strong bullish upside move. Therefore, we’ll be looking at the daily Elliott Wave Structure and explain the current structure within the cycle.

The recent daily rally started in August 2024, HOOD established an impulsive 5 waves structure to the upside within wave III. In addition, it exceeded the 1.618 Fibonacci extension level $41 which confirmed the strong momentum within the 3rd wave. The current advance from 12/20/2024 low is proposed to be wave ((5)) of III as long as it's holding the divergence in RSI. Consequently, the stock will be looking for more upside to finish a series of 3rd & 4th waves toward $52 - $56 before ending that cycle.

HOOD still has the potential of opening more upside above if the structure turns out to be a nest. In that case, the current move will be wave ((3)) of III and it will reach equal legs area at $63 - $82. In conclusion, we don't recommend selling the stock as the overall structure for remains bullish and we only favor buying the daily pullbacks in 3 , 7 or 11 swings.

HOOD Daily Chart 1.22.2025​

HOOD Daily 1.22.2025

Source: https://elliottwave-forecast.com/stock-market/robinhood-hood-extension/
 

Elliottwave-Forecast

Master Trader
Feb 17, 2017
2,836
10
84
www.elliottwave-forecast.com
In this technical article we’re going to take a quick look at the Elliott Wave charts of Netflix Stock (NFLX) , published in members area of the website. As our members are aware, NFLX recently completed a correction against the 583.7 low. We saw a clear 3-wave pullback, wave (4), followed by the expected rally. In this post, we will explain the Elliott Wave count in detail.

NFLX H1 Weekend 01.19.2025​

The current view suggests that Netflix stock completed a 3-wave pullback from the peak to the low, labeled as wave (4) blue. A rally followed from this low, appearing impulsive. We have labeled this short-term cycle as wave ((i)) black, marking the start of a new bullish cycle. We expect Netflix stock to continue attracting intraday buyers in 3, 7, and 11 swings, as long as the price stays above ((ii)), and more importantly, above the (4) blue low of 823.5.

Reminder : You can learn more about Elliott Wave Patterns at our Free Elliott Wave Educational Web Page.

90% of traders fail because they don’t understand market patterns. Are you in the top 10%? Test yourself with this advanced Elliott Wave Test

NFLX

NFLX H1 Post-Market 01.21.2025​

Netflix held above the 823.5 low as expected and made a sharp rally toward new highs. The structure from the 823.5 low looks impulsive. We believe this rally is wave ((iii)) of 3, known among Elliott Wave practitioners as the strongest wave. At some point, we expect a 3-wave pullback in wave 4 (red), which should present new buying opportunities.

Reminder for members: Our chat rooms in the membership area are available 24 hours a day, providing expert insights on market trends and Elliott Wave analysis. Don’t hesitate to reach out with any questions about the market, Elliott Wave patterns, or technical analysis. We’re here to help.

NFLX

Source: https://elliottwave-forecast.com/stock-market/netflix-stock-nflx-elliott-wave/
 

Elliottwave-Forecast

Master Trader
Feb 17, 2017
2,836
10
84
www.elliottwave-forecast.com
Hello fellow traders! In this technical article, we’ll be discussing GOLD (XAUUSD) and sharing some charts that we’ve presented to the members of ElliottWave-Forecast.

As our members know, GOLD is showing higher high sequences in the cycle from the December 18th low, which suggests a further rally in the commodity. Recently, GOLD completed a 3-wave pullback and made another leg up, reaching our target area. In the following text, we’ll take a closer look at the Elliott Wave count and explain how to find targets for wave (v).

GOLD (XAUUSD) H1 Update 01.23.2025​

The commodity is forming a 5-wave pattern in the cycle from the 2656.3 low. We can already count 3 waves down, labeled as abc red. The current view suggests that as long as the price remains above the 2735.8 low, the (iv) blue pullback is considered complete. We believe (v) blue is now in progress, with the first target area projected at 2769.99–2708.55.

If you want to learn more about Elliott Wave Patterns, we invite you to explore our Free Elliott Wave Educational Web Page.

Reminder for members: Our chat rooms in the membership area are available 24 hours a day, providing expert insights on market trends and Elliott Wave analysis. Don’t hesitate to reach out with any questions about the market, Elliott Wave patterns, or technical analysis. We’re here to help.

XAUUSD

GOLD (XAUUSD) H1 Update 01.23.2025​

GOLD continued its rally as expected. Wave (v) reached the first target at 2769.99–2708.55, calculated using the inverse 1.236–1.618 Fibonacci extension of wave (iv). Another method to project the target for wave (v) is (v) = (i), which comes at 2804.4. We expect the cycle from the 2656.6 low to soon complete as a 5-wave structure ((i) )black and anticipate a pullback in ((ii)). However, we do not recommend selling against the primary bullish trend. Once the ((ii)) pullback begins, we expect it to reach around the 50–61.8 Fibonacci retracement area measured from the 2656.6 low.

Keep in mind market is dynamic and presented view could have changed in the mean time. You can check most recent charts in the membership area of the site. Best instruments to trade are those having incomplete bullish or bearish swings sequences.We put them in Sequence Report and best among them are shown in the Live Trading Room.

90% of traders fail because they don’t understand market patterns. Are you in the top 10%? Test yourself with this advanced Elliott Wave Test

XAUUSD

Source: https://elliottwave-forecast.com/commodities/elliott-wave-forecast-gold-xauusd-forming-5-waves/