Elliottwave-Forecast

Master Trader
Feb 17, 2017
2,867
10
84
www.elliottwave-forecast.com
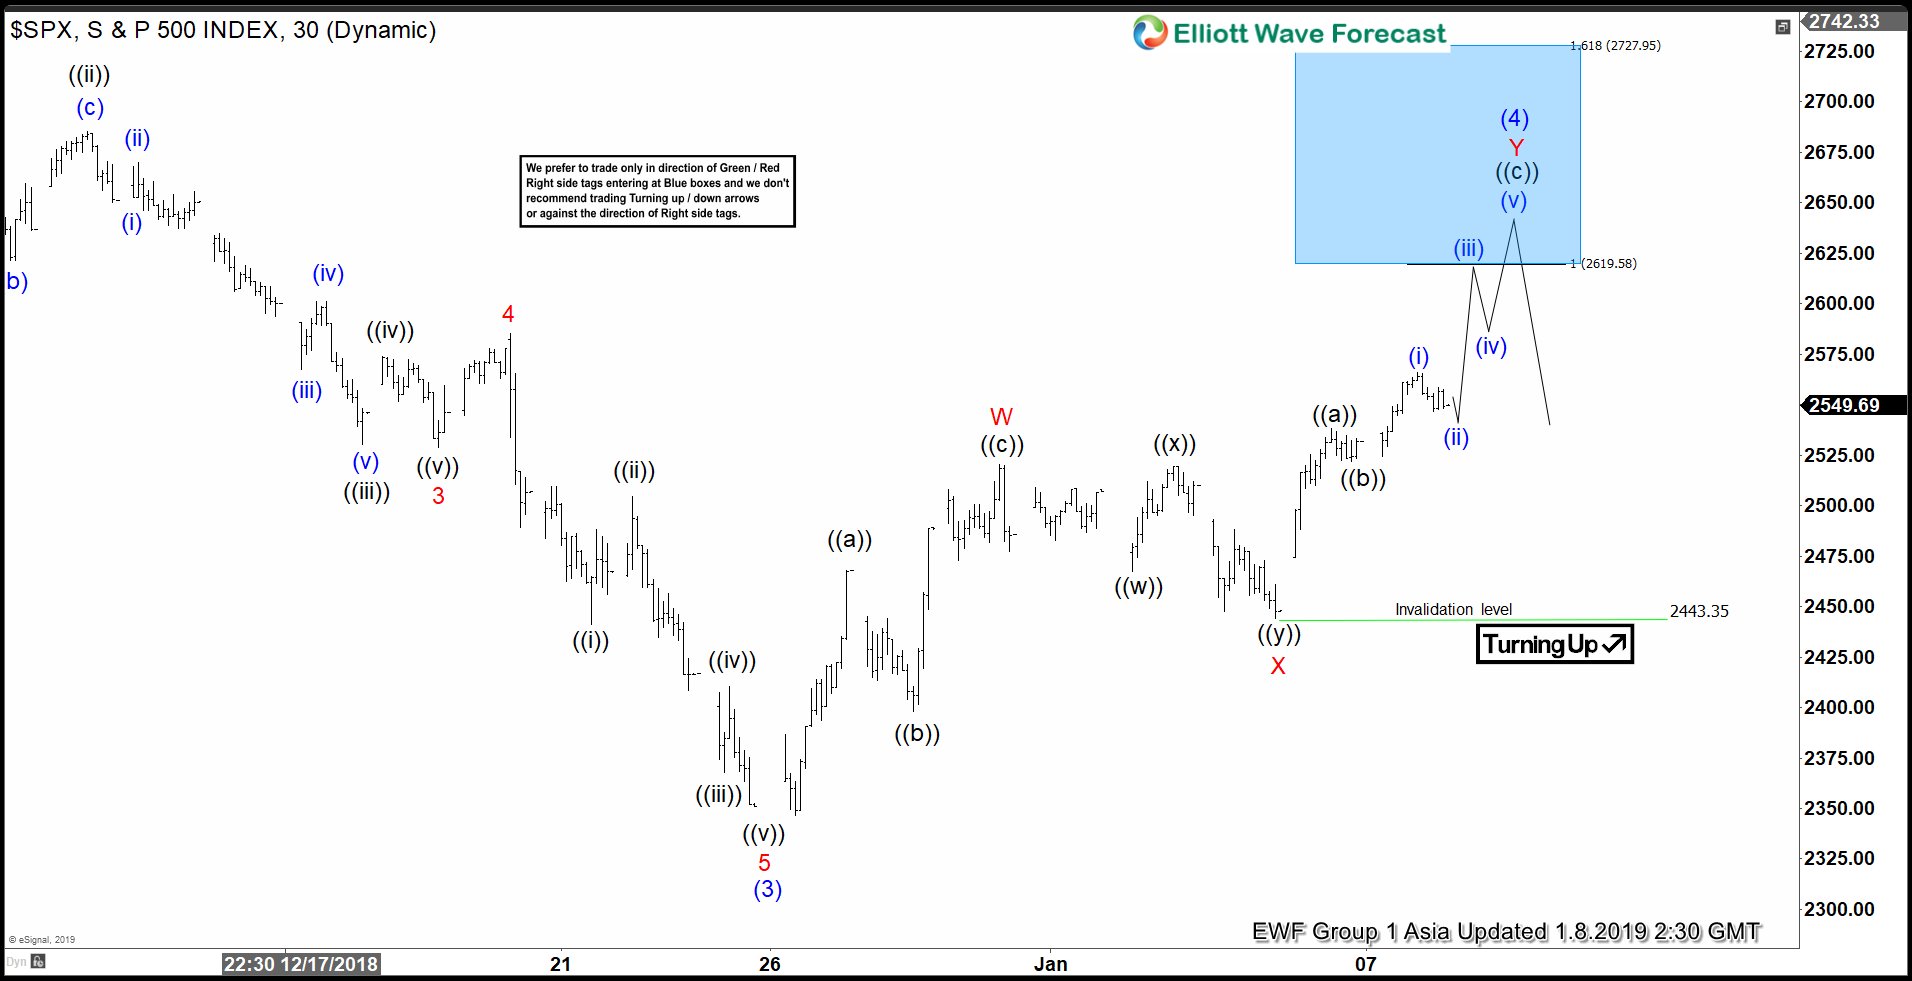
Short term Elliott Wave view in SPX suggests that the decline to 2346.58 ended wave (3). The Index is currently correcting in wave (4) as a double three Elliott Wave structure. Up from 2346.58, wave W ended at 2520.27, wave X ended at 2443.96, and wave Y remains in progress towards 2619.58 - 2727.95 area before Index resumes lower or pullback in 3 waves at least.

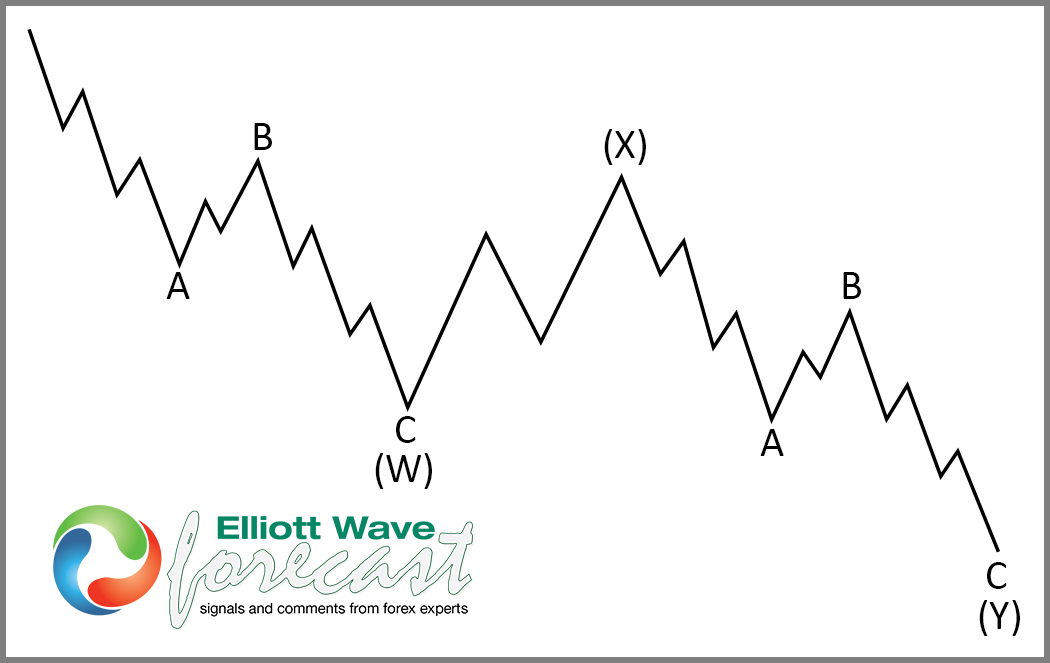
A double three Elliott Wave structure is a complex correction in which we have two Elliott Wave corrective structures together. In this case, wave W subdivides as a zigzag Elliott Wave structure where wave ((a)) ended at 2467.76, wave ((b)) ended at 2397.94, and wave ((c)) of W ended at 2520.27. Wave X subdivides as a double three of lesser degree where wave ((w)) ended at 2467.47, wave ((x)) ended at 2519.49, and wave ((y)) ended at 2443.96.

Wave Y is proposed to be unfolding as a zigzag where wave ((a)) ended at 2538.07, wave ((b)) ended at 2522.13, and wave ((c)) of Y is in progress towards 2619.58 - 2727.95 before ending the entire wave (4) correction. Expect sellers to appear once wave (4) correction is over at the blue box area for a 3 waves pullback at least.

SPX 1 Hour Asia Elliott Wave Chart


Elliottwave-Forecast

Master Trader
Feb 17, 2017
2,867
10
84
www.elliottwave-forecast.com
Short term Elliott Wave view in USDCAD shows that the decline from 12/31/2018 high (1.3669) is unfolding as a 5 waves impulse Elliott Wave structure. Down from 1.3669, Wave 1 ended at 1.3563, wave 2 ended at 1.3662, wave 3 ended at 1.3263, and wave 4 ended at 1.3323. We can see a momentum divergence with momentum showing a higher low while price showing a lower low.

This suggests that wave 5 is near complete and we can soon see a 3 waves rally to correct the decline from 12/31/2018 high. To get an estimate on how far the bounce can go, it should ideally end around 50 - 61.8% fibonacci retracement of the decline from 1.3669. This however is more of a guideline and not a rule. The actual rally can be deeper or shallower than the 50 - 61.8% retracement guide. The most important level remains to be 1.3669.

As the move lower from 1.3669 is impulsive, the bounce should fail below 1.3669 and give us at least another 5 waves down to end a zigzag Elliott Wave structure at minimum. The medium term outlook therefore favors further downside although short term we may see a bounce soon.

USDCAD 1 Hour Asia Elliott Wave Chart


Elliottwave-Forecast

Master Trader
Feb 17, 2017
2,867
10
84
www.elliottwave-forecast.com
Palladium reached a high of $1249.40 today, it is already up 53% since August 2018 but has now reached 100% Fibonacci extension from the all time low. It has also reached 100% Fibonacci extension up from 2003 low which means we have now entered the area where cycle from 2003 and all time low can end. However, it's a big area and runs from $1239.49 - $1915.08 but still buyers need to be cautious of profit taking in the blue box which can produce a pull back, therefore, chasing longs at current level is risky.

Palladium Cycle from 1996 and 2003 low


PA_F Elliott Wave Analysis since 2016 low
Elliott Wave Analysis suggests, rally from 2016 low to 2018 high unfolded as an Elliott wave zig-zag structure which is a 5-3-5 structure and completed wave "w". This was followed by a pull back which took the form of a double three Elliott wave structure and ended at $819. Back in June 2018, we highlighted this pull back as a buying opportunity in Palladium , pull back did find buyers as expected and we have already seen a new high above January 2018 peak and now we are at 0.618 - 0.764 Fibonacci extension area of red "w" and "x" cycles. This is the area where typically 1st leg of "y" leg ends in a double three Elliott wave structure. Area between $1244 - $1344.20 is expected to end the cycle from August 2018 low, produce a pull back in Palladium and then result in more upside toward $1503 - $1664 area to 7 swings Elliott wave sequence from 2016 low. As we are already at 100% Fibonacci extension from 1996 and 2003 lows, it's risky chasing longs in the short-term and our strategy would be to wait for wave (( X )) pull back to take place. After wave (( X )) pull back has materialised, we expect buyers to appear again and take prices higher toward $1503 - $1664 area.


Elliottwave-Forecast

Master Trader
Feb 17, 2017
2,867
10
84
www.elliottwave-forecast.com
USDJPY Technical Analysis January 8/2019

USDJPY remains bearish as long as the October 4/2018 high remains untouched. On the Daily chart there is a clear visible bearish pattern that can be seen. The blue bearish pattern triggers SELLS at the BC 0.50% Fib. retracement level. Price has still not reached this level so traders will need to be patient and see if USDJPY will touch this level and also watch to see if a downside reaction comes from this level. A possible price reaction lower can happen from the BC 0.50% Fib. retracement level or price can continue higher towards the purple trend line level where more bears can possibly be waiting to push USDJPY lower. Both the blue BC 0.50% Fib. retracement and the purple (support/resistance) trend line level are significant because there has been previous support/resistance price action in the past at these levels. Traders will need to wait and watch how price reacts at the possible reversal zone (blue box) and see if the market reacts lower to the bearish pattern or at the purple support/resistance level. If looking to trade USDJPY stops should be placed at the October 4/2018 blue point B high of the blue bearish pattern looking for another move lower to extend below the January 3/2019 lows. Only time will tell what the pair will do but at least now you are aware of the possible area where USDJPY can reverse lower from.

USDJPY Daily Chart 1.8.2019


*** Always use proper risk/money management according to your account size ***

At Elliottwave-Forecast we cover 76 instruments (Forex, Commodities, Indices, Stocks and ETFs) in 4 different timeframes and we offer 5 Live Session Webinars everyday. We do Daily Technical Videos, Elliott Wave Trade Setup Videos and we have a 24 Chat Room. Our clients are always in the loop for the next market move.
 

Elliottwave-Forecast

Master Trader
Feb 17, 2017
2,867
10
84
www.elliottwave-forecast.com
Oil’s (CL_F) short term Elliott Wave view shows that the decline from 10/3/2018 high ended as 5 waves impulse in wave a at $42.41. The cycle from 10/3/2018 high has ended and Oil should now see at least a 3 waves rally. The rally from $42.41 is unfolding as Elliott Wave zigzag structure where wave ((A)) is currently in progress.

An internal of a zigzag is 5-3-5, which means that wave ((A)) should subdivide in 5 waves impulse Elliott Wave structure. Up from $42.41, wave (1) ended at $47, wave (2) ended at $44.35, and wave (3) ended at $52.58. Expect a pullback in wave (4) which ideally ends at 23.6 – 38.2 Fibonacci Retracement of wave (3) at $49.4 – $50.62. Oil should then rally 1 more leg higher in wave (5) to end 5 waves up and complete wave ((A)). After wave ((A)) is complete, it should pullback in wave ((B)) to correct rally from 12/25/2018 low ($42.41) in 3, 7, or 11 swing before the rally resumes again in wave ((C)).

Oil 1 Hour Asia Elliott Wave Chart
 

Elliottwave-Forecast

Master Trader
Feb 17, 2017
2,867
10
84
www.elliottwave-forecast.com
IYF Flat from the January 29, 2018 highs

The iShares US Financials ETF, symbol IYF appears to be a flat correction lower from the January 29, 2018 highs. It has been persistent and strong enough to suggest it is correcting the bullish cycle up from the February 11, 2016 lows. At this point in time the Elliott Wave structure remains incomplete and it is still missing one more swing low.

Firstly I will elaborate about what a flat wave structure should look like. Flat structures subdivide into three larger swings with the whole structure in what is called a 3-3-5. Basically the first two swings will subdivide into a three wave move with the final wave subdividing into five waves. Those five waves may or not be overlapping as in a diagonal impulse wave however it should still end by giving five clear swings. The fifth wave usually will end with some momentum indicator divergence when comparing the fifth wave with the third wave.

The analysis continues below the chart.

IYF Daily Chart


Secondly I would like to mention what will keep the flat structure analysis as remaining valid. The current wave four is already a bit higher than I would typically like to see. I am referring to the Fibonacci retracement. It has seen the 109.14 area today which is a little past the .382 Fibonacci retracement which is a typical area. The wave four bounce of course is correcting the cycle from the December 3rd, 2018 highs. During the wave four bounce, the momentum indicators should continue to give a weaker reading when compared to the wave two highs.

In conclusion. The target area line on the chart is where the wave five would equal the wave one if the wave four ended at 109.14. It is very possible the wave four overlaps the wave lows of wave one before turning lower again. In case that happens the target area for the fifth wave will be above what is shown there at 93.57. Either way the flat structure should see another low before the instrument turns higher.

Kind regards & good luck trading.

Lewis Jones of the ElliottWave-Forecast Team
 

Elliottwave-Forecast

Master Trader
Feb 17, 2017
2,867
10
84
www.elliottwave-forecast.com
GBPNZD Technical Analysis January 8/2019

Bullish market patterns can be seen on the GBPNZD 4 hour chart. In the chart below there are possible bullish patterns that can trigger BUYS if the market makes another move lower. The green bullish AB=CD pattern triggers BUYS at the Fib. extension 1.0% level and the blue bullish pattern triggers BUYS at the BC 0.50% Fib. retracement level. Traders should watch these levels for a possible reaction bounce higher because there has been previous support/resistance price action in the past. First support/resistance level can be seen at the blue trend line where the blue bullish pattern triggers BUYS at the BC 0.50% Fib. retracement level. GBPNZD can also dip lower towards the purple second support/resistance level where we could expect more buyers waiting to push the pair higher. Traders will need to wait and watch if the pair makes another dip lower and also see how price reacts at the possible support zone (blue box) where GBPNZD bulls will be waiting. If looking to trade GBPNZD stops should be placed at the point B low of the blue bullish pattern looking for a rally higher to extend above the December 31/2018 highs. Only time will tell what GBPNZD will do but at least now you are aware of the possible area where the pair can bounce from.

GBPNZD 4 Hour Chart 1.8.2019


Of course, like any strategy/technique, there will be times when the strategy/technique fails so proper money/risk management should always be used on every trade. Hope you enjoyed this article.

*** Always use proper risk/money management according to your account size ***
 

Elliottwave-Forecast

Master Trader
Feb 17, 2017
2,867
10
84
www.elliottwave-forecast.com
Gold has been used as the currency of choice throughout history, despite what the central banks of the world say. Ben Bernanke, then the Fed Chairman, famously said that Gold is not money in 2011 during congressional hearing with Senator Ron Paul.

Since President Nixon removed Gold's peg from the US Dollar in 1971, the world has officially came off the yellow metal's standard. This new fiat system is backed only by faith in the government who issue it. Once the gold standard was dropped, countries began printing more of their own currency. Today, the world has a cumulative total debt of $250 trillion as of the first quarter of 2018.


The world's debt has continued to accelerate in the last decade due to central banks manipulating interest rate and making it so cheap. As central banks start to tighten last year, it is no longer cheap to accumulate debt. As a natural consequence of the ever expanding debt, the world's fiat currency will continue to devalue. A weaker currency makes it easier to pay off debts. For example, if the U.S. dollar's value falls in half, Americans will owe only 50% of the debt's value.

Indeed the yellow metal has continued to ascend against various world's fiat currency. Or more accurately, it is the currency against which Gold is measured that loses their value. Many people only look at Gold in terms of U.S. Dollar and conclude that Gold has been in the bear market in the past 7 years. However, when we look at other markets, we can see the yellow metal has been performing very strongly. For example, Gold has made a new all-time high against emerging market currencies. These include currencies like Turkish Lira, Russian Ruble, Indonesian Rupiah, South African Rand, Brazilian Real, and the Mexican Peso. Investors in these countries do not switch to more stable currencies like the Euro or the U.S. Dollar. Instead, they are moving to hard currency like Gold.

And it's not just against the emerging market currencies. This year, Gold has broken to new all time high against Australian Dollar as below's chart shows:

XAUAUD Gold In Australian Dollar Weekly Chart


The yellow metal in Australian Dollar terms has broken to new all time high above 22 Aug 2011 high, which now makes it bullish against 15 Dec 2016 low (1534.8) in the first degree. Rally from there is also showing a 5 swing up, favoring further upside while dips stay above 1534.8.

The yellow metal also almost makes all-time high against Canadian Dollar. It is only CAD$47 away from the all-time high in Canadian dollar's term. Thus, major developed economies currencies have started to fall in value against the yellow metal in 2019. Gold against the Japanese Yen also looks like a multi-year Elliott Wave symmetrical triangle which likely break out to the upside like chart below shows:

XAUJPY Gold in Japanese Yen Weekly Chart


A separate cycle analysis on USD cycle we did last year remains valid. The analysis seems to suggest that USD has made important high in year 2017 and can be due for multi-year decline like the chart below shows:

US Dollar Time Cycle Analysis


With the Fed close to ending the current rate hike cycle while other central banks like the ECB catches up, USD may finally start to weaken this year. When this happens, Gold (XAUUSD) can finally catch up higher. The key level for the yellow metal remains to be 12 Feb 2018 high at $1361 as chart below shows. A break above there can take us to $1700 as the next swing target

XAUUSD Gold in U.S. Dollar Weekly Chart


The structure of weekly Gold above is a multi year rounded bottom (inverse head and shoulder) with a neckline at $1361. A break above the neckline at $1361 suggests a move higher to $1700, which is the same distance from the head to the neckline.

Keep in mind that market is dynamic and price action may have changed since the writing time of the article.
 

Elliottwave-Forecast

Master Trader
Feb 17, 2017
2,867
10
84
www.elliottwave-forecast.com
Cleveland Cliffs (NYSE:CLF) is an American mining company that specializes in Iron Ore. With the demand for construction steel soaring around the world and specially in China, the price of Iron Ore continues to rise which makes big miners such as CLF, BHP, Rio Tinto and Vale a major beneficiaries thanks to the high-grades of the ore in their mines.

Since 2016, CLF made few attempts to close the year above $10 handle and it failed every time despite reaching $12 - $13 area. Will 2019 be any different from the previous 3 years ?

Looking at the weekly chart, we can count 5 swings to the upside which ended around the 61.8 fib ext area $12.44 - $14.07 and produced the 6th swing correction during last year. We consider it as an incomplete bullish sequence as long as the pivot at $5.56 low remains intact. We use our proprietary pivot system to tell us when a cycle has ended and when we need to switch to a different degree. Therefore, as both price and pivot are holding $5.56 then the sequence is suggesting a bullish path toward 100% fib ext area $16.70 - $19.34.

Cleveland Cliffs Weekly Chart


CLF is already up 10% this month after ending the 6th swing pullback which started from September 2018 peak. The decline happened as a corrective Elliott wave double three structure which found buyers at the blue box 100% fib ext area $76.4 - $6.78. The blue boxes in our charts are the High-frequency areas where the Markets are likely to end cycles and make a turn. Consequently, Cleveland Cliffs is looking to either resume the rally higher to break 2018 peak or at least bounce in 3 waves toward 50% area $10 - $11.

Cleveland Cliffs 4H Chart
 

Elliottwave-Forecast

Master Trader
Feb 17, 2017
2,867
10
84
www.elliottwave-forecast.com
Australian Dollar has seen a surge in volatility at start of the year which started with a sharp decline followed by a quick recovery and AUDCAD is no different. Traders know that volatility brings along trading opportunities so we take a look at the Swing Sequence and Elliott Wave Forecast of AUDCAD forex pair to highlight the next high probability trading area.

AUDCAD Elliott Wave Swing Sequence from 2012 peak
Chart below shows Elliott wave swing sequence down from 2.2012 peak. Numbers on the chart represent swings and not waves. Currently we can see 5 swings down from 2.2012 peak when 1st swing ended at 0.9175, 2nd swing ended at 1.0349, 3rd swing ended at 0.9151, 4th swing ended at 1.039 and 5th swing ended at 0.9105, 6th swing is proposed to be still in progress and is expected to stay below 4th swing high (1.039) and below the descending trend line (currently at 1.0165) for another swing lower to complete 7 swings Elliott wave sequence between 0.8739 - 0.7711.


AUDCAD Daily Chart Highlights High Probability Trading Area
AUDCAD daily chart below shows the Elliott Wave structure of the decline from 2016 peak (1.0410). Decline from 1.0410 unfolded in 7 swings and since then pair is proposed to be in a bounce to correct the decline from 1.0410 peak. While above 1/3/2019 (0.9154) low, expect the pair to continue higher toward 0.9826 - 1.0242 area to complete wave ((X)) from where it can resume the decline for new lows toward 0.8739 area or pull back in 3 waves at least to allow sellers to get into a risk free position. As there is no bullish sequence so we don't like the buying and expect sellers to appear in 0.9826 - 1.0242 area to push prices lower.


Elliottwave-Forecast

Master Trader
Feb 17, 2017
2,867
10
84
www.elliottwave-forecast.com
EURCAD Technical Analysis January 14/2019

Bearish market patterns can be seen on the EURCAD 4 hour chart. In the chart below there are possible bearish patterns that can trigger SELLS if the market makes another move higher. The blue bearish pattern triggers SELLS at the BC 0.50% Fib. retracement level and the purple bearish pattern also trigger SELLS nearby at the XA 1.618% Fib. retracement level. Traders should watch these levels for a possible reaction lower because there has been previous support price action in the past at these levels. EURCAD showed strong support in the past at the blue BC 0.50% level which should now play as strong resistance if price can reach back up there. EURCAD can also rally a bit higher towards the purple XA 1.618% Fib. retracement level where the pair will encounter more selling pressure from traders reacting to the purple bearish pattern. Traders will need to wait and watch if the pair makes another push higher and also see how price reacts at the possible resistance zone (blue box) where EURCAD bears can be waiting to take back control. If looking to trade EURCAD stops should be placed at the point B high of the blue bullish pattern and traders should be patient and wait for price to make a move higher to the possible resistance zone (blue box) looking for a move lower to extend below the January 9/2019 lows which will hit the target levels (green). Waiting to SELL/SHORT at the minimum BC 0.50% Fib. retracement level (blue) will offer a better risk/reward trade setup. If price continues lower and breaks below the blue AB 2.24% Fib. retracement level before touching the minimum BC 0.50% Fib. retracement level then the sell trade setup is cancelled. Only time will tell what EURCAD will do but at least now you are aware of the possible area where the pair can reverse lower from.

EURCAD 4 Hour Chart 1.14.2019


Of course, like any strategy/technique, there will be times when the strategy/technique fails so proper money/risk management should always be used on every trade. Hope you enjoyed this article.
 

Elliottwave-Forecast

Master Trader
Feb 17, 2017
2,867
10
84
www.elliottwave-forecast.com
The World Indices have seen the biggest decline since the lows at 2009. However, despite the size of the decline, it does not affect the overall trend. We at Elliott Wave Forecast always say that knowing the cycles and Market sequences are the key to become a successful trader. Many people believe the Market works in a straight line and of course that is not the case.

We track most of World Indices and over 100 instrument across the World. In addition to analyzing using Elliott Wave technique, we also correlate them to get the edge of the Market. The following chart shows FTSE ($UKX-FTSE) Elliott Wave Grand Super cycle since the all time low. We can see how we have not reached the 100% Blue Box at 10296.34 - 11913.27 which will be a moment when 2 Super cycle degree will reach equal length in price. The first super cycle degree goes from all-time low to 1999, whereas the other one started at 2009.

This suggests that until these two cycles reach 100%, we should keep buying the World Indices. We look at other instrument within the Indices group to discover the next entry levels and the best timing. The $UKX-FTSE chart is showing the Monthly path and it shows an incomplete sequence price wise in red. In addition, it also shows 5 swing incomplete sequence in black from 2009 low which is also a bullish event. The combination of both bullish sequences from two degrees suggest that the Index will likely remain above the 2009 low.

This also means that the Index will continue higher when swing 6 black or swing 2 Blue ends. As we are saying to members, this decline in World Indices is another chance to buy stocks and Indices at very good levels. As always, the social media's bias of a big market crash will again become another trap. Nothing big will happen at minimum
until year 2020-2022 and it can even pass those times. Until then, keep buying the dips in World Indices in 3-7-11, The ruling trend is still higher.

FTSE Elliott Wave Sequence Monthly Chart


Elliottwave-Forecast

Master Trader
Feb 17, 2017
2,867
10
84
www.elliottwave-forecast.com
Say what you want about Brexit news or president Trump news, we only care about the chart! Our analysis and decisions do NOT depend on news but solely on what we refer to "the right side of the market". Traders, today we will look at a couple of GBPUSD charts. The following analysis will show you no matter how choppy the market is, how efficient it can be to trade with our rules.

First of all, we start with GBPUSD’s 4 hour chart from December 29th 2018 presented to our members. At the time, the pair held an incomplete bearish sequence due to the broken low of August 15. When that happened, we confirmed a same degree 3 swing move, ((A))-((B))-((C)), to the downside. This also meant, a clear 5 wave move within wave ((C)). Moreover this scenario gave us the possibility to map an "equal leg" target area of 1.12568-1.2424 . From there, a significant reaction was to be expected correcting the full 3 swing sequence down.

Our count at the time suggested an ending diagonal with a 5th leg still missing, hence our aggressive bearish stance. Notice our red "right side" arrow and of course our "bearish sequence stamp". Given these signals, our approach unquestionably encourages our members to trade with the right side. So, some members were looking to sell the bounce of the expected wave (4) in 3,7, or 11 swings.

GBPUSD 12.29.2018 4 Hour Chart Elliott Wave Analysis


Below you can see an updated chart of the pair from January 16 2009. Notice how the pair came back for a lower low for wave 5 (previously label "(5)"), and bounced out of the previously defined target area within minutes! Certainly, the best type of reaction to start the correction of October highs.

A mapped entry, an invalidation level set up, sequences, and "the right side" add up to great trading opportunities. Above all, being on "the right side" of the market proves once again to be successful preventing us from taking a bullish perspective at the wrong time.

GBPUSD 01.16.2019 4 Hour Chart Elliott Wave Analysis
*Note : Keep in mind the market is dynamic and the presented view might have changed after the post was published.


Elliottwave-Forecast

Master Trader
Feb 17, 2017
2,867
10
84
www.elliottwave-forecast.com
In this technical blog, we are going to cover past performance as well as some recent 1 hour Elliott Wave Charts of Copper, that we presented to our clients. We are going to explain the structure and the forecast below.

Copper 1 Hour Elliott Wave Chart From 12/29/2018


Above is the 1 Hour Chart from 12/29/2018 Weekend update, in which the decline from 12/03/2018 peak ($2.856) was expected to take place in 5 wave impulse structure within Minor wave C lower. Also, the sub-division from 12/03 peak in lesser degree decline unfolded in 5 waves impulse structure i.e Minute wave ((i)) & ((iii)). Which favored more downside for another extension lower in lesser degree Minute wave ((v)) against $2.8038 peak, while Minute wave ((iv)) being called completed at $2.726 peak as a Flat structure.

Copper 1 Hour Elliott Wave Chart From 1/03/2019


Copper 1 Hour Elliott Wave Chart from 1/3/2019 London update, the metal failed to new lows in Minute wave ((v)) as expected. Looking to reach $2.5709-$2.5463 100%-123.6% Fibonacci extension area of Minute wave ((i))=((v)) target blue box area before it ends the Minor wave C as well as intermediate wave (W) lower & bigger 3 wave bounce develops.

Copper 1 Hour Elliott Wave Chart From 1/08/2019


Copper 1 Hour Elliott Wave Chart from 1/8/2019 NY update, metal made the last push lower as expected & started bounce higher from the aforementioned blue box area as expected. Please note that we adjusted the count slightly to double three instead of a Zigzag based on our distribution & correlation system. Now coming back to the chart, the metal placed the low at $2.5439 & continued the bounce higher as zigzag structure.

Copper 1 Hour Elliott Wave Chart From 1/15/2019

Copper 1 Hour Elliott Wave Chart from 1/15/2019 London update, in which the metal ended the first leg of a bounce in lesser degree 5 waves structure within Minor wave A at $2.686 high. Down from there, Minor wave B is proposed complete at $2.616 low. While dips remain above there and more importantly expect Copper to extend higher in Minor wave C towards $2.759-$2.848 100%-161.8% Fibonacci extension area of Minor A-B before next selling opportunity appears looking for 3 wave reaction lower at least.

Keep in mind that the market is dynamic and the view could change in the meantime. Success in trading requires proper risk and money management as well as an understanding of Elliott Wave theory, cycle analysis, and correlation. We have developed a very good trading strategy that defines the entry. Stop loss and take profit levels with high accuracy and allows you to take a risk-free position, shortly after taking it by protecting your wallet.
 

Elliottwave-Forecast

Master Trader
Feb 17, 2017
2,867
10
84
www.elliottwave-forecast.com
Chesapeake Energy Corp’s (NYSE: CHK) most recent price action suggests the stock may be poised for a comeback in 2019. Beaten down to prices not seen since 2016 CHK is now tracing out what appears to be an impulsive five swing Elliott wave sequence from $1.71. Elliott wave hedging strategies used by us here at EWF suggests there will be more upside.

CHK 1HR CHART From $1.71 Low

main-qimg-1db9730954d5b0a6cd4adcc4ccb47b2e

The basics for Elliott wave analysis state that an initial five wave move solidifies a trend. The Elliott Wave Principle also suggests another five wave move in the same direction after a 3 wave countertrend completes. This staple of the Elliott Wave Principle is true no matter if CHK bottomed at $1.71 or if it is merely experiencing a bounce higher in a bear market. So the Elliott wave hedge for CHK suggests that after a corrective 3 wave move lower another five wave move higher will ensue minimal even if the coming impulsive five wave move higher is part of a corrective zigzag (5-3-5) pattern.

The Basic Elliott Wave Progression

main-qimg-8a105d1482b1ddadbdccd8bfba6c3770

Impulsive and Corrective Elliott Wave Sequences. CHK is finishing wave (1) or wave (A)

Certainly nobody knows exactly how the price action will play out. Elliott wave analysis can give you multiple views since the overall count is subjective to the observer. Even though multiple views are possible within the guidelines on Elliott analysis there are times when these differences produce conclusion for price to move in the same direction for an actionable move. This is an Elliott wave hedge.

As you can see in the chart of CHK above we have the first 5 waves labeled ending wave (A). We very well could be ending a wave (1) instead. Looking at the chart directly above you can see that regardless if its an (A) or a (1) there will be a three wave move in the opposing direction. It is at the end of this three wave countertrend move that both actionary waves continue in the direction of the prior actionary wave. In the case of this stock the next actionary wave after three waves back lower are complete is higher regardless if its a wave (C) which is minimal or wave (3) which is much more bullish.

To Your Success!
 

Elliottwave-Forecast

Master Trader
Feb 17, 2017
2,867
10
84
www.elliottwave-forecast.com
Hello fellow traders. In this technical blog we’re going to take a quick look at the Elliott Wave charts of GBPJPY, published in members area of the website. As our members know, the pair had incomplete bearish sequence in the cycle from the January 28th peak. The Elliott wave structure had been calling for further weakness. Consequently, we advised members to avoid buying the pair and keep on favouring the short side, selling the rallies in the sequences of 3,7,or 11 swings whenever opportunity presented itself. In further text we’re going to explain how we called the pair lower and look at the Elliott wave structure.

GBPJPY Daily Elliott Wave Analysis 12.29.2018
Break of August 15th low made the cycle from the January peak incomplete to the downside. The pair is now bearish against the 149.7 peak and we're calling for further decline. As we can see on the chart below , the pair is seating at the 0.618 Fibonacci extension , making sideways consolidation. The pair has scope to reach 133.34-129.41 area before buyers apear again for 3 wave bounce at least. We don’t recommend buying it against the main bearish trend and favour the short side as far as 149.7 pivot holds.


Now, let's see what short term structure looked like back then.

GBPJPY 1 Hour Elliott Wave Analysis 12.31.2018
Decline looks impulsive and we are calling short term recovery completed at 140.98 high as wave ((iv)). Now, as far as the price stays below mentioned level we expect the pair to trade lower, however need to see new short term low ( break below wave ((iii)) low) in order to confirm wave ((v)) is in progress. We don't recommend buying the pair, and favor the short side. We like selling the rallies in 3,7,11 swings when get chance.


Eventually we got the proposed decline and target has been reached at 133.34- 129.41 . Buyers have appeared at the extreme zone as expected and we are getting rally. Cycle from the January peak is counted completed. You can check most recent charts in the membership area of the site.

Note : Some labelings have been removed from the chart in order to protectKeep in mind market is dynamic and presented view could have changed in the mean time. Best instruments to trade are those having incomplete bullish or bearish swings sequences. We put them in Sequence Report and best among them are shown in the Live Trading Room.
 

Elliottwave-Forecast

Master Trader
Feb 17, 2017
2,867
10
84
www.elliottwave-forecast.com
In this blog, I want to share with you some Elliott Wave charts of Oil which we presented to our members at Elliott Wave Forecast. You see the 1-hour updated chart presented to our clients on the 01/10/19.

Oil ended the cycle from 10/03/18 peak in red wave a at 12/26/18 low (42.41). Above from there, we expect a bigger bounce to occur in 3-7 or 11 swings. From 12/26/18 low (42.41) the commodity unfolded as a 5 waves Elliott Wave impulse structure.

From 42.41 low it ended blue wave (1) at 47.05 peak. Below from there, blue wave (2) pullback ended at around 44.35 low. Above from there, Oil futures rallied quite aggressively to the upside in blue wave (3) and ended that move higher at 52.61 peak. The internals of blue wave (3) also unfolded as a 5 waves impulse structure. After ending blue wave (3) we expected a pullback to occur in wave (4) followed by the last push higher into the 53.86 blue box area to end wave (5) of black wave ((A)). Afterwards, we expected a pullback in the sequences of 3-7 or 11 swings to correct the cycle from 12/26/18 low.

Oil Futures 01.10.2019 1 Hour Chart Elliott Wave Analysis


In the Elliott Wave chart update below, you can see that blue wave (4) pullback ended at around 51.36 low. Above from there, it made the expected push higher in blue wave (5) to around 53.38. This move also completed the 5th wave of black wave ((A)). Below from that blue box oil is in the process of correcting the cycle from 12/26/18 low in black wave ((B)) in 7 or 11 swings before more upside should be seen ideally. As long as the pivot at 42.41 stays intact, we expect the commodity to extend higher to continue to correct the cycle from 10/01/18 peak. Please keep in mind that the 1-hour charts which I presented can have changed already. This blog should just illustrate how accurate our blue boxes are, and how our members can make use of our 3-7 or 11 swings strategy.


Oil Futures 01.14.2019 1 Hour Chart Elliott Wave Analysis


I hope you liked this blog and I wish you all good trades.
 

Elliottwave-Forecast

Master Trader
Feb 17, 2017
2,867
10
84
www.elliottwave-forecast.com
CGC Canopy Growth Corporation Wave Analysis

Firstly I would like to mention the Canopy Growth Corporation stock began trading on the NYSE last year due to legal reasons. That said I am not going to talk about any fundamentals or financials of the stock. I do think the stock is bullish although this view I present is purely technical. It would offer a reasonable entry area if it works out as the data is suggesting thus far. There is data readily available back toward 2014 that suggests share price was pretty close to penny stock territory.

Secondly from the aforementioned all time lows the cycle higher from there ended on 10/16/2018. From there the cycle lower into the 10/30/2018 lows looks like a five wave Elliott Wave impulse. Furthermore it was strong enough to suggest it was correcting the all time cycle higher. Then from the 10/30/2018 lows the stock bounced into the 11/7/2018 red wave A highs which was a three swing move. At that point there was a possibility that was all of the connector wave that would separate two impulse waves as you would see in a ziz zag Elliott Wave correction. Looking from the 11/7/2018 high into the 12/24/2018 lows appears to be a three swing move as was the previous wave A cycle. It was also short of the area equal legs to 123.6 Fibonacci extension area. This area is highlighted on the lower right part of the chart.

The analysis continues below the chart.

CGC Daily Chart


Thirdly the bounce from the 12/24/2018 lows appears to be a five wave impulse so far however I think it is incomplete. The dip from the high on 1/15/2019 is already deep enough for a typical wave four. Anything from the highs on sideways to lower on down to just above the 36.50 area could be seen. It should see another marginal high to complete five waves up from the 12/24/2018 lows before a turn back lower.

In conclusion. The bounce from the 12/24/2018 lows so far exhibits all qualities of an impulse in the red C. The two previous cycles in the red A & B were three swing moves being followed by an impulse. This suggests the blue wave (B) connector as a whole is a 3-3-5 flat structure. In turn if this is the case the stock should see another leg lower like the blue wave (A) once the blue wave (C) happens. Presuming the blue wave (B) ends near this 11/7/2018 high; The target area on the lower right part of the chart can provide a good long opportunity.

Kind regards & good luck trading.

Lewis Jones
 

Elliottwave-Forecast

Master Trader
Feb 17, 2017
2,867
10
84
www.elliottwave-forecast.com
APHRIA is a Canadian cannabis company (TSX:OTC:APHA) and in November 2018 it was listed in New York Stock Exchange. The company is as a leader in the production of pharmaceutical-grade cannabis and also produces a range of marijuana and cannabis oil products.

In 2018, Aphria stock took a big hit with a 75% decline as world stock market struggled during the whole year with majority of stocks correcting multi-year cycles. However, with every correction it comes a new investing opportunity and APHA has a clear technical structure providing a clear path.

APHA decline from 2018 peak is in 3 waves ( abc ) which represent an Elliott Wave corrective structure called Zigzag. The measured target for wave c is at 100% – 123.6% Fibonacci extension area $4 – $0.96 which the stock already reached. Therefore, a final leg lower may or may not happen at this stage to end the entire correction before the stock either start a new bullish cycle or bounce in 3 waves at least.

Aphria APHA Weekly Chart

The blue boxes in the above chart is a High-frequency area where Market are likely to end cycles and make a turn. Consequently, it can be used to take position in favor of the main trend which is in the case of Aphria to the upside as the previous cycle was an impulsive 5 waves advance. 2019 can be a good year for Marijuana stocks at least for a recovery against 2018 decline.
 

Elliottwave-Forecast

Master Trader
Feb 17, 2017
2,867
10
84
www.elliottwave-forecast.com
The Elliott Wave Theory is based on the idea that the market advances in 5 waves and pullback in 3 waves. The idea has become very famous and millions of traders around the world practice it. We at Elliott Wave Forecast have been introducing new ideas to make the theory better. We developed a system in which we look at the market in corrective sequences of 3-7-11. These numbers in turn also have 3-7-11 in each sub sequence. Thus, we have a full corrective sequence of 3-7-11-15-19-23 … into the infinity. Let’s take a look at XOM (Exxon Mobil ) chart which shows a clear 5 waves or swings advance since the all-time low.

Exxon Mobil ($XOM) Quarterly Elliott Wave Chart


We want to make it clear that when we say 5 waves, they normally refer to the Elliott Wave 5 waves impulse / diagonal structure. However, when we say 5 swings, this can be part of a 7 swing corrective sequence (WXY). $XOM looks to rally in 5 waves (impulse) from all-time low. However, what’s interesting is that soon the stock will reach an area in which 7 swings can be complete. This area is the blue box area and it can provide an opportunity for a nice bounce or another 5 waves higher. The chart below shows 2 sequences; the lower degree in blue color and higher degree in black color. In the blue (lower) degree we will get 7 swings and in the black (higher) degree, we will see 3 swings.

Exxon Mobil ($XOM) Weekly Sequence Chart


Understanding how we trade is simple. There is a right side which in this case is the long side. The reason is because of the 5 waves advance since all time lows. Traders should buy pullback in the sequence of 3, 7, or 11 swing. We need to understand that nobody knows for sure how deep the pullback is and when the trend will renew. Consequently, understanding how corrective pullback forms in 3-7-11 sequences is the key. The chart below shows a double three Elliott Wave structure (WXY) which is by definition a 7 swing. The structure in a simple way is the combination of 2 sets of ABC connected by a 3 waves structure.


The structure very often appears across the Market and it presents a chance to buy/sell with the trend. Our ideas about sequences and cycles allow us to get the perfect timing of the Market. Most of the time the WXY ends when the W=Y related to X. With Exxon Mobil, that area will be around $57.37-33.59. Any long term buyer should buy the stock in that area.

We do understand it is a big area, but that area is a warning for sellers. The first chart above represents a 5 waves advance and the WXY correction into the proposed blue box area. As we always said, knowing the market nature is key to be professional traders. Understanding the sequences will help you get better results. The sequences in XOM is very clear and buyers will have their chance soon.