J.J. Edwards’ Market Analysis at FenzoFx

fxnews.me

Active Trader
Dec 26, 2023
189
0
32
44

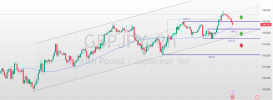
GBPJPY Bulls Eye 200.0 Amid Pullback​

GBPJPY_2025-03-28_11-35-55_e9b3b.png

FenzoFx—GBPJPY recently hit a higher high after breaking past 195.0 resistance but has pulled back to 194.7, approaching the 50-period SMA on the 2-hour chart.

The outlook remains bullish as long as the price holds above 193.5, with potential gains toward 200.0 resistance. However, a bearish wave could emerge if GBPJPY drops below the ascending trendline and 193.5 support, targeting 192.0.
 

fxnews.me

Active Trader
Dec 26, 2023
189
0
32
44

Bullish NATGAS Targets $4.26.​

NATGAS_2025-03-31_10-17-08_e4db5.png

FenzoFx—NATGAS broke above the descending trendline and surpassed $4.0. Strong buying pressure pushed the Stochastic Oscillator into overbought territory, indicating Natural Gas is overpriced in the short term. The market may consolidate near the $4.0 support level.

Currently, NATGAS trades around $4.135, holding above the 50-SMA. The price action suggests a bullish trend, with the next target at the $4.26 resistance.
 

fxnews.me

Active Trader
Dec 26, 2023
189
0
32
44

AUD/USD Eyes Fibonacci Support​

AUDUSD_2025-03-31_13-24-04_ea189.png

FenzoFx—AUD/USD broke below the critical support at $0.626, heading toward the 78.6% Fibonacci level. The bearish trend remains intact while the price stays below the $0.6329 resistance.
 

fxnews.me

Active Trader
Dec 26, 2023
189
0
32
44

NZDUSD Falls Amid Oversold Signals​


NZDUSD_2025-03-31_16-36-12_6d547.png

FenzoFx—NZDUSD dropped below the $0.5678 support level and is now trading around $0.5670. Selling pressure has pushed the Stochastic Oscillator into oversold territory, recording 8.0.

The next bearish target is $0.5640, provided NZDUSD stays below the $0.5755 resistance.
 

fxnews.me

Active Trader
Dec 26, 2023
189
0
32
44

Bitcoin Eyes $84,720 After Key Support Rebound​

BTCUSD-2025-03-31-19-10-32-7e3ba.png


FenzoFx—Bitcoin rebounded from the $81,160 support level and surged past $83,520, forming higher highs. If the price stays above this key support, the bullish momentum could continue.

The next upside targets are $84,720 and $86,340. However, if Bitcoin drops below $81,160, the trend may reverse, potentially falling to $77,850.
 

fxnews.me

Active Trader
Dec 26, 2023
189
0
32
44

Ethereum Price Rebounds: Key Levels to Watch​

ETHUSD_2025-04-01_10-53-20_4a908.png


FenzoFx—Ethereum's downtrend stabilized at $1,755, a key support level. Currently, ETH/USD trades at $1,854, testing resistance.

A double bottom pattern on the 4-hour chart suggests potential growth if bulls secure a close above $1,860. The next target could be $1,950, supported by the 50-period moving average.
 

fxnews.me

Active Trader
Dec 26, 2023
189
0
32
44

USD/CAD Pulls Back After Hitting 1.4400​

USDCAD_2025-04-01_13-00-36_70dca.png

FenzoFx— The USD/CAD pair hit 1.4400 but lost momentum, pulling back from resistance. Technically, USD/CAD may dip toward the 50-period SMA near 1.4330 before resuming its uptrend.

However, if USD/CAD drops below 1.4330, the bearish momentum may extend to the 1.4250 support, invalidating the bullish outlook.
 

fxnews.me

Active Trader
Dec 26, 2023
189
0
32
44

Litecoin Tests Key Support: Reversal or Further Drop?​

LTCUSD_2025-04-01_15-46-58_462be.png

Litecoin is currently testing a key support zone between $80.0 and $83.0, which previously marked its February low. The overall trend remains bearish, but this support level could trigger a price rebound, potentially shifting momentum in favor of buyers.

If Litecoin holds above $80.0, there is a possibility of a recovery toward $100.0.

However, if sellers manage to break below this critical level, the downward trend may continue, with the next target set at $75.0.
 

fxnews.me

Active Trader
Dec 26, 2023
189
0
32
44

XRP tests Key Resistance Level​

XRPUSD_2025-04-01_19-30-04_9031d.png

FenzoFx—Ripple (XRP) has climbed from $2.026 and is currently testing resistance at $2.218. Despite this upward movement, the overall trend remains bearish as the price stays below the 50-period simple moving average on the 4-hour chart.

The nearest support level is $2.026. If XRP/USD drops below this point, the downtrend may strengthen, potentially driving the price toward $1.90 and then $1.80.

For the bearish trend to reverse, XRP needs to break above the immediate resistance at $2.218. If that happens, the next target could be $2.355.