MQ4 Code Works

hayseed

Master Trader
Jul 27, 2010
1,176
279
149
usa
hey erick..... let me reply here, it's easier.....

allen hull invented what has become called the hull ma in 2005..... it has become known as the hma....

around that time metatrader was moving from mq 3 to mq 4.....

wizard serg coded it in mq4 in 2006 ......

short time later igorad edited some and renamed tsr.....

the hma or tsr are attempts to eliminate lag, like the jurik moving averages..... some believe reducing lag is good.....

lag does not bother me as much...... try to use it in my favor.....h
//------
 

hayseed

Master Trader
Jul 27, 2010
1,176
279
149
usa
closed hundreds and hundreds of trades today...... will reenter..... next groups will be in the thousands.....

now is a good time to look at the monthly charts..... focus on the usd, jpy and chf.....

the ripple effect of central banks inflation tactics will drive lesser economies to the edge......

think small..... know the margin required..... preplan every trade....

do not try to impress anyone...... trade your account.....h
//-----
//----;

audusd-h1-oanda-division1.png

//-----
nzdusd-h4-oanda-division1.png


//------
eurusd-h4-oanda-division1.png
 
  • 👍
Reactions: Commander

TradeChaser

Active Trader
May 12, 2020
170
6
34
32
Incredible success. Hard work pays off. I’ve been thinking about your last post directed to me. Created my alerts should be simple.

Alerts:
  • Daily trend MA up and zzleg down
  • Daily trend MA up, zz leg down, AO < 0, and AO red to blue
  • Daily trend MA up, AO zero line cross
  • Daily trend MA up, zz leg down, 240 bullish AO 0-line cross (Perhaps an early detection

Opposite for bearish opportunities.

Have no idea where to start when it comes to fundamentals. Someday
 

hayseed

Master Trader
Jul 27, 2010
1,176
279
149
usa
Alerts:
  • Daily trend MA up and zzleg down
//----

those are exactly the kind of things i look for..... when put in a dashboard, you can see the entire market....

fundamentals quite often will be reflected in the price.... usually seen in the daily trend....

still, even with fundamentals and perfect technical setups, a single news or tweet event can set the price back many days.....

the most recent example is china saying it would try to turn things around with money.... that kicked my aud and nzd trades against me....

or did it..... because my trades were small lot size, all it really did was give me a second opportunity to sell..... those extra opportunities are what makes the chart jammed with trades.....

in the first chart below i really cant say if i sold for sure, but first 2 arrows on the ao would have been sells for me..... both those would have been losing trades if large lot sizes were used....

those are all 0.01 and a few 0.02...... averaging in allows me to control the margin required precisely..... it can't control tweets... but the negative impact of one is minor....

in the second chart, much larger account, the lot size is 5 mini lots..... i have to be very careful...... entrys need to be well timed.....

a single negative tweet there would have 50 times the negative impact..... shortly followed by fear and second guessing.....

sometimes it seems there are tens of thousands of excellent traders out there all trading differently.... yet all losing for the same reason......

lot size.....h
//----


audcad-d1-oanda-division1-prepare.png

//---
audcad-m15-ftmo-s-r-larger.png
 

TradeChaser

Active Trader
May 12, 2020
170
6
34
32
That’s good insight.

I can tell you that what’s given me the most difficult time jumping in whole sale is the exit. I fully understand the value of the signals and momentum within a trend. But in the past, if I don’t have an exit when I’m trading with the grids, I just figure “I’ll ride it out”. The fact that I don’t have a determined exit means my demons will work against me and that’s what has kept me from using real money.
 

hayseed

Master Trader
Jul 27, 2010
1,176
279
149
usa
The fact that I don’t have a determined exit means my demons will work against me
//----

thats a common deal..... just figure the best exit you can and don't worry if it is too early.....

anytime there is a daily down leg, there must be a new down leg for each time frame below..... so that might be a starting point....

i closed some eurcad trades while ago.... because of multiple zigzag down legs.....

can it go lower..... of course..... probably will..... did i maximize the trades..... probably not......

but i rather have at least 1 zigzag up leg on something before reentering.....

i don't see a good example right now, but some of the prior charts had the daily zigzag up while price and indicators were falling......

closing trades early is ok with me.... closing them late is a not.....h
//------

eurcad-d1-oanda-division1-daily.png


//---
eurcad-h4-oanda-division1-240.png
 

TradeChaser

Active Trader
May 12, 2020
170
6
34
32
//----

thats a common deal..... just figure the best exit you can and don't worry if it is too early.....

anytime there is a daily down leg, there must be a new down leg for each time frame below..... so that might be a starting point....

i closed some eurcad trades while ago.... because of multiple zigzag down legs.....

can it go lower..... of course..... probably will..... did i maximize the trades..... probably not......

but i rather have at least 1 zigzag up leg on something before reentering.....

i don't see a good example right now, but some of the prior charts had the daily zigzag up while price and indicators were falling......

closing trades early is ok with me.... closing them late is a not.....h
//------
Funny enough, I actually agree with you on the re-entry criteria, hole heartedly.

I was taking that in a different direction...

At some point, Every single trade is a loser. It will either turn into a winner or stay a loser and hurt. When I reference my demons, I am referring to those demons that allow my small loser to grow bigger because with a grid, I can always "see" how the next zz can help me break even... if it comes in time.

Perhaps I can start using the Daily ZZ extreme as a hard stop out.
 

hayseed

Master Trader
Jul 27, 2010
1,176
279
149
usa
I can always "see" how the next zz can help me break even... if it comes in time.
//----

at some point there will be few low risk entrys left......

right now on the daily and up timeframes with the exception of 2 pairs, the last zigzag is in the direction of the trend.....

easy pickins has dried up..... what do you do.....

maybe trade at the leading edge of the trend..... maybe drop down to the 240 to find something....

on the 240, the eurchf, gbpchf both have up zigzags in a daily downtrend.....

there are a few more on the 60 and always plenty 30 and down, but your dropping down into scalping territory....

you should run out of possible trades long before you get hung up ....

we need the daily and/or weekly zigzag leg to be opposite the trend..... we just don't have that now....

the lack of good trades should keep us out of hot water.....h
//-----
gbpchf-h4-oanda-division1.png


//----
eurchf-h4-oanda-division1.png

//-----
nzdcad-d1-oanda-division1.png
 

hayseed

Master Trader
Jul 27, 2010
1,176
279
149
usa
Perhaps I can start using the Daily ZZ extreme as a hard stop out.
//----

you can count the number of times the last bar zigzag extends..... as example, the daily gbpjpy zigzag is 16 or so days old..... knowing the average number of times it will break yet lower on some following bar can be useful on the 240 and up charts.....

there are premium setups and some less than..... gbpjpy is good example right now.... next major fundamental news is 9-15, so dont consider it....

look closely at the gbpjpy chart.... 60, 240, 1440 and weekly...... what do you see......

now look at the current counts...... what do they suggest.....

now look at my open trades in these 2 accounts.....

tell me what to do.....h
//-----

gbpjpy-h4-oanda-division1-2.png


//----
gbpjpy-h4-oanda-division1.png
 

TradeChaser

Active Trader
May 12, 2020
170
6
34
32
On the 60 and 240, I see downward momentum, MA’s are aligned bearishly.

1440 and 10080 have also bearish momentum per the AO. However, their MA’s are aligned and bullish.

I’m perplexed as to whether you are looking at a bearish wave you should ride (and possibly the first bearish turn of a very long term trend on the 10080), or if you’re looking at the Down ZZ in the up trend (on 1440 and 10080).

Two people may see both.

Personally, I would say close or stay short until a 240 AO cross or a red to blue on the 1440 AO histogram before I consider a long bias again
Post automatically merged:

I can’t say that I would have confidence enough to continue to enter new short positions however
Post automatically merged:

Can you tell me what you see if I were to ask you the same questions?

  1. What do you see on the 60, 240, 1440, and 10080 GBPJPY?
  2. What does that make you think?
  3. Does it effect your current positions and what are you looking for next?
 

hayseed

Master Trader
Jul 27, 2010
1,176
279
149
usa
Can you tell me what you see if I were to ask you the same questions?
  1. What do you see on the 60, 240, 1440, and 10080 GBPJPY?
  2. What does that make you think?
  3. Does it effect your current positions and what are you looking for next?
//-----

i saw me closing a whole herd of gbpjpys this morning and reentering slowly...... with extreme caution....

the weekly ma's are perfect uptrend..... price is well above the rising 50, 100 and 200..... however, with the exception of a few pips it has not made a new weekly high for 5 months..... the weekly ao shows momentum falling.... yen shorts have been on the hot seat for 3 months now....

1440 shows that weekly uptrend slowing more clearly..... price is below the 50 and 100..... that is also reflected in the daily counts..... within a few weeks the daily 50 might fall below the 100.....

the 60 and 240 ma's and ao concur recent uptrend weakening.....

still, it's risky to hold short though an upswing....... so i let'em all go shortly after this mornings 60 minute zigzag down leg......

will risk only a small amount shorting the up legs.....

if for some reason the usd weakens this week, almost by default the jpy will strengthen..... if the usdjpy falls, others will follow.... if those yen shorts ever start covering, i would not want to be long the gbpjpy......

trying to get out of everything by friday.....h
//-----

gbpjpy-h1-oanda-division1-gbp.png
 

oldspicehai

Trader
Sep 1, 2022
8
3
8
37
hey erick..... let me reply here, it's easier.....

allen hull invented what has become called the hull ma in 2005..... it has become known as the hma....

around that time metatrader was moving from mq 3 to mq 4.....

wizard serg coded it in mq4 in 2006 ......

short time later igorad edited some and renamed tsr.....

the hma or tsr are attempts to eliminate lag, like the jurik moving averages..... some believe reducing lag is good.....

lag does not bother me as much...... try to use it in my favor.....h
//------
Hello hayseed, I was reading a MQL4 source file and trying to learn and understand the code of Hull MA / HMA

I spent several weeks searching across multiple forex forums, from ForexFactory to EarnForex... And you're the only seem to be knowledgeable about Hull MA, since all the variation of this mq4 code dated back over 15 years.

Like you said, the mq4 of Hull MA was coded by Wizard Serg and I believe I'm using a modified version of it.

I attached the files below. Please read the source file and correct me if I'm wrong.

The slope direction line I'm using in my trading system is basically Hull MA, isn't it? But it has been smoothed because of method=2 , correct?

I'm looking for a MQL5 version of Hull MA and all I could find is from Mladen (also attached below)

Mladen's Hull-moving-average doesn't have an option to be smoothed like the MQL4 slope direction line , is it possible for the smoothing integer be added to the MQL5 source file? And is the inpDivisor "speed" necessary for Hull MA to function in mt5?

Please let me know because the slope direction line has been very effective in my trading system, hope to hear from you.
 

Attachments

  • slope direction line.mq4
    3.8 KB · Views: 11
  • Hull-moving-average.zip
    46.5 KB · Views: 14

oldspicehai

Trader
Sep 1, 2022
8
3
8
37
Hello hayseed, I was reading a MQL4 source file and trying to learn and understand the code of Hull MA / HMA

I spent several weeks searching across multiple forex forums, from ForexFactory to EarnForex... And you're the only seem to be knowledgeable about Hull MA, since all the variation of this mq4 code dated back over 15 years.

Like you said, the mq4 of Hull MA was coded by Wizard Serg and I believe I'm using a modified version of it.

I attached the files below. Please read the source file and correct me if I'm wrong.

The slope direction line I'm using in my trading system is basically Hull MA, isn't it? But it has been smoothed because of method=2 , correct?

I'm looking for a MQL5 version of Hull MA and all I could find is from Mladen (also attached below)

Mladen's Hull-moving-average doesn't have an option to be smoothed like the MQL4 slope direction line , is it possible for the smoothing integer be added to the MQL5 source file? And is the inpDivisor "speed" necessary for Hull MA to function in mt5?

Please let me know because the slope direction line has been very effective in my trading system, hope to hear from you.
MQL4:
//+---------------------------------------------------------------------+
//| Code: Trend Slope Trading Direction                                 |
//| This code is originally developed by Wizard Serg as an indicator    |
//| the moving direction of the FX pairs in 2006 in Forex Magazine 104  |
//| The code has been modified for other application and not applicable |
//| for any commercialize purposes. This code is modified by DH for     |
//| mid term trading.                                                   |
//+---------------------------------------------------------------------+
 
#property indicator_chart_window
#property indicator_buffers 2
#property indicator_color1 Lime
#property indicator_color2 Red
 
//---- input parameters
extern int       period=80;
extern int       method=2;                         // MODE_SMA
extern int       price=0;                          // PRICE_CLOSE
 
//---- buffers
double Uptrend[];
double Dntrend[];
double ExtMapBuffer[];
double alertTag;
 
//+------------------------------------------------------------------+
//| Custom indicator initialization function                         |
//+------------------------------------------------------------------+
int init()
{
    IndicatorBuffers(3);
    SetIndexBuffer(0, Uptrend);
    //ArraySetAsSeries(Uptrend, true);
    SetIndexBuffer(1, Dntrend);
    //ArraySetAsSeries(Dntrend, true);
    SetIndexBuffer(2, ExtMapBuffer);
    ArraySetAsSeries(ExtMapBuffer, true);    
    SetIndexStyle(0,DRAW_ARROW,STYLE_DOT,1,Lime);
    SetIndexArrow(0,159);
    SetIndexStyle(1,DRAW_ARROW,STYLE_DOT,1,Red);
    SetIndexArrow(1,159);  
    IndicatorShortName("Signal Line("+period+")");
    return(0);
}
 
//+------------------------------------------------------------------+
//| Custor indicator deinitialization function                       |
//+------------------------------------------------------------------+
int deinit()
{
    // ???? ????? ?????? ??????
    return(0);
}
 
//+------------------------------------------------------------------+
//| Using Weight Moving Average                                      |
//+------------------------------------------------------------------+
double WMA(int x, int p)
{
    return(iMA(NULL, 0, p, 0, method, price, x));  
}
 
//+------------------------------------------------------------------+
//| Custom indicator iteration function                              |
//+------------------------------------------------------------------+
int start()
{
  int counted_bars = IndicatorCounted();  
  if(counted_bars < 0)
  return(-1);
 
  int x = 0;
  int p = MathSqrt(period);            
  int e = Bars - counted_bars + period + 1;
 
  double vect[], trend[];
 
  if(e > Bars) e = Bars;  
 
  ArrayResize(vect, e);
  ArraySetAsSeries(vect, true);
  ArrayResize(trend, e);
  ArraySetAsSeries(trend, true);
 
  for(x = 0; x < e; x++)
  {
    vect[x] = 2*WMA(x, period/2) - WMA(x, period);
  }
 
  for(x = 0; x < e-period; x++)    
    ExtMapBuffer[x] = iMAOnArray(vect, 0, p, 0, method, x);      
 
  for(x = e-period; x >= 0; x--)
  {    
    trend[x] = trend[x+1];
    if (ExtMapBuffer[x]> ExtMapBuffer[x+1]) trend[x] =1;
    if (ExtMapBuffer[x]< ExtMapBuffer[x+1]) trend[x] =-1;  
 
    if (trend[x]>0)
      {
        Uptrend[x] = ExtMapBuffer[x];
        if (trend[x+1]<0) Uptrend[x+1]=ExtMapBuffer[x+1];
 
        Dntrend[x] = EMPTY_VALUE;
      }
 
    else            
    if (trend[x]<0)
      {
        Dntrend[x] = ExtMapBuffer[x];
        if (trend[x+1]>0) Dntrend[x+1]=ExtMapBuffer[x+1];
 
        Uptrend[x] = EMPTY_VALUE;
      }            
  }  
  return(0);
}
//End Program

MQL5:
//------------------------------------------------------------------
#property copyright "© mladen, 2019"
#property link      "mladenfx@gmail.com"
//------------------------------------------------------------------
#property indicator_chart_window
#property indicator_buffers 2
#property indicator_plots   1
#property indicator_label1  "Hull"
#property indicator_type1   DRAW_COLOR_LINE
#property indicator_color1  clrGray,clrMediumSeaGreen,clrOrangeRed
#property indicator_width1  2
 
//
//
//
//
//
 
input int                inpPeriod  = 20;          // Period
input double             inpDivisor = 2.0;         // Divisor ("speed")
input ENUM_APPLIED_PRICE inpPrice   = PRICE_CLOSE; // Price
 
double val[],valc[];
 
//------------------------------------------------------------------
//
//------------------------------------------------------------------
//
//
//
 
int OnInit()
{
   SetIndexBuffer(0,val,INDICATOR_DATA);
   SetIndexBuffer(1,valc,INDICATOR_COLOR_INDEX);
      iHull.init(inpPeriod,inpDivisor);
         IndicatorSetString(INDICATOR_SHORTNAME,"Hull ("+(string)inpPeriod+")");
   return (INIT_SUCCEEDED);
}
void OnDeinit(const int reason)
{
}
 
//------------------------------------------------------------------
//
//------------------------------------------------------------------
//
//
//
//
//
 
int OnCalculate(const int rates_total,const int prev_calculated,const datetime &time[],
                const double &open[],
                const double &high[],
                const double &low[],
                const double &close[],
                const long &tick_volume[],
                const long &volume[],
                const int &spread[])
{
   int i= prev_calculated-1; if (i<0) i=0; for (; i<rates_total && !_StopFlag; i++)
   {
      val[i]  = iHull.calculate(getPrice(inpPrice,open,high,low,close,i),i,rates_total);
      valc[i] = (i>0) ? (val[i]>val[i-1]) ? 1 : (val[i]<val[i-1]) ? 2 : valc[i-1] : 0;
   }
   return(i);
}
 
//------------------------------------------------------------------
// Custom function(s)
//------------------------------------------------------------------
//
//---
//
 
class CHull
{
   private :
      int    m_fullPeriod;
      int    m_halfPeriod;
      int    m_sqrtPeriod;
      int    m_arraySize;
      double m_weight1;
      double m_weight2;
      double m_weight3;
      struct sHullArrayStruct
         {
            double value;
            double value3;
            double wsum1;
            double wsum2;
            double wsum3;
            double lsum1;
            double lsum2;
            double lsum3;
         };
      sHullArrayStruct m_array[];
 
   public :
      CHull() : m_fullPeriod(1), m_halfPeriod(1), m_sqrtPeriod(1), m_arraySize(-1) {                     }
     ~CHull()                                                                      { ArrayFree(m_array); }
 
      ///
      ///
      ///
 
      bool init(int period, double divisor)
      {
            m_fullPeriod = (int)(period>1 ? period : 1);   
            m_halfPeriod = (int)(m_fullPeriod>1 ? m_fullPeriod/(divisor>1 ? divisor : 1) : 1);
            m_sqrtPeriod = (int) MathSqrt(m_fullPeriod);
            m_arraySize  = -1; m_weight1 = m_weight2 = m_weight3 = 1;
               return(true);
      }
 
      //
      //
      //
 
      double calculate( double value, int i, int bars)
      {
         if (m_arraySize<bars) { m_arraySize = ArrayResize(m_array,bars+500); if (m_arraySize<bars) return(0); }
 
            //
            //
            //
 
            m_array[i].value=value;
            if (i>m_fullPeriod)
            {
               m_array[i].wsum1 = m_array[i-1].wsum1+value*m_halfPeriod-m_array[i-1].lsum1;
               m_array[i].lsum1 = m_array[i-1].lsum1+value-m_array[i-m_halfPeriod].value;
               m_array[i].wsum2 = m_array[i-1].wsum2+value*m_fullPeriod-m_array[i-1].lsum2;
               m_array[i].lsum2 = m_array[i-1].lsum2+value-m_array[i-m_fullPeriod].value;
            }
            else
            {
               m_array[i].wsum1 = m_array[i].wsum2 =
               m_array[i].lsum1 = m_array[i].lsum2 = m_weight1 = m_weight2 = 0;
               for(int k=0, w1=m_halfPeriod, w2=m_fullPeriod; w2>0 && i>=k; k++, w1--, w2--)
               {
                  if (w1>0)
                  {
                     m_array[i].wsum1 += m_array[i-k].value*w1;
                     m_array[i].lsum1 += m_array[i-k].value;
                     m_weight1        += w1;
                  }                 
                  m_array[i].wsum2 += m_array[i-k].value*w2;
                  m_array[i].lsum2 += m_array[i-k].value;
                  m_weight2        += w2;
               }
            }
            m_array[i].value3=2.0*m_array[i].wsum1/m_weight1-m_array[i].wsum2/m_weight2;
 
            //
            //---
            //
 
            if (i>m_sqrtPeriod)
            {
               m_array[i].wsum3 = m_array[i-1].wsum3+m_array[i].value3*m_sqrtPeriod-m_array[i-1].lsum3;
               m_array[i].lsum3 = m_array[i-1].lsum3+m_array[i].value3-m_array[i-m_sqrtPeriod].value3;
            }
            else
            { 
               m_array[i].wsum3 =
               m_array[i].lsum3 = m_weight3 = 0;
               for(int k=0, w3=m_sqrtPeriod; w3>0 && i>=k; k++, w3--)
               {
                  m_array[i].wsum3 += m_array[i-k].value3*w3;
                  m_array[i].lsum3 += m_array[i-k].value3;
                  m_weight3        += w3;
               }
            }         
         return(m_array[i].wsum3/m_weight3);
      }
};
CHull iHull;
 
//
//---
//
 
template <typename T>
double getPrice(ENUM_APPLIED_PRICE tprice, T& open[], T& high[], T& low[], T& close[], int i)
{
   switch(tprice)
   {
      case PRICE_CLOSE:     return(close[i]);
      case PRICE_OPEN:      return(open[i]);
      case PRICE_HIGH:      return(high[i]);
      case PRICE_LOW:       return(low[i]);
      case PRICE_MEDIAN:    return((high[i]+low[i])/2.0);
      case PRICE_TYPICAL:   return((high[i]+low[i]+close[i])/3.0);
      case PRICE_WEIGHTED:  return((high[i]+low[i]+close[i]+close[i])/4.0);
   }
   return(0);
}
//------------------------------------------------------------------
 

Attachments

  • slope direction line.mq4
    3.8 KB · Views: 10
  • Hull-moving-average.zip
    46.5 KB · Views: 8
  • 👍
Reactions: Enivid

hayseed

Master Trader
Jul 27, 2010
1,176
279
149
usa
Mladen's Hull-moving-average doesn't have an option to be smoothed like the MQL4 slope direction line , is it possible for the smoothing integer be added to the MQL5 source file? And is the inpDivisor "speed" necessary for Hull MA to function in mt5?

Please let me know because the slope direction line has been very effective in my trading system, hope to hear from you.
//-----

hey oldspice..... mladen has his own special way of coding which is very unique to him and him alone...... looking at his code , his non standard manner is apparent..... for some reason he did not include the ability to choose the ma method..... because he is calculating the value differently than everyone else.... i do not see any way to code in the method option where it will have any effect.....

the 2004 hma version was the original stripped down version ....... notice the macd like code......

later in 2006 , wizardserg colorized it , changed the math and gave us the 2 new input options...... it plots the same....

still later, fxigor personalized it for his trend slope direction trading system..... we reduced the name to tsr..... it plots the same.....

like you mentioned, having the ability to vary the ma method can be useful.....

the speed or divisor inputs are just the way of calculating the second ma...... such as a speed or divisor of 2 would cut the ma value in half..... or 3 would cut it by 1/3.....

so a hull ma(20) would compare the 20 to the 10.....

i'm not real handy with mq5.....h

//-----

Code:
      ind_buffer1[i]=iMA(NULL,0,MathFloor(HMA_Period/2),0,MODE_LWMA,PRICE_CLOSE,i)*2-
                     iMA(NULL,0,HMA_Period,0,MODE_LWMA,PRICE_CLOSE,i);

//---
 

Attachments

  • HMA Color.mq4
    7.6 KB · Views: 12
  • HMA Color.ex4
    11.2 KB · Views: 8
  • HMA MLaden.ex4
    17.5 KB · Views: 9
  • HMA MLaden.mq4
    13.9 KB · Views: 10
  • HMA.ex4
    8.4 KB · Views: 8
  • HMA.mq4
    5.2 KB · Views: 10
  • Hull.ex4
    18.6 KB · Views: 7
  • Hull.mq4
    14 KB · Views: 11
  • TSR.ex4
    10.5 KB · Views: 8
  • TSR.mq4
    12.5 KB · Views: 14
  • 👍
Reactions: oldspicehai and Enivid

oldspicehai

Trader
Sep 1, 2022
8
3
8
37
Code:
ind_buffer1=iMA(NULL,0,MathFloor(HMA_Period/2),0,MODE_LWMA,PRICE_CLOSE,i)*2-
iMA(NULL,0,HMA_Period,0,MODE_LWMA,PRICE_CLOSE,i);
Hi hayseed, I really appreciate the detailed reply!

Thank you so much for pointing me to the right direction with the code above . I was lost, and your overall in-depth knowledge helps me to figure out the mq5 code.
 

hayseed

Master Trader
Jul 27, 2010
1,176
279
149
usa
been scratching around thru old laptops and usb storage devices for the diamonds indicator...... something i coded long ago....

found this....lol.......... pennies and print pennies..... i'm such a big spender.....

someone might have fun with it...... i did....

you probably know the story of wheat and the chessboard..... it has to do with exponential growth....... and it's realistic limitations.....

instead of wheat i used pennies, which are more forex trading related..... demo forex trading related.....

the basic idea is to make 1 penny on your first trade, followed by 2 pennies on the second, 4 pennies on the third and so on till you cover all 64 squares on the chessboard...... yeah sounds easy.....

obviously it's ok to combine multiple trades/days/squares into 1..... no point in trying for 4 pennies...... 20.48 would cover the first 10 days/trades/squares......

the pennies script only prints out on the chart some rough metrics showing possible lot sizes , pips required and margin required for that trade..... the days input will let you know what you will need to make per trade in that may days......

it will require 50 standard lots before 30 days.....

the print pennies script has a squares input, related to the squares on the chessboard...... can be thought of as days or trades...... it prints the values per trade in the journal......

the nzdcad trade below is about 204$ at it's profit target and should cover quite a few days/trades/squares..... sounds good, till you realize the next trade must be at least 327.68 ......

each day/trade/square the $ amount required doubles......

i'll try to run it to better explain...... h


//-----
pennies.jpg

//-----
nzdcad-d1-oanda-division1.png


//-----
audcad-d1-oanda-division1-eurusd.png
 

Attachments

  • print pennies.mq4
    1.1 KB · Views: 13
  • print pennies.ex4
    5.7 KB · Views: 8
  • pennies.mq4
    3 KB · Views: 14
  • pennies.ex4
    7.8 KB · Views: 8
  • 👍
Reactions: oldspicehai

BossZ

Trader
Aug 6, 2022
3
0
7
29
Hello everyone.

This indicator is currently being tested by me.

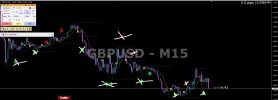
But there are way too many arrows on this indicator. Please let me know how to fix the color correction or disable the red and green arrows.
All I have to do is display each yellow X. Every time a yellow X appears, if at all feasible. Can you notify me through text message or on my phone?

I have no experience with coding. I therefore hope you can be of assistance.

Thank you so much!
 

Attachments

  • confluence.mq4
    21.7 KB · Views: 16
  • guibqt.jpg
    guibqt.jpg
    198.5 KB · Views: 20

Enivid

Administrator
Staff member
Nov 30, 2008
19,321
1,534
144
Odesa
www.earnforex.com
Hello everyone.

This indicator is currently being tested by me.

But there are way too many arrows on this indicator. Please let me know how to fix the color correction or disable the red and green arrows.
All I have to do is display each yellow X. Every time a yellow X appears, if at all feasible. Can you notify me through text message or on my phone?

I have no experience with coding. I therefore hope you can be of assistance.

Thank you so much!
It's unclear what you mean by too many arrows. How is it to be decided which arrows are to stay and which are to go? Also what kind of "color correction fix" do you have in mind?
 

BossZ

Trader
Aug 6, 2022
3
0
7
29
It's unclear what you mean by too many arrows. How is it to be decided which arrows are to stay and which are to go? Also what kind of "color correction fix" do you have in mind?
Xin chào Enivid !
First of all, I apologize for my poor English.

This symptom On a website, I downloaded it. I just know it functions depending on CCI and RSI.

Despite the color adjustment section on the indicator. But it doesn't work. When there are an excessive number of red and green arrows, the indicator appears confused. Currently I am testing every yellow X signal to trade.

I hope you can help me fix this error. as a result of my poor coding skills.

Thank you very much.
 
Last edited: