My personal FX pairs and XAUUSD analysis
- Thread starter DominicWalsh
- Start date
- Watchers 2
You are using an out of date browser. It may not display this or other websites correctly.
You should upgrade or use an alternative browser.
You should upgrade or use an alternative browser.
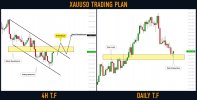
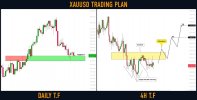
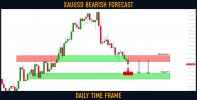
Gold (#XAUUSD): Your Trading Plan For Next Week
⚠️Gold reached a solid horizontal key level this week.
The price formed a doji candle on that on Thursday and then a rejection candle was formed.
We see the attempt of buyers to push.
To catch a pullback, watch a falling parallel channel and a minor horizontal supply zone.
I would suggest waiting for a bullish breakout of these 2. It will most likely trigger the initiation of a correctional movement.
Let 4h candle close above the trend line and a yellow area to confirm the breakout.
Goal will be 1866.
I will monitor this trading setup and post an update later on.
Attachments
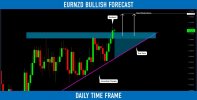
EURNZD: Classic Bullish Setup
EURNZD broke and closed above a neckline of a huge ascending triangle formation on a daily.
Watch the underlined blue zone carefully. It is a contracting buy zone based on a trend line and a broken neckline.
I will expect a bullish wave from that.
Next resistance - 0.728
EURNZD broke and closed above a neckline of a huge ascending triangle formation on a daily.
Watch the underlined blue zone carefully. It is a contracting buy zone based on a trend line and a broken neckline.
I will expect a bullish wave from that.
Next resistance - 0.728
Attachments
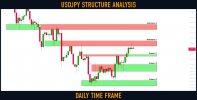
USDJPY: Key Levels to Watch This Week
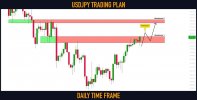
Here is my fresh structure analysis for ⚠️USDJPY.
Resistance 1: 134.48 - 135.475 area
Resistance 2: 137.6 - 138.6 area
Support 1: 132.6 - 132.9 area
Support 2: 129.7 - 131.05 area
Support 3: 127.2 - 128.2 area
Consider these structures for pullback, breakout trading.
Here is my fresh structure analysis for ⚠️USDJPY.
Resistance 1: 134.48 - 135.475 area
Resistance 2: 137.6 - 138.6 area
Support 1: 132.6 - 132.9 area
Support 2: 129.7 - 131.05 area
Support 3: 127.2 - 128.2 area
Consider these structures for pullback, breakout trading.
Attachments
Dollar Index (#DXY): Your Detailed Trading Plan
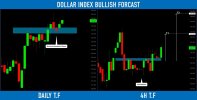
We have spotted earlier a confirmed structure breakout on Dollar Index.
The market is retesting that at the moment.
To catch a bullish move from that with a confirmation, watch a double-bottom pattern on the 4H time frame.
104.05 - 104.09 is its neckline.
Wait for its bullish breakout; we need a 4H candle close above that to confirm the violation.
A bullish continuation will be expected then to 104.55.
If the price sets a new lower low, the setup will become invalid.
Attachments
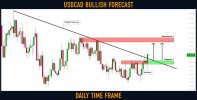
#USDCAD: Important Breakout
USDCAD suddenly bounced yesterday.
The price formed a high momentum bullish candle, breaking a solid horizontal resistance and a primary falling trend line.
I believe that bulls may push the price much higher now.
Next goal - 1.366
USDCAD suddenly bounced yesterday.
The price formed a high momentum bullish candle, breaking a solid horizontal resistance and a primary falling trend line.
I believe that bulls may push the price much higher now.
Next goal - 1.366
Attachments
DOLLAR INDEX (#DXY) Bullish Continuation
Update for my yesterday's post on Dollar Index.
The market successfully broke the neckline of a triple bottom pattern on 4H.
We see a positive bullish reaction after a retest.
A bullish continuation is expected now to 104.56 / 104.95
A triple Bottom pattern is formed when the price breaks below the bottom support level and bounces above it. Unlike the double Bottom way, the triple bottom design has three bottoms or support levels – the first Bottom at a support level, the second Bottom at a resistance level, and the third Bottom at the support level. The triple bottom pattern is an indicator of a reversal in trend and confirmation of a price reversal move by technical analysts.
Source: https://forextradingstrategies4us.com/triple-bottom-pattern/
Update for my yesterday's post on Dollar Index.
The market successfully broke the neckline of a triple bottom pattern on 4H.
We see a positive bullish reaction after a retest.
A bullish continuation is expected now to 104.56 / 104.95
The Triple Bottom Pattern: Why It’s A Powerful Indicator Of Trends
The “Triple bottom” pattern is a chart pattern that indicates a reversal in trend. It occurs when the price touches the Bottom of a downtrend and then moves up, touching the top of an uptrend before falling back to the Bottom. The pattern can be found in price chart analysis and technical analysis.A triple Bottom pattern is formed when the price breaks below the bottom support level and bounces above it. Unlike the double Bottom way, the triple bottom design has three bottoms or support levels – the first Bottom at a support level, the second Bottom at a resistance level, and the third Bottom at the support level. The triple bottom pattern is an indicator of a reversal in trend and confirmation of a price reversal move by technical analysts.
Source: https://forextradingstrategies4us.com/triple-bottom-pattern/
Attachments
[Here’s why you need proper risk management in trading]
Imagine:
There are two traders, John and Sally.
They both start with a $1,000 account
John is an aggressive trader and he risks $250 on each trade.
Sally is a conservative trader and she risks $20 on each trade.
Both adopt a trading strategy that wins 50% of the time with an average of 1:2 risk to reward.
Over the next 8 trades, the outcomes are Lose Lose Lose Lose Win Win Win Win.
Here’s the outcome for John:
-$250 -$250 -$250 -$250 = BLOW UP
Here’s the outcome for Sally:
-$20 -$20 -$20 -$20 +$40 +$40 +$40 +$40 = +$80
Do you see the power of risk management?
So here’s the deal:
As a trader, you’ll encounter losses regularly.
But with proper risk management, you can contain these losses till it feels like an “ant bite”.
GOLD (#XAUUSD): Update & The Thing to Watch
The market keeps coiling on a critical daily horizontal support.
Analyzing a 4H time frame, I spotted a potential inverted [URL deleted] head & shoulders pattern.
The price has already completed the left shoulder and the head and currently, it is forming the right shoulder.
1842 - 1850 is its horizontal neckline.
The trigger to buy Gold will be its bullish breakout (4h candle close above).
A bullish continuation will be expected to 1866 / 1879 levels then.
If the price sets a new low, the pattern will become invalid though.
This creates a “head” at the top of the pattern with two “shoulders” on either side. Traders watch for this pattern as it often signals an upcoming reversal in trend direction, providing an opportunity to enter or exit trades. Identifying this pattern requires looking for three consecutive peaks where the middle peak is lower than the other two. It can predict trend reversals in any financial instrument, including stocks, commodities, indices, and currency pairs.
Source: https://forextradingstrategies4us.com/head-and-shoulders-pattern/
The market keeps coiling on a critical daily horizontal support.
Analyzing a 4H time frame, I spotted a potential inverted [URL deleted] head & shoulders pattern.
The price has already completed the left shoulder and the head and currently, it is forming the right shoulder.
1842 - 1850 is its horizontal neckline.
The trigger to buy Gold will be its bullish breakout (4h candle close above).
A bullish continuation will be expected to 1866 / 1879 levels then.
If the price sets a new low, the pattern will become invalid though.
What Is a Head and Shoulders Chart Pattern in Technical Analysis?
The head and Shoulders Chart Pattern is a technical analysis tool used to identify potential reversal points in the market. The pattern forms when a stock’s price reaches a peak and then declines, followed by another mountain that is not as high as the first one, and then falls again.This creates a “head” at the top of the pattern with two “shoulders” on either side. Traders watch for this pattern as it often signals an upcoming reversal in trend direction, providing an opportunity to enter or exit trades. Identifying this pattern requires looking for three consecutive peaks where the middle peak is lower than the other two. It can predict trend reversals in any financial instrument, including stocks, commodities, indices, and currency pairs.
Source: https://forextradingstrategies4us.com/head-and-shoulders-pattern/
Attachments
Last edited by a moderator:
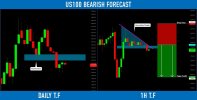
Nasdaq-100 Index (#US100) Short Trade Explained
Nasdaq Index is approaching a key daily structure resistance.
The price has formed a descending triangle formation on that on 1H time frame.
Its neckline was broken, and an hourly candle closed below that, confirming a highly probable coming bearish movement.
Next support: 12000
The descending triangle chart pattern goes by the falling triangle, allowing traders to measure the distance from the start of the way. This pattern is formed when the price falls below the lower trendline support level and recovers only to return to that support level. After repeating this pattern several times, the price eventually breaks out of the descending triangle pattern and heads higher or lower per its support or resistance level.
Source: https://forextradingstrategies4us.com/descending-triangle-pattern/
Nasdaq Index is approaching a key daily structure resistance.
The price has formed a descending triangle formation on that on 1H time frame.
Its neckline was broken, and an hourly candle closed below that, confirming a highly probable coming bearish movement.
Next support: 12000
What Is a Descending Triangle?
A descending triangle pattern is a chart pattern used in technical analysis created by drawing one trend line connecting a series of lower highs and another horizontal trend line connecting a series of lows. The pattern is considered a bearish continuation pattern with an established downtrend. However, descending triangle patterns can also be bullish, with a breakout in the opposite direction, and are known as reversal patterns.The descending triangle chart pattern goes by the falling triangle, allowing traders to measure the distance from the start of the way. This pattern is formed when the price falls below the lower trendline support level and recovers only to return to that support level. After repeating this pattern several times, the price eventually breaks out of the descending triangle pattern and heads higher or lower per its support or resistance level.
Source: https://forextradingstrategies4us.com/descending-triangle-pattern/
Attachments
Gold (#XAUUSD): The Breakout!
So it turned out that Gold dropped again.
After the release of US fundamentals on Friday,
bears started to push.
The price managed to close below a key daily horizontal structure support cluster.
It turned into resistance now.
Probabilities are high, and the market will keep falling next week.
Next support - 1787
Attachments
Similar threads
- Replies
- 0
- Views
- 716
- Replies
- 30
- Views
- 2K
- Replies
- 0
- Views
- 1K
- Replies
- 0
- Views
- 2K
- Replies
- 1
- Views
- 1K


