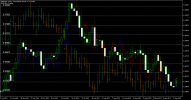
I made a small modification if anyone finds it useful.
1. you can put the indicator on the same chart as many times as you want, because I dynamically change the name, per the idea of: Enivid
2. you can enter how many bars to use (for example 1000), because in the current version the chart is recalculated every time the chart changes(zoom, scroll), and sometimes it's not convenient, now if you enter a number other than 0, the graphics will not be recalculated unless you change the timeframe.


