Technical analysis on EU,GU and majors

bhanu545

Master Trader
Nov 3, 2010
2,773
0
72
GBP/USD Intraday Technical Analysis 2012-05-15

gbpusd.png

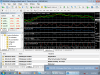
The spot rate is approching the upper limit of its medium term bearish channel at 1.6150 and is likley to decline. However, a breakdown of these levels will release significant potential and initiate a violent bullish trend.

Technical indicators provide sellers signals and as long as the resistance level is unbroken, the pair is very likely to decline. Bollinger bands have greatly tightened in recent days showing a decline in volatility and the imminence of a violent movement

According to previous events the market will provide a bullish opportunity as soon as the spot rate has broken through its resistance of 1.6150 with 1st objectives seen at 1.6210 and 1.6230. In case the level 1.6130 is broken through, the proposed scenario will be cancelled.

Performed by Albert Fitoussi, Analytical expert
InstaForex Companies Group © 2007-2012
 

mohin

Trader
May 16, 2012
1
0
17
GBP goes down

The pound extended losses against the U.S. dollar on Wednesday, after the Bank of England said inflation is likely to remain above target for another 12 months, while growth is to remain vulnerable to risks from the crisis roiling the euro zone.hit 1.5889 during European morning trade, the pair’s lowest since April 17; the pair subsequently consolidated at 1.5906, shedding 0.54%.

Cable was likely to find support at 1.5818, the low of April 16 and resistance at 1.5998, the session high.
 

Attachments

  • gbp.png
    gbp.png
    88.1 KB · Views: 3

bhanu545

Master Trader
Nov 3, 2010
2,773
0
72
EUR/USD Elliott Wave Count for May 16, 2012

EURUSD_-_alternation_-_May-16_1128_AM_(2_hour).png

For the last two weeks the EUR/USD pair has been developing 3 wave (coloured blue) of the bigger wave (3) (coloured green). Yesterday the EUR/USD pair was trading in a downward movement. During the European session we could observe the ascending movement towards the 1.2865 level. Therefore during the New York session the EUR/USD did not manage to hold this level and price started pushing lower reaching 1.2720 level (daily low). Today during the Asian session the price continue trading in a bearish mood reaching 1.2680 level.We can consider this move as end of the 3 wave (coloured pink). Presently we can observe 3 impulsive wave. In accordance with our wave rules and taking into account that the wave 3 retraces 161.8% of the wave 1, we can define the potential targets with Fibonacci extensions (1.3380-1.2993-1.3282) with Take Profit 1 at 1.2600 (161.8% of wave 1). The resistance point at 1.2750 level can be used as Stop Loss. Also it is necessary to consider the data concerning the U.S Building Permits, Housing Starts, Capacity Utilization Rate, Industrial Production m/m, Crude Oil Inventories,FOMC Meeting Minutes that can affect the rate of the pair.

Support and Resistance levels
(S3) 1.2625 (S2) 1.2681 (S1) 1.2716 (PP) 1.2772 (R1) 1.2828 (R2) 1.2863 (R3) 1.2919

Trading Forecast
Proceeding from Elliott Wave Rules this week the trend is expected to begin the downward movement. That is why Short positions at level 1.2700 with Stop Loss at 1.2750 and Take Profit at 1.2600 are recommended.

Performed by Nicola Delic, Analytical expert
InstaForex Companies Group © 2007-2012
 

bhanu545

Master Trader
Nov 3, 2010
2,773
0
72
GBP/USD Intraday Technical Analysis and Trade Recommendations for May 16, 2012

gb1hhh.png

In the beginning of the month,the GBP/USD pair has broken the lower limit of its bullish channel. Since then it has been downtrending within the depicted bearish channel.

Yesterday the GBP/USD pair showed siginificant bearish swing breaking-down the significant support / prominent Intraday buttom around 1.6050 opening the way for a quick decline towards 1.5960-1.5940 which is considered as a strong support zone that determins the next target.

Bullish stabilization above 1.5960-1.5940 enhances the bullish retracement towards 1.6050. However, its breakdown will lead to another decline towards 1.5895 and 1.5860.

Price Level 1.6050 is considered to be valid SELL entry as it corresponds to the upper limit of the ongoing bearish channel & previous broken support level.

SL should be located above 1.6120 while TP levels are to be located at 1.6015, 1.5975 and 1.5930.

Performed by Mohamed Samy, Analytical expert
InstaForex Companies Group © 2007-2012
 

bhanu545

Master Trader
Nov 3, 2010
2,773
0
72
EUR/USD Elliott Wave Count for May 17, 2012

EURUSD_-_alternation_-_May-17_1128_AM_(2_hour).png

EUR/USD Elliott Wave
Yesterday the EUR/USD pair was trading sideways. During the European session we could observe downward movement towards the 1.2680 level where this pair find support and started pushing higher. Therefore during the early New York session we could observe price around 1.2760 level. At the second half of New York session the EUR/USD start pushing lower again and this major closed Wednesday at the 1.2700 level. Today during the Asian session we could observe bullish mood and price reaching 50 EMA resistance. We have German, French and Swiss bank holiday today so I do not expect high volatility before New York start. Presently we can observe end of the 5 wave (coloured pink) of the bigger 3 wave (coloured blue) so we should be prepared for entering with long position for catching corrective 4 wave (coloured blue).In accordance with our wave rules and taking into account that the wave 4 retraces 100% of the wave 2, we can define the potential targets with measuring the 2 wave. Take Profit at 1.2918 (100% of wave 2). The resistance point at the 1.2600 level can be used as Stop Loss. Also it is necessary to consider the data concerning the U.S. Unemployment Claims, Philly Fed Manufacturing Index and Treasury Sec Geithner Speech, that can affect the rate of the pair.

Support and Resistance levels
(S3) 1.2641 (S2) 1.2670 (S1) 1.2689 (PP) 1.2718 (R1) 1.2747 (R2) 1.2766 (R3) 1.2795

Trading Forecast
Proceeding from Elliott Wave Rules this week the trend is expected to begin the upward movement. That is why Long positions at level 1.2660 with Stop Loss at 1.2600 and Take Profit at 1.2918 are recommended.

Performed by Nicola Delic, Analytical expert
InstaForex Companies Group © 2007-2012
 

bhanu545

Master Trader
Nov 3, 2010
2,773
0
72
GBP/USD Intraday Technical Analysis 2012-05-17

gbpusd.png

The spot rate is currently testing the intermediate support of its medium term bearish channel at 1.5860 suggesting a rebound. However, a break through this level will trigger a decline to the lower limit – 1.5020.

Technical indicators provide sell-signals but until the support is not broken the assumption of a rebound is most likely. Bollinger bands are much discarded as a result of a strong increase these days. Stabilization is expected in a short term.

According to previous events the market will provide a bullish opportunity at the level of 1.5860 with the 1st objective at 1.5920 and then at 1.5950. A break through 1.5840 will alter this scenario.

Performed by Albert Fitoussi, Analytical expert
InstaForex Companies Group © 2007-2012
 

bhanu545

Master Trader
Nov 3, 2010
2,773
0
72
EUR/USD Intraday Technical Analysis 2012-05-18

eurusd.png

The spot rate is now testing the upper limit of its medium term bearish channel at 1.2720 and seems to initiate a decline. Still, a break through these levels will free good potential and initiate a violent bullish trend.
Technical indicators do not provide clear signals but until the resistance is not broken the assumption of a decline is most likely. Bollinger bands have greatly tightened in recent days showing a decline in volatility and the imminence of a violent movement.
According to previous events the market will provide a bullish opportunity as soon as the spot rate has broken through its resistance of 1.2720 with the 1st objective at 1.2780 and then at 1.2800. A puncture of 1.2700 will invalidate this scenario.

Performed by Albert Fitoussi, Analytical expert
InstaForex Companies Group © 2007-2012
 

bhanu545

Master Trader
Nov 3, 2010
2,773
0
72
GBP/USD Intraday Technical Analysis 2012-05-18

gbpusd.png

The spot rate is currently testing the intermediate support of its medium term bullish channel at 1.5690 and seems to start a rebound. However, a pass of these levels will release good potential and reach the lower limit of this one to 1,5360.
Technical indicators provide sell-signals but until the support is not broken the assumption of a rebound is most likely. Bollinger bands are much discarded as a result of a strong decline these days. Stabilization is expected in a short term.

According to previous events the market will provide a bullish opportunity at the level of 1.5690 with the 1st objective at 1.5750 and then at 1.5770. A break through 1.5670 will alter this scenario.

Performed by Albert Fitoussi, Analytical expert
InstaForex Companies Group © 2007-2012
 

bhanu545

Master Trader
Nov 3, 2010
2,773
0
72
EUR/USD Elliott Wave Count for May 21, 2012

EURUSD_-_Primary_Analysis_-_May-21_1121_AM_(90_min).png

EUR/USD Elliott Wave
During the last week the EUR/USD pair was trading downward developing impulsive 3 wave (coloured blue). During the Friday's European session we could observe ascending move toward the 1.2710 level (100EMA resistance). Therefore during the New York session we could observe continuation of the bullish mood and price reached new daily high at 1.2793 level.Today during the Asian session we could observe ascending move toward the 1.2812 level.The EUR/USD did not manage to hold this level and we could observe bearish mood in early European session. We expect to see price at 1.2825 today. Presently we can observe the end of the 4 wave so we need to be prepared for 5 wave (coloured blue). In accordance with our wave rules and taking into account that the wave 5 retraces 100% of the wave 1, we can define the potential targets with measuring 1 wave with Take Profit 1 at 1.2689 (78.6% of wave 1) and Take Profit 2 at 1.2649 (100% of wave 1). The resistance level at 1.2870 can be used as Stop Loss.

Support and Resistance levels
(S3) 1.2585 (S2) 1.2643 (S1) 1.2679 (PP) 1.2736 (R1) 1.2794 (R2) 1.2830 (R3) 1.2887

Trading Forecast
Proceeding from Elliott Wave Rules this week the trend is expected to begin the downward movement. That is why Short positions at level 1.2845 with Stop Loss at 1.2870, Take Profit 1 at 1.2689 and Take Profit 2 at 1.2649 are recommended

Performed by Nicola Delic, Analytical expert
InstaForex Companies Group © 2007-2012
 

bhanu545

Master Trader
Nov 3, 2010
2,773
0
72
GBP/USD Intraday Technical Analysis 2012-05-21

gbpusd(1).png

The spot rate is currently testing the upper limit of its medium term bearish channel at 1.5830 and seems to initiate a decline. However, a break through these levels will release good potential and initiate a violent bullish trend.

Technical indicators provide sell-signals but until the resistance is not broken the assumption of a decline is most likely. Bollinger bands have greatly tightened in recent days showing a decline in volatility and the imminence of a violent movement.

According to previous events the market will provide a bullish opportunity as soon as the spot rate has broken through its resistance of 1.5830 with the 1st objective at 1.5890 and then at 1.5910. A break through 1.5810 will invalidate this scenario.

Performed by Albert Fitoussi, Analytical expert
InstaForex Companies Group © 2007-2012
 

bhanu545

Master Trader
Nov 3, 2010
2,773
0
72
GBP/USD Intraday Technical Analysis 2012-05-22

gbpusd.png

The spot rate is currently testing the upper limit of its medium term trading range at 1.5840 and seems to initiate a decline. However, a break through these levels will release good potential and initiate a violent bullish trend.

Technical indicators provide buy-signals but until the resistance is not broken the assumption of a decline is most likely. Bollinger bands have greatly tightened in recent days showing a decline in volatility and the imminence of a violent movement.

According to previous events the market will provide a bullish opportunity as soon as the spot rate has broken through its resistance of 1.5840 with the 1st objective at 1.5900 and then at 1.5920. A break through 1.5820 will invalidate this scenario.

Performed by Albert Fitoussi, Analytical expert
InstaForex Companies Group © 2007-2012
 

bhanu545

Master Trader
Nov 3, 2010
2,773
0
72
EUR/USD Intraday Technical Analysis 2012-05-22

eurusd.png

The spot rate is currently testing the upper limit of its medium term bearish channel at 1.2810 and seems to initiate a decline. However, a break through these levels will release good potential and initiate a violent bullish trend.

Technical indicators provide buy-signals but until the resistance is not broken the assumption of a decline is most likely. Bollinger bands are much discarded as a result of a strong increase these days. Stabilization is expected in a short term.

According to previous events the market will provide a bullish opportunity as soon as the spot rate has broken through its resistance of 1.2810 with the 1st objective at 1.2870 and then at 1.2890. A break through 1.2790 will invalidate this scenario.

Performed by Albert Fitoussi, Analytical expert
InstaForex Companies Group © 2007-2012
 

bhanu545

Master Trader
Nov 3, 2010
2,773
0
72
EUR/USD Elliott Wave Count for May 23, 2012

EURUSD_-_Primary_Analysis_-_May-23_1142_AM_(90_min).png

EUR/USD Elliott Wave
From May of 2011 the EUR/USD pair was trading in bearish mood, yesterday this major pair pushed lower again reaching new low at the 1.2657 level. During the European session we could observe descending move towards the 1.2740 level (100EMA support). Therefore during the New York session the EUR/USD pair continued trading in a bearish mood and we could observe price below the 1.2660 level. Today during the Asian session we could observe price at the 1.2615 level. We can consider this move as the end of 5 wave. Presently we are in the A wave (coloured blue) and I expect to see end of this corrective wave at 200EMA resistance. We can use 1.2770 as a Take Profit point and 1.2615 as Stop loss point. Also it is necessary to consider the data concerning the CAD Core Retail Sales m/m, Retail Sales m/m and the U.S. New Home Sales, Crude Oil Inventories that can affect the rate of the pair.

Support and Resistance levels
(S3) 1.2679 (S2) 1.2682 (S1) 1.2683 (PP) 1.2685 (R1) 1.2688 (R2) 1.2689 (R3) 1.2691

Trading Forecast
Proceeding from Elliott Wave Rules this week the trend is expected to begin the upward movement. That is why Long positions at level 1.2670 with Stop Loss at 1.2615 and Take Profit at 1.2770 are recommended.

Performed by Nicola Delic, Analytical expert
InstaForex Companies Group © 2007-2012
 

bhanu545

Master Trader
Nov 3, 2010
2,773
0
72
GBP/USD around 61.8% Fibonacci, for May 22, 2012

gbpusdmay23.gif

The Pound sterling, which fell to its low on March 15, is nearly completing the 61.8% Fibonacci retracement, and is very close to the first support 1.5657.

Weekly in view of that the pound sterling is at a key level of change trend, we recommend buying the weekly support line or fibonacci 61.8%, with targets up to 1.6050, we must add, that the trend of GBP / USD bearish long-term continuous, we can interpret the rebound as a pullback to the uptrend line was broken. as we see in the graph.

The Momentum indicator is very oversold and is likely to bounce upwardly within the next few hours.

Performed by Gerardo Porras, Analytical expert
InstaForex Companies Group © 2007-2012
 

bhanu545

Master Trader
Nov 3, 2010
2,773
0
72
EUR/USD Elliott Wave Count for May 24, 2012

EURUSD_-_Primary_Analysis_-_May-24_1052_AM_(1_hour).png

EUR/USD Elliott Wave
The EUR/USD pair was trading in a downward move yesterday developing 3 wave (coloured blue). During the European session we could observe descending movement towards the 1.2615 level where this major found support and pushed slightly higher .Therefore during the New York session the EUR/USD pair continued trading in a bearish mood reaching a new low at the 1.2545 level.Today during the Asian session this major make a one more downside push reaching 1.2515. We can consider this move as end of 3 wave (coloured blue). Presently we can observe starting of 4 wave (coloured blue). In accordance with our wave rules and taking into account that the wave 4 retraces 50% of the wave 3, we can define the potential targets with Fibonacci retracement (1.3065-1.2515) with Take Profit at 1.2839 (50% of wave 3). The end of the 3 wave at 1.2515 can be used as Stop Loss. Also it is necessary to consider the data concerning the U.S. Core Durable Goods Orders m/m, Unemployment Claims, Durable Goods Orders m/m, Flash Manufacturing PMI, FOMC Member Dudley Speech, Treasury Sec Geithner Speech and EU ECB President Draghi Speech, and the Belgium NBB Business Climate that can affect the rate of the pair.

Support and Resistance levels
(S3) 1.2461 (S2) 1.2516 (S1) 1.2550 (PP) 1.2604 (R1) 1.2659 (R2) 1.2693 (R3) 1.2747

Trading Forecast
Proceeding from Elliott Wave Rules this week the trend is expected to begin the upward movement. That is why Long positions at level 1.2585 with Stop Loss at 1.2515 and Take Profit at 1.2839 are recommended.

Performed by Nicola Delic, Analytical expert
InstaForex Companies Group © 2007-2012
 

bhanu545

Master Trader
Nov 3, 2010
2,773
0
72
GBP/USD Intraday Technical Analysis 2012-05-24

gbpusd.png

The spot rate is currently testing the upper limit of its medium term bearish channel at 1.5700 and seems to initiate a decline. However, a break through these levels will release good potential and initiate a violent bullish trend.

Technical indicators provide sell-signals and until the resistance is not broken the assumption of a decline is most likely. Bollinger bands have greatly tightened in recent days showing a decline in volatility and the imminence of a violent movement

According to previous events the market will provide a bullish opportunity as soon as the spot rate has broken through its resistance of 1.5700 with the 1st objective at 1.5760 and then at 1.5780. A break through 1.5680 will invalidate this scenario.

Performed by Albert Fitoussi, Analytical expert
InstaForex Companies Group © 2007-2012
 

bhanu545

Master Trader
Nov 3, 2010
2,773
0
72
EUR/USD Intraday Technical Analysis 2012-05-25

eurusd(1).png

The spot rate is currently testing the lower limit of its medium term bearish channel at 1.2480 suggesting a rebound. However, a break through these levels will release good potential and initiate a more violent bearish trend.

Technical indicators do not provide clears signals but are approaching the oversell zone supporting the assumption of a rebound. Bollinger bands are much discarded as a result of a strong decline these days. Stabilization is expected in a short term.

According to previous events the market will provide a bullish opportunity at the level of 1.2480 with the 1st objective at 1.2540 and then at 1.2560. A break through 1.2460 will alter this scenario.

Performed by Albert Fitoussi, Analytical expert
InstaForex Companies Group © 2007-2012
 

bhanu545

Master Trader
Nov 3, 2010
2,773
0
72
GBP/USD 1.6047 is 61.8% Fibonacci Retracement (Weekly Strategy)

gbpusdmay25.gif

The British pound has broken the long-term bullish channel which shows there can be deeper downward sequence, in view of that the pair is in oversold area and the momentum indicator is showing bullish signals, which are more likely to return to the area of 61.8% retracement Fibonacci (sequence of maximum 1.6301 - 1.5638 the lowest so far)
Therefore, we recommend selling in the zone around 61.8%of 1.6047 to long-term goals to 1.5267.
We should add that the pair is forming a figure reversal technique, which has the objective of 1.5200. You can visualize on the graph.

Performed by Gerardo Porras, Analytical expert
InstaForex Companies Group © 2007-2012
 

bhanu545

Master Trader
Nov 3, 2010
2,773
0
72
EUR/USD Intraday Technical Analysis 2012-05-28

eurusd.png

The spot rate is presently testing the intermediate resistance of its medium term bearish channel at 1.2620 and seems to initiate a decline. However, a breakthrough of these levels will release significant potential and enabling to reach its upper limit in 1.2680.

Technical indicators do not provide clear signals but as long as the resistance is unbroken, the assumption of a decline is relevant. Bollinger bands have greatly tightened in recent days showing a decline in volatility and the imminence of a violent movement.

According to previous events the market will provide a bullish opportunity as soon as the spot rate has broken through its resistance of 1.2620 with the 1st objective seen at 1.2680 and then at 1.2700. A break through 1.2600 will invalidate this scenario.

Performed by Albert Fitoussi, Analytical expert
InstaForex Companies Group © 2007-2012
 

bhanu545

Master Trader
Nov 3, 2010
2,773
0
72
GBP/USD Intraday Technical Analysis 2012-05-28

gbpusd.png

The spot rate is presenlty testing the upper limit of its medium term bearish channel at 1.5720 and is about to decline. However, a break through these levels will release significant potential and initiate a violent bullish trend.

Technical indicators provide sellers signals and as the resistance remains unbroken, the assumption of a decline is very likely. Bollinger bands are much discarded due to the strong recent increase. The situation is expected to stabilize soon.

Considering previous events, the market will provide a bullish opportunity as soon as the spot rate will has broken through its resistance of 1.5720 with the1.5780 and 1.5800 seen as first targets. A breakthrough 1.5700 will invalidate this scenario.

Performed by Albert Fitoussi, Analytical expert
InstaForex Companies Group © 2007-2012