USDCAD: Moving with Momentum

sharabela

Master Trader
Oct 19, 2016
152
9
54
46
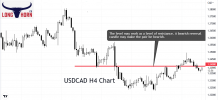
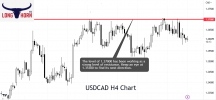
# 1.32300 has been working as a level of support

# A bearish trend line is in play

# Pair may find its next support at 1.31500


USDCAD after being bearish in the H4 chart has been traded around the level of 1.32300. The price has found its resistance around 1.33200. If the level produces a strong bearish reversal pattern, it may end up making a bearish breakout at the level of 1.32300. A bearish breakout may attract the sellers to go short in the pair and drive the price towards the South. The H4 chart shows that there is enough space for the price to travel towards the downside. Thus, the next bearish move may generate good momentum. The pair may find its next support around 1.31500.

On the other hand, if the level of 1.32300 produces a strong bullish reversal pattern followed by a good bullish move, the buyers may wait for the price consolidate or bearish correction to go long from value areas.

As things stand with the pair, it seems that the Bear may resume its move.
clonghornfx.usdcad.png
 

sharabela

Master Trader
Oct 19, 2016
152
9
54
46
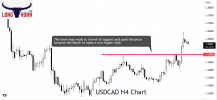
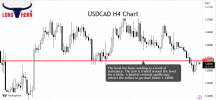
# 1.34500 has been working as a level of resistance

# Keep an eye at 1.34000 to get a bearish reversal candle

# A bearish breakout below 1.33550 may make it bearish


USDCAD found its resistance around 1.34500 and made a bearish move. The pair had a bounce at 1.33500. It may consolidate now. The level of 1.34000 may work as resistance. If the level produces a bearish reversal candle closing below the level of 1.33500, the pair may get more bearish and head towards the South. The H4 chart shows that it may find its next support around 1.32300.

On the other hand, if the price breaches 1.34000, the buyers may keep their eyes in the pair to go long upon having breakout confirmation followed by a bullish reversal candle around the breakout level. The H4 chart shows that the price may find its next resistance around 1.33500 again.

Considering both charts, it seems that the Bear has an upper hand and it may make another good move towards the South.clonghornfx.usdcad.png
 

sharabela

Master Trader
Oct 19, 2016
152
9
54
46
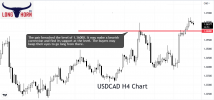
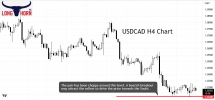
# 1.35000 has been breached and it now may hold the price as support

# 1.40000 may work as a level of resistance


USDCAD made a very significant breakout at 1.35000. The H4 chart shows that the price produced consecutive H4 bullish candles and made the breakout with a bullish Marubozu candle. The price seems to be having a bearish correction. It may find its support at the breakout level. Thus, the buyers may wait for the price to produce a bullish reversal pattern at the level of 1.35000 to go long in the pair again. The chart shows that the price has enough space to travel towards the North. It may find its next resistance around 1.40000. Traders must remember that 1.40000 is probably the most important level around.

On the other hand, if the price breaches the level of 1.35000, the pair may get choppy for a while to find its next direction.

Considering the chart, it looks that the Bull may dominate in the pair.clonghornfx.usdcad.png
 

Attachments

  • clonghornfx.usdcad.png
    clonghornfx.usdcad.png
    39.7 KB · Views: 0

sharabela

Master Trader
Oct 19, 2016
152
9
54
46
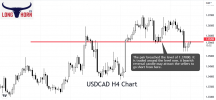
# 1.36700 has been working as a level of resistance.

# 1.36000 may hold the price as a level of support.

# A bullish trend line is in play.


The pair has been very bullish in the H4 chart. It seems to have found its resistance around 1.36700. Upon having a rejection, it produced two consecutive bearish candles. The level of 1.36400 produced a bullish spinning top. The buyers may keep their eyes in the pair to go long above 1.36700. However, if the chart does not make a bullish breakout at the resistance, it may continue its bearish correction and find its support around 1.360000. A bullish reversal pattern at that level may attract more buyers to go long and push the price towards the North. The pair may find its next resistance around 1.38000.

On the other hand, if the price breaches the level of 1.36000, the pair may get choppy.clonghornfx.usdcad.png
 

sharabela

Master Trader
Oct 19, 2016
152
9
54
46
# 1.35700 may work as a level of resistance

# 1.34000 may hold the price as a level of support


USDCAD made a significant bearish move by making a bearish breakout at 1.35700. The pair is traded around the level as of writing. The sellers may keep their eyes in the pair to get a bearish reversal candle to go short. The H4 chart shows that there is enough space for the price to travel towards the South. It may find its next support around 1.34000.

On the other hand, if the price breaches the level of 1.35700, the buyers may find long opportunity and push the price towards the North. The price may find its resistance around the level of 1.37000.

Considering both charts, the bear has more space to travel towards the South. It means that it may attract more sellers to go short upon having a bearish reversal candle at the key level.clonghornfx.usdcad.png
 

sharabela

Master Trader
Oct 19, 2016
152
9
54
46
# 1.37000 has been working as a level of resistance

# The pair may get choppy within 1.37000- 1.35300


USDCAD seems to have found its resistance at 1.37000. The pair had several rejections at the level. At its last rejection, it produced a bearish engulfing candle. However, the pair did not produce any bearish momentum for the sellers. Keep an eye at the level of 1.35300. A bearish breakout followed by breakout confirmation may attract the sellers to go short in the pair. In case of a bearish breakout, the pair may find its next support around 1.34000.


On the other hand, if the price bounces at 1.35300, it may head towards the North and find its resistance around 1.37000 again. As things stand, it does not seem like that the price makes a bullish breakout at 1.37000.

Considering the chart, the pair may be traded within 1.37000-1.35300 to close the year.clonghornfx.audusd.png
 

sharabela

Master Trader
Oct 19, 2016
152
9
54
46
# 1.35375 has been working as a level of resistance

# The sellers may go short below 1.34850


USDCAD made a good bearish move in the H4 chart. The pair had a bounce at 1.34850 and made a bullish correction. The pair has been traded around the level of 1.35375. The H4 chart shows that the price reacted at this level several times. Thus, the sellers may keep their eyes in the pair to go short if the level produces a bearish reversal candle. The sellers may go short below the level of 1.34850. The price may find its next support around 1.34000.

On the other hand, if the price goes above 1.35375, the buyers may push the price towards the North as far as intraday minor charts are concerned. It means the pair may extend its bullish correction. It may end up making the H4 chart choppy for a while.

Considering the scenario, it seems that the Bear has an upper hand here. Let us wait and watch how the pair finishes the year.clonghornfx.usdcad.png