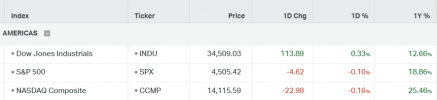
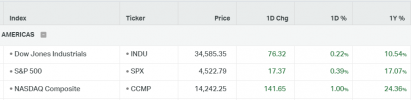
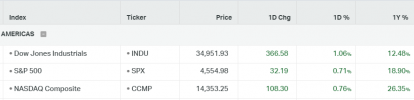
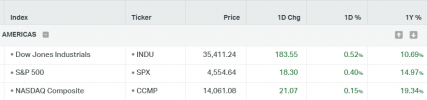
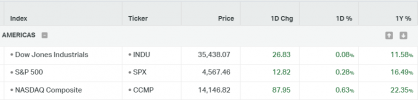
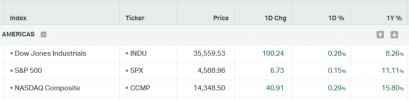
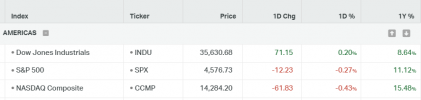
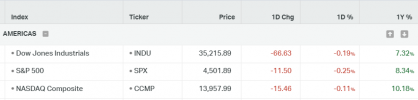
"Asia-Pacific Markets Rise on Softer US Inflation Data, Global Stocks Gain Amid Signs of Inflation Slowdown"
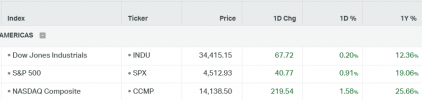
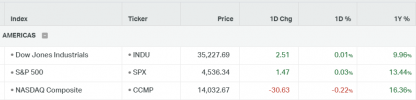
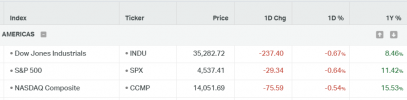
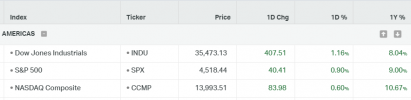
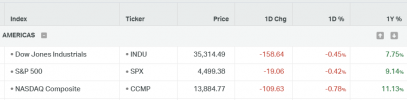
Asia-Pacific markets experienced gains on Friday as new inflation data from the U.S. turned out to be softer than expected. This development has raised optimism that inflation may decrease without negatively impacting the labor market. Globally, stocks rose throughout the week due to the lower-than-expected U.S. consumer price index and producer price index, signaling a significant deceleration in inflation within the world's largest economy.
In June, the U.S. producer price index increased by a smaller margin than predicted, rising 0.1% year on year. The core PPI, which excludes volatile food and energy prices, also climbed by 0.1%, falling short of expectations.
Christopher Waller, a Governor of the Federal Reserve Board, expressed the belief that two more interest rate hikes are necessary to bring inflation down to the desired level. During a speaking engagement at New York University, he welcomed the recent reading of the consumer price index, which indicated a moderation in the inflation rate. However, he emphasized the importance of sustained improvement before expressing confidence in the deceleration of inflation.
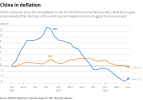
The International Monetary Fund stated that China's growth is slowing due to weakened private investment, declining exports, and reduced domestic demand.
The Reserve Bank of Australia announced on Friday that Michele Bullock, the deputy governor, has been appointed as the new chief of the central bank, as revealed by the country's Treasury.
Investors have also been evaluating data from the U.K. this week. Wage growth in the country has been significant, raising concerns for the Bank of England as it grapples with the highest inflation among the Group of Seven nations. Meanwhile, the economy experienced a 0.1% contraction in May, slightly better than the consensus estimate of a 0.2% contraction.

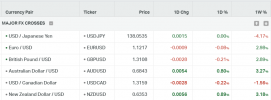
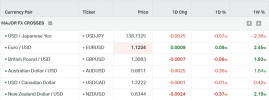
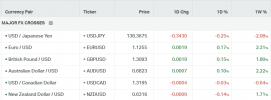
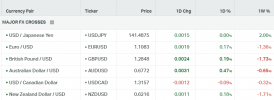
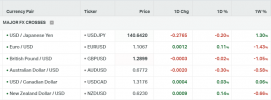
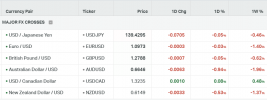
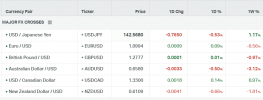
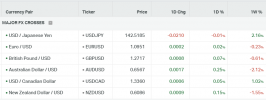
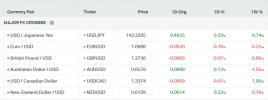
EURUSD
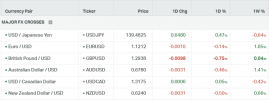
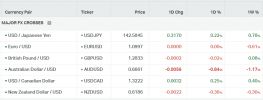
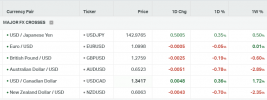
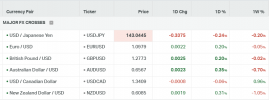
The US Dollar (USD) has continued its downward trend for the seventh consecutive day, driven by expectations of the Federal Reserve (Fed) soon concluding its policy-tightening measures. Investors are now strongly convinced that the US central bank will maintain interest rates at their current level for the remainder of the year, following the anticipated 25 basis points increase in July. This has resulted in a significant drop in US Treasury bond yields and has pushed the USD to a 15-month low. Consequently, this decline is considered a significant factor contributing to the strength of the EUR/USD pair.
In contrast, the minutes of the June meeting held by the European Central Bank (ECB) revealed that policymakers are determined to continue raising interest rates beyond July in order to address inflation and bring it back to the target level. It is worth noting that the ECB's economic projections in June indicated that inflation is expected to remain above the 2% target until the end of 2025. Despite emerging signs of an economic slowdown, this hawkish stance continues to bolster the euro (EUR) and provide additional strength to the EUR/USD pair.
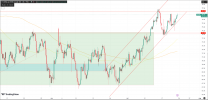
The EUR/USD maintained its bullish momentum, reaching the 1.1245 level, which coincides with the upper parallel of the current bullish channel. The second leg of the movement is currently hovering around 3.70%, slightly higher than the previous leg's 3.50%. After this rapid bullish movement, a correction toward the 1.1100 level appears likely.
| Resistance 3 | Resistance 2 | Resistance 1 | Support 1 | Support 2 | Support 3 |
| 1.1200 | 1.1150 | 1.1100 | 1.1000 | 1.0920 | 1.0880 |

The US Dollar (USD) remains under selling pressure, resulting in a 15-month low, as the market anticipates the Federal Reserve (Fed) concluding its policy tightening cycle. On the other hand, the British Pound (GBP) gains support amid speculation of further interest rate hikes by the Bank of England (BoE) to tackle inflation. This supports the GBP/USD pair's upward trend. Market sentiment indicates that the Fed will keep interest rates steady after an anticipated increase in July, while the BoE may raise rates to control demand and lower inflation. Economic data and consumer sentiment will influence the currency pair, but overall, the GBP/USD pair is set for strong gains and looks to end the week positively for the second consecutive time.
Similar to other major currency pairs, the GBP/USD faced resistance at 1.3150 after surpassing the significant level of 1.3000. A correction towards 1.3000 appears to be more likely. The next long-term resistance level is 1.3210, and additionally, we observe the 200MA on the weekly chart, where a candle closing above it is needed to confirm further upward movement.
| Resistance 3 | Resistance 2 | Resistance 1 | Support 1 | Support 2 | Support 3 |
| 1.3310 | 1.3200 | 1.3000 | 1.2650 | 1.2540 | 1.2460 |

The Japanese Yen received a boost from a couple of developments in Japan. Firstly, there was a media report indicating that the Bank of Japan is likely to revise its inflation forecast for FY2023 to a level above 2% during the meeting scheduled for July 27 and 28. Until now, the Bank has consistently maintained its stance that the Consumer Price Index (CPI) would decline from around September/October this year. However, if this expectation is revised to a level above the 2% target, it would undermine one of the pillars supporting the continuation of ultra-loose monetary policy.
Additionally, during the session, Bloomberg conducted an interview with Hideo Hayakawa, a former chief economist and director at the Bank of Japan. Hayakawa expressed his anticipation that the Bank of Japan's policy board "will make some kind of adjustment to YCC this month," suggesting that adjusting the yield control by setting the tolerance band for the 10-year yield from 0.5% on either side of zero to 1% is a likely approach.
Shifting the focus to central banks, Federal Reserve Board Governor Christopher Waller addressed his economic and policy outlook during a speech before the Money Marketeers of New York University in the evening, Eastern time. Please refer to the previous posts for his specific remarks, but notably, Waller mentioned that the upcoming September Federal Open Market Committee (FOMC) meeting is significant. However, he also highlighted that if the next two Consumer Price Index (CPI) readings resemble the previous two, the data would suggest a possible halt to certain actions.
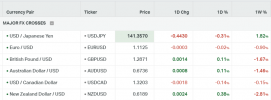
The USD/JPY pair has received support at the notable historical level of 138.00 after experiencing six consecutive days of decline. Currently, a corrective movement is underway, with the initial level located at 138.70, followed by 140.25. Additionally, both the 2-year and 10-year yields are undergoing corrections, which appears to be beneficial for the pair as well.
| Resistance 3 | Resistance 2 | Resistance 1 | Support 1 | Support 2 | Support 3 |
| 142.00 | 141.20 | 140.22 | 139.00 | 138.00 | 136.00 |

XAUUSD
Despite the release of the soft inflation and Producer Price Index (PPI) report for June, the precious metal has been unable to take advantage of the situation, indicating that household demand remains subdued and the path towards achieving the 2% inflation target remains intact.
Although the US Dollar Index (DXY) has experienced a significant decline, gold prices are struggling to recover. The DXY has dropped below the psychological level of 100.00 and is currently hovering around 99.65. The anticipation of only one interest rate hike announcement from the Federal Reserve (Fed) by the end of the year has caused a sharp decline in the USD Index.
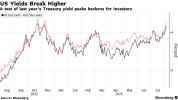
Contrary to investors' expectations, Fed Governor Christopher Waller expressed confidence in the need for two additional interest rate hikes this year to curb inflation and bring it down to 2%. Waller's hawkish comments have contributed to a rise in US Treasury yields, with the yield on 10-year US Treasury bonds reaching approximately 3.77%.
Gold found strong resistance at the 1960 and formed a bearish pattern that may lead to a temporary correction toward the 1940. Gold is still bullish and may continue toward the next resistance of 1970 and followed by the 1980. But a first correction seems needed.
Although the US Dollar Index (DXY) has experienced a significant decline, gold prices are struggling to recover. The DXY has dropped below the psychological level of 100.00 and is currently hovering around 99.65. The anticipation of only one interest rate hike announcement from the Federal Reserve (Fed) by the end of the year has caused a sharp decline in the USD Index.
Contrary to investors' expectations, Fed Governor Christopher Waller expressed confidence in the need for two additional interest rate hikes this year to curb inflation and bring it down to 2%. Waller's hawkish comments have contributed to a rise in US Treasury yields, with the yield on 10-year US Treasury bonds reaching approximately 3.77%.
Gold found strong resistance at the 1960 and formed a bearish pattern that may lead to a temporary correction toward the 1940. Gold is still bullish and may continue toward the next resistance of 1970 and followed by the 1980. But a first correction seems needed.
| Resistance 3 | Resistance 2 | Resistance 1 | Support 1 | Support 2 | Support 3 |
| 1982 | 1970 | 1960 | 1931 | 1920 | 1904 |

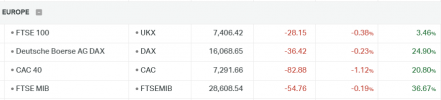
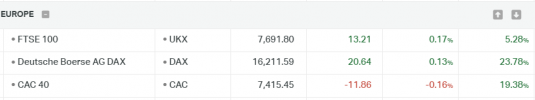
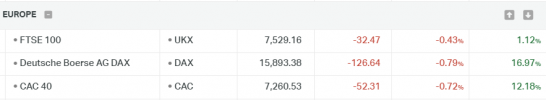
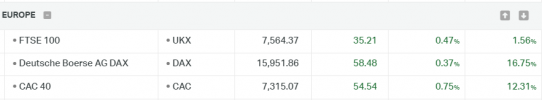
DAX40
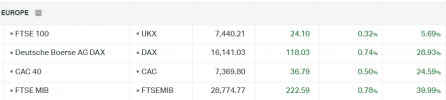
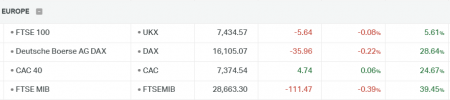
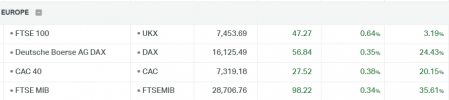
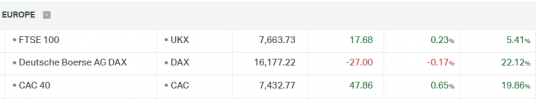
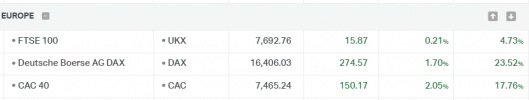
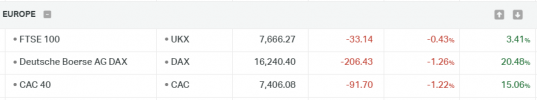
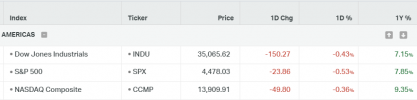
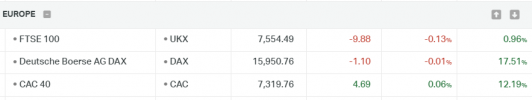
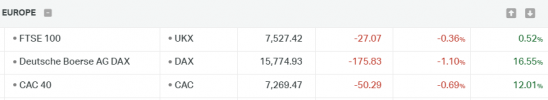
European shares experienced a slight decline on Friday, although they were still on track to achieve their largest weekly percentage increase in more than three months. This optimistic outlook was fueled by expectations that the Federal Reserve would soon cease its interest rate hikes due to the alleviation of inflationary pressures.
Earlier this week, data regarding consumer and producer prices in the United States sparked speculation that the economy was entering a phase of disinflation, leading to the possibility of the Fed pausing its tightening measures shortly after July.
As the earnings season commences, luxury British retailer Burberry announced a notable 18% growth in sales revenue for the quarter ending on July 1.
The DAX faces a significant challenge of surpassing the 16,400 level. In the short term, the DAX remains bullish due to the prevailing risk-on sentiment in the markets, but Q2 earnings are awaited to confirm whether or not there will be more momentum.
| Resi Level 3 | Resi Level 2 | Resi Level 1 | Suppo level 1 | Suppo level 2 | Suppo level 3 |
| 16800 | 16600 | 16370 | 15650 | 15400 | 15200 |