In search of minimum wage

hayseed

Master Trader
Jul 27, 2010
1,175
278
149
usa
Can you help me build the list?

Higher:
• Fresh Signals in higher timeframes
• existence of a very over drawn downtrend and stale counts
•near term strength starting to show itself on the daily TF.

Lower:
• dollar rates are likely to continue to increase, but I don’t like using fundamentals because I know so little
• larger timeframes clearly show weakness in The EUR. Yes it is a long down trend, but an object in motion tends to stay that way.
• current Daily surge, at least among the quicker indicators (JJMA, JFATL, ALMA) is past/hitting the stale count area and could signal the end of this surge.

I suppose a lot of things depend on what you mean too. Is this a daily look to send a grid for the next day? Or is it to send a grid for the next few months/weeks.

If the former and for a shorter term grid, I would certainly be wary of shorting, because something is giving the EUR strength. If the latter, I would create a net short grid despite knowing I may be in Drawdown for a while before the current upward impuls corrects
//-----

lol...... you sure put more thought in it than me.....

i was just thinking about trying to take a 100$ account , place one 0.01 trade every day making 1$ and see where it stood in 100 days.....

similar to the the angle if incidence ...... fun trading from years ago....

yep, we can build a list..... might help to think in pure definable terms...... things like fresh, stale, very over drawn, strength, and surge are subject to interpretation.....

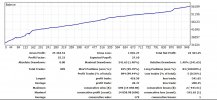
100$.... 1 trade per day..... 1$ per day..... 100 days..... sounds silly i know...... but wonder how many said the same thing about minimum wage......

gotta start somewhere..... 1 is as good a place as any.....h
 

TradeChaser

Active Trader
May 12, 2020
169
6
34
32
My trade... 12 pip target (I'm in aggressive mode lol).

1658465868577.png
1658465918103.png
Post automatically merged:

Fair points on the loose terminology. I hate that I do that. I will say that any time I am talking "stale" or "fresh", and am talking about what I think the counts would be based on the chart.

Fresh would mean that counts are below their average value. Stale would mean they are likely at or exceed their average values. Overdrawn is the same as stale, so don't know why I wouldn't have just said as much. Strength and weakness are subjective. I would say a chart going downward shows a weakness in strength. Don't know what I attribute it to, but you can't argue there is clear weakness. Again, that's pretty unclear language.
 

TradeChaser

Active Trader
May 12, 2020
169
6
34
32
While I think my trade will hit it's target, I will say that I think it quite likely that this candle get's filled before long

1658466383179.png
 
  • 👍
Reactions: hayseed

hayseed

Master Trader
Jul 27, 2010
1,175
278
149
usa
If the former and for a shorter term grid, I would certainly be wary of shorting, because something is giving the EUR strength.
//-----

the appearance of strength can be deceptive..... sometimes if the market movers back out and stop selling, small traders might perceive that as a bottom and begin buying it up..... the market movers later move in selling again..... cat and mouse.....

by grid i meant, once a daily or weekly top is in place to sell the 240 retraces in some manner..... this can be done by placing sell limits in the top 50% of prior leg , or boxed fibonaccia levels, or simply covering the entire last daily bar....

quit this practice once the daily has a new down leg.....

it works best when the weekly has topped...... the next millionaire making trades will involve the jpy..... that's going to be the short squeeze of all times.....h
//-----

eurusd-d1-oanda-division1-1440.png


//-----
eurusd-h4-oanda-division1-240.png
 

hayseed

Master Trader
Jul 27, 2010
1,175
278
149
usa
My trade... 12 pip target (I'm in aggressive mode lol).
//-----

aggressive mode...... is that like a bull in a china shop.....

precision mode might work out better.....

surgeons are paid better than butchers.....

lets move this to code works thread.....h
 

hayseed

Master Trader
Jul 27, 2010
1,175
278
149
usa
must have forgot to post prior week, so here are both.....

managed to squeeze out minimum wage this week but not much more.....

small apple is still better than no apple at all.....h
//----

7/15 week
//----
7 15.jpg

//----

7/23 week...
//---
7 16.jpg

//----
 

hayseed

Master Trader
Jul 27, 2010
1,175
278
149
usa
not much to see here this week..... when the stars don't align, they just don't align....

time is on my side.....h
//-----

7 30 22.jpg
 

hayseed

Master Trader
Jul 27, 2010
1,175
278
149
usa
hey john...... started a pm but it got so long, just moved here......

i'm not sure how, or if even possible, to know when trends begin and end......

and my losses at those points prove it.....

i use moving averages on multiple timeframes to help me stumble on to trends..... still it's not easy....

looking backwards in the chart trends are sometimes clear but looking forward they seldom are.....

i don't try to make much per day so occasional intraday overnight trends are perfect....

one thing i use on intraday is the (20) period hull ma, (20) period sma and (10) period sma.... i start watching during the asian session and see if it continues into the london..... london open is 2am for me...... both the mnqh5 and mesh5 charts below show it.....

that idea falls apart once new york opens.... it will not work for me except overnight asian/london.....

a single micro nq future pays 2$ a point..... 100 points would be 200$..... i'm perfectly happy with 200$ a day...... once the trade is in that area, i put on a trailing stoploss and let it run.....
//----

another example is a larger period moving average, 50 or 100 periods along with the alma and 20 period hull ma..... i try to wait till all 3 agree......
//------

and keep in mind, i like knowing where things stand on all timeframes.......

examples would be, the last chart showing ym, es, nq and rty......

where is the price relative to the ichi cloud..... at a glance i can see.....

is the awesome oscillator rising or falling and current count for many bars.....

is the zigzag up or down.....

is the 200 sma rising or falling......

is the alma rising or falling and for how many bars......

and last, are the 5, 10, 20 and 200 smas properly aligned and moving in same direction..... such as, 5 above 10, 10 above the 20, 20 above the 200 and all are moving up.....

does knowing all that really help, maybe not.....
//------

those first two 15 minute charts below are plenty enough for me.... without even looking further you can easily visualize what the 1, 5, 30 and 60 minute charts must look like.....

the hard part for me is waiting for that chart...... i'm not that good of a trader.....h
//-------

this is the hma(20), sma(10) and sma(20)..... the only time i use it is 3 or 4 hours before and after the london open, 2am for me.....

Screenshot 2024-12-19 205020.png

//-----

the only time i use it is 3 or 4 hours before and after the london open, 2am for me.....

Screenshot 2024-12-19 214258.png

//------


this is the hma(100), alma and hma(20)...... i use it when higher timeframes agree.....
Screenshot 2024-12-19 210845.png

//-------

this is not at all necessary, it's just me being lazy......

Screenshot 2024-12-19 211425.png

//------
 
  • ℹ️
Reactions: Enivid

hayseed

Master Trader
Jul 27, 2010
1,175
278
149
usa
hey john..... update from last night....

4 hours before the london open, around 10am my time, things began setting up..... i marked up with my best guess as to outcome.....

then, at london open it all fell apart..... might of had something to do with that last second US congress budget vote.....

this is why a trailing stop protecting at least some of the profit is so helpful.....

then, at the new york open, it reversed again...... cpi news......

that sort of wishy washy nonsense will kill me every time......

the 200$ slow boat to china laid back asain session is all i need......

but it does not always work.....h
//------
//------
Screenshot 2024-12-20 110346.png

//-----

Screenshot 2024-12-20 110628.png
//------
 

hayseed

Master Trader
Jul 27, 2010
1,175
278
149
usa
this will explain the other chart in detail as to what i focus on......

it's not really needed..... it's just plain common sense......h

//----

the first column has the timeframes listed but the color relates to the 200 sma direction..... blue up...... red down.....

Screenshot 2024-12-20 113207.png
//------

the second column is still under construction...... it shows the alma trend and current count...... blue if alma is up ..... red if down..... the number is the current count.....

here the words up and dn are a waste, color depicts direction.....


Screenshot 2024-12-20 105145.png

//----

the next column is the last zigzag leg..... blue depicts up, red depicts down......here again the words up/dn are a waste....

Screenshot 2024-12-20 105226.png

//------

the next column is whether the 5, 10, 20 and 200 are moving in proper order mention before...... blue if they are and all are moving up...... red if they are and all are moving down....... yellow if they are not perfectly aligned.....


Screenshot 2024-12-20 105728.png

//------

the next column is the awesome oscillator...... blue if moving up or red moving down...... number is current count,.......

Screenshot 2024-12-20 105931.png

//-----


the last is the ichi cloud..... blue if price is above...... red if it's below....... yellow if it's in the cloud......

Screenshot 2024-12-20 105958.png

//----------
 

hayseed

Master Trader
Jul 27, 2010
1,175
278
149
usa
....h
//-----

Screenshot 2024-12-20 132822.png

//------

Screenshot 2024-12-20 132930.png
Post automatically merged:

How do you use the trailing stop? I have tried trailing stop before but mostly it takes too soon the profits...

//-----

hey john...... would think we all feel the same......

we can backtest some strategies with fair precision and include a trailing stop....... i can not say with confidence ever seeing a trailing stop improve realistic common sense performance..... yes of course it does improve sometimes...... but that can most often be to just a couple trades where it worked perfect......

for me, the trailing stop is just so i can put the trade out of my mind and move on......

i'm using the trailing stops in slow asain sessions..... the 1, 2, 3, 4, 5, 15 minute atrs are small......

in the case of tradovate, i just use a trailing price stop..... it's all we can use......

in the case of metatrader 5, i just let the trailing stop piggie back the psar or some ma...... there i use ea trailing stop type functions......

it's just to ease my mind, not to improve profitability......h