your question , at least to me, is something worth studying on.....
to predict the average number of signals next week , or any period, we must count the number of signals and divide that into the number of bars looked at.....
so if, we counted the number of times the tsr changed colors on the 30 minute chart over the past week and divided that into the number of bars we would know roughly the number of signals that might be expected next week.....
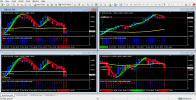
you can do it visually..... the chart below shows the tsrs on 4 time frames.....
using mq4 or mq5 you can get a much more precise value..... cause you can add important conditions..... the length of a 30 and 60 minute signal can be shorter or longer when it's with or against the 240 and 1440 signal...... or the 1 minute signal can be shorter or longer if it's with or against the 4 and 5 chart......
a example of that is in the mesu24 1 minute chart below...... it has the stochastic for the 1, 2, 3, 4 and 5 minute charts on top each other...... you can see as the higher tf's stochastic is falling, the 1 minute stochastic is effected.....
using mq4/mq5 you can also delete and extreme values..... i am really only interested the making sure the signal is long enough to reach my target......
there a dozens of useful, at least to me, ways to display those results.......
the whole point is for me to know just how attentive i must be......h
//-------

//-------