Daily News Updates by LQDFX

Daniel LQDFX

Trader
Jul 21, 2023
126
0
22
43

Daily News Update


14 December 2023​

Thursday​

On Thursday, December 14, 2023, the financial markets are set to experience a day of significant announcements globally. The series of key economic disclosures will commence with Australia revealing its latest employment change figures and the unemployment rate. Following this, the Swiss National Bank is scheduled to announce its policy rate decision. The focus will then shift to the United Kingdom, where the official bank rate will be declared. Subsequently, the European Union will announce its main refinancing rate. In the United States, critical economic data such as core retail sales m/m, total retail sales m/m, and unemployment claims are due for release. The day’s series of announcements will culminate with a press conference by the European Central Bank, marking a day full of potentially market-impacting news.​


AUD – Employment Change​

Job creation, a key driver of consumer spending, significantly impacts overall economic activity, as it influences the majority of consumer purchases and economic growth.

Australian Employment Soared Beyond Expectations in October: In a remarkable surge, Australia's employment figures for October 2023 outpaced market predictions, with a significant addition of 55,000 jobs, raising the total to 14.17 million. This performance, which was a marked acceleration from the 7,800 increase in September, saw part-time employment jump by 37,900, while full-time jobs experienced a growth of 17,000, indicating robust economic activity.

The forecast for the upcoming Employment Change suggests a decrease to 25K, down from the previous outcome of 55K.

The upcoming Employment Change data is scheduled for release on Thursday, December 14, 2023, at 12:30 AM GMT.

AUD – Unemployment Rate​

Though typically considered a lagging indicator, the unemployment rate is a crucial indicator of overall economic health, as consumer spending closely aligns with labor market conditions.

In October 2023, Australia's unemployment rate marginally increased to 3.7% amid a complex job market, despite the addition of 55,000 jobs and a climb in the participation rate to 67.0%, reflecting a robust yet nuanced employment landscape.

The forecast for the Unemployment Rate indicates it is expected to remain steady at 3.7%, unchanged from the previous figure.

The next release of Unemployment Rate data is scheduled for Thursday, December 14, 2023, at 12:30 AM GMT.

CHF - SNB Policy Rate​

Short-term interest rates are the primary factor in determining currency value, with traders typically analyzing other indicators mainly to forecast future rate changes.

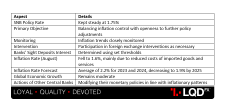
The Swiss National Bank (SNB) opted to keep the SNB policy rate steady at 1.75%, balancing inflation control with openness to further policy adjustments. They continued to monitor inflation trends and participated in foreign exchange interventions as necessary. Interest on banks' sight deposits was determined using set thresholds. In August, inflation had fallen to 1.6%, mainly due to reduced costs of imported goods and services. The forecast projected an average inflation rate of 2.2% for 2023 and 2024, dropping slightly to 1.9% by 2025. Meanwhile, global economic growth remained moderate, with central banks worldwide modifying their monetary policies in line with inflationary patterns.

TL;DR
CHF - SNB Policy Rate.png
The forecast for the SNB Policy Rate suggests it will remain unchanged at 1.75%, consistent with the previous rate.

The next SNB Policy Rate announcement is scheduled for Thursday, December 14, 2023, at 8:30 AM GMT.


CHF - SNB Press Conference​

This tool is a key method for the SNB Governing Board to communicate with investors about monetary policy and economic forecasts. Conferences, scheduled alongside rate announcements in June and December, last about an hour and consist of two segments: initial prepared statements followed by a press Q&A session, where unscripted responses can often lead to market volatility.

The SNB Press Conference is scheduled for Thursday December 14, 2023, at 09:00 AM GMT.


GBP - Official Bank Rate​

Traders primarily focus on short-term interest rates for currency valuation, considering other indicators mainly as tools to forecast future rate changes.

In its November meeting, the Bank of England decided to keep its benchmark interest rate at a 15-year peak of 5.25%, unchanged for the second time in a row, amid concerns over UK's slowing economy and high inflation. The 6-3 vote by the Monetary Policy Committee was against a proposed 25 basis points hike. The bank plans to continue its restrictive monetary policy to combat inflation, with a possibility of more tightening if necessary, while expecting modest economic growth in the near future.

The forecast suggests that the Official Bank Rate will remain unchanged at 5.25%, consistent with the previous rate.

The upcoming Official Bank Rate announcement is scheduled for Thursday, December 14th, at 12:00 PM GMT.


EUR - Main Refinancing Rate​

Short-term interest rates are the key determinant in currency valuation, with traders typically examining other indicators primarily to anticipate future rate changes.

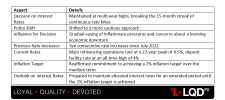
In its October meeting, the European Central Bank (ECB) had opted to maintain interest rates at multi-year highs, marking a notable departure from its 15-month streak of continuous rate hikes. This decision reflected a more cautious approach among policymakers, influenced by the gradual easing of inflationary pressures and concerns regarding a looming economic downturn. Prior to this decision, the ECB had implemented ten consecutive rate increases since July 2022, resulting in the main refinancing operations rate reaching a 22-year peak at 4.5%, and the deposit facility rate hitting an all-time high of 4%. The central bank reaffirmed its commitment to achieving its 2% inflation target over the medium term, emphasizing its readiness to keep interest rates at these elevated levels for an extended period until this goal was realized.

TL;DR
EUR - Main Refinancing Rate.png
According to the latest forecast, the Main Refinancing Rate is expected to remain steady at 4.5%, unchanged from the previous announcement, as announced in recent financial news.

The next Main Refinancing Rate announcement is scheduled for Thursday, December 14th, 2023, at 1:15 PM GMT.


USD - Core Retail Sales m/m​

Core Retail Sales month-over-month figures are closely monitored by traders as they offer insights into consumer spending, a major driver of economic expansion. By excluding the frequently fluctuating food and energy sectors, Core Retail Sales present a more reliable measure of underlying trends in consumer expenditure.

In October 2023, U.S. Retail Sales excluding motor vehicles and parts rose by 0.1% month-over-month, exceeding market expectations of a flat reading and following a 0.8% increase in the previous month.

The forecast for the upcoming Core Retail Sales m/m indicates a slight decrease to -0.1%, down from the previous figure of 0.1%.

The upcoming Core Retail Sales m/m announcement is scheduled for Thursday, December 14th, 2023, at 1:30 PM GMT.


USD - Retail Sales m/m​

This measure is the main indicator of consumer spending, which constitutes a significant portion of overall economic activity.

In October 2023, U.S. retail sales saw a 0.1% month-over-month decrease, ending a six-month streak of growth and performing better than the anticipated 0.3% decline. Key sectors experiencing downturns included miscellaneous store retailers (-1.7%), furniture stores (-2.0%), and motor vehicle dealers (-1.0%). However, gains in health and personal care stores (1.1%), food & beverage stores (0.6%), and electronics and appliances stores (0.6%) partially offset these declines. Year-over-year, retail trade growth slowed to 2.5% in October, down from September's revised 4.1%.

TL;DR
USD - Retail Sales m.m.png
The forecast for the US Retail Sales m/m is reading -0.1%, showing a reduction in the sales of major retailer categories.

The upcoming Retail Sales m/m announcement is scheduled for Thursday, December 14th, 2023, at 1:30 PM GMT.


USD - Unemployment Claims​

Despite being considered a lagging indicator, the unemployment rate is a crucial measure of the economy's health as consumer spending is closely linked to labor market conditions. Additionally, unemployment figures play a significant role in guiding the country's monetary policy decisions.

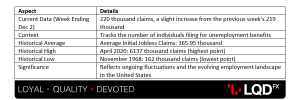
In the week ending December 2, 2023, the United States witnessed a slight uptick in Initial Jobless Claims, with the number rising to 220 thousand from the previous week's 219 thousand. This data, which tracks the number of individuals filing for unemployment benefits, demonstrates the ongoing fluctuations in the labor market. Over the decades, the average Initial Jobless Claims in the United States have stood at 365.95 thousand, with notable historical highs and lows. The highest point reached was a staggering 6137 thousand in April 2020, while the lowest recorded figure was a mere 162 thousand in November 1968, reflecting the nation's ever-evolving employment landscape.

TL;DR
USD - Unemployment Claims.png
The forecast for Unemployment Claims suggests a rise to 227K, up from the previous figure of 220K.

The release of the upcoming Unemployment Claims data is scheduled for Thursday, December 14, 2023, at 1:30 PM GMT.


EUR - ECB Press Conference​

The primary way the ECB communicates with investors about monetary policy is through this method. It thoroughly discusses factors influencing recent interest rate and policy decisions, including the economic outlook and inflation, and importantly, offers insights into future monetary policy directions.

The ECB Press Conference is scheduled for Thursday, December 14th, 2023, at 1:45 PM GMT.


Disclaimer: The market news provided herein is for informational purposes only and should not be considered trading advice.
 

Daniel LQDFX

Trader
Jul 21, 2023
126
0
22
43

Daily News Update


15 December 2023​

Friday​

Friday is poised to be a significant day for the financial markets with a series of major announcements on the agenda. China is set to reveal its Industrial Production year-over-year figures, while France, Germany, Great Britain, and the US will release their Flash Manufacturing and Flash Services PMI data. Additionally, the US will also publish its Empire State Manufacturing Index, making it a day of considerable interest for market watchers.​


CNY – Industrial Production y/y​

This measure is a key predictor of economic vitality, as production, being the primary engine of the economy, rapidly responds to fluctuations in the business cycle.

In October 2023, China's industrial production experienced a strong year-on-year growth of 4.6%, outpacing September's 4.5% and surpassing the expected 4.4%. This growth, the highest since April, was mainly due to increases in mining and manufacturing sectors. However, there was a decrease in electricity, heat, gas, and water production. Key growth industries included non-ferrous metals and automobiles, with industrial output rising 0.4% monthly and 4.1% cumulatively over the first ten months of 2023 compared to the previous year.

TL;DR
CNY – Industrial Production y.y.png
The forecast suggests an increase to 5.6% from the previous announcement of 4.6%.

The next announcement is scheduled for Friday, December 15th, 2023, at 02:00 AM GMT.


EUR - French Flash Manufacturing PMI​

This indicator is a key measure of economic well-being, as businesses are swift to respond to market conditions, and their purchasing managers possess highly up-to-date and pertinent insights into the company's perspective on the economy.

The S&P Global France Manufacturing PMI for November 2023 was slightly revised upward to 42.9, surpassing the initial estimate of 42.6 and showing a slight increase from the previous month's 42.8. This marks the tenth consecutive month of contraction, the most severe since May 2020, primarily attributed to significant weakness in demand. New orders continued to decline, albeit at a moderate pace, largely due to deteriorating market conditions. Consequently, there was a notable decrease in output, the sharpest since May 2020, leading to reductions in workforce numbers, ongoing cuts in purchasing activity, and the steepest drop in input stocks since May 2020. Input price inflation stabilized after six consecutive months of decline. Looking ahead, manufacturers remained highly pessimistic about the next twelve months, with expectations of reduced orders, particularly from clients in the automotive and construction sectors.

TL;DR
EUR - French Flash Manufacturing PMI.png
The forecast is pointing to an increase to 48.0 from the previous announcement of 42.9.


EUR - French Flash Services PMI​

This indicator is a forward-looking measure of economic well-being, as businesses respond swiftly to market conditions, and their purchasing managers possess the most up-to-date and pertinent insights into the company's perspective on the economy.

In November 2023, the HCOB France Services PMI registered at 45.4, a slight increase from October's 45.2 and in line with initial estimates of 45.3. This latest reading signals a continued significant contraction in the French services sector, driven by a sharp decline in new business, the fastest in three years, leading to a notable drop in activity levels. Additionally, new export business declined for the sixth consecutive month, reflecting client hesitancy. The persistent demand weakness, coupled with reduced pressure on companies' operating capacities, resulted in slower employment growth in November, with job creation at its joint-slowest pace in nearly three years. Input costs remained historically high, contributing to an increase in output charge inflation to a four-month high. Looking ahead, growth expectations for the next twelve months have weakened as a result of these challenging conditions.

TL;DR
EUR - French Flash Services PMI.png
According to the forecast, there is an expected rise from the previous result of 45.4 to 49.4. This development will be closely monitored as it could indicate positive momentum in the relevant economic indicators.

The upcoming release for the French Flash Manufacturing & Flash Services PMI is scheduled for Friday, December 15th, 2023, at 8:15 AM GMT.


EUR – German Flash Manufacturing PMI​

The German Flash Manufacturing PMI acts as a crucial gauge of economic health, as businesses react promptly to changing market conditions. Among those individuals who hold the most current and relevant insights into a company's assessment of the economy are its purchasing managers.

The HCOB Germany Manufacturing PMI was revised higher to 42.6 in November 2023 from an initial estimate of 42.3, remaining the highest reading in six months. The PMI continues to point to a deep downturn in the manufacturing sector, although the decline is easing. Businesses reported the slowest declines in both output and new orders for six months, with trends in the consumer and investment goods groupings moving closer to stabilization. Also, expectations towards future activity improved although remaining pessimistic. Meanwhile, firms reported reducing buying levels in line with lower production and stock requirements. Also, falling demand across was once again reflected in downward pressure on prices as competition for new work fueled further discounting. The rate of decline in average factory gate charges was the weakest for five months. Factory employment however, declined faster.

TL;DR
EUR – German Flash Manufacturing PMI.png
The forecast signals an upward trend, with expectations pointing to a rise from the previous reading of 42.6 to 45.1. This development will be closely observed by market analysts and businesses as it could reflect improving economic conditions and sentiment.


EUR – German Flash Services PMI​

This serves as a leading indicator for economic well-being, as businesses respond swiftly to market conditions, with their purchasing managers often possessing the most up-to-date and pertinent insights into the company's perspective on the economy.


In November 2023, the HCOB Germany Services PMI underwent a notable revision, surging to 49.6 from its initial estimate of 48.7, surpassing the October figure of 48.2. This revised data pointed to a marginal decline in services activity, with the rate of contraction slowing compared to the previous month, attributed to a reduced decline in new business. Employment levels remained relatively stable, showing a slight increase after two consecutive marginal declines. Simultaneously, there was an uptick in cost pressures, primarily driven by rising wages, resulting in the sharpest increase in firms' input prices in six months. However, heightened competition for new business opportunities tempered pricing power, leading to a slight slowdown in output charge inflation. Looking ahead, service providers held modest expectations for activity growth over the next 12 months.

TL;DR
EUR – German Flash Services PMI.png
The forecast for the upcoming release of the German Flash Services PMI data suggests a marginal drop from the previous reading of 49.6 to 49.5.

The German Flash Manufacturing and Flash Services PMI data is scheduled for release on Friday, December 15th, 2023, at 8:30 AM GMT.


GBP - Flash Manufacturing PMI​

The Flash Manufacturing Purchasing Managers' Index (PMI) serves as a leading indicator of economic well-being. This is because businesses are highly responsive to market dynamics, and their purchasing managers possess the most up-to-date and pertinent insights into their company's perspective on the broader economy.

In November 2023, the S&P Global/CIPS UK Manufacturing PMI was revised upward to 47.2, surpassing the initial estimate of 46.7 and October's 44.8. This latest reading reached its peak since April, although it still indicated the 16th consecutive month of contraction in the manufacturing sector. Output continued its decline amidst reports of weakened domestic demand, reduced intake of new export business, and destocking activities observed both among manufacturers and their clients. Moreover, new orders experienced an eighth consecutive month of decline, with new export business dwindling for a 22nd straight month. Employment also sustained a downward trend, along with reduced activity in input buying. Concerning prices, input costs decreased while selling prices rose, reflecting efforts to restore margins. Lastly, business confidence showed a slight improvement in November.

TL;DR
GBP - Flash Manufacturing PMI.png
The forecast suggests a minor uptick to 48.0, up from the previous reading of 47.2.


GBP - Flash Services PMI​

The Flash Services PMI functions as an early indicator of economic health, with businesses swiftly adapting to market changes, and their purchasing managers holding the most up-to-date and relevant information regarding their company's economic outlook.

In November 2023, the S&P Global/CIPS UK Services PMI received a slight upward revision, reaching 50.9 compared to the initial estimate of 50.5 and October's 49.5. This latest PMI reading marked the first expansion in service sector activity since July, driven by growing demand and the completion of ongoing projects. Backlogs of work continued to decline for the sixth consecutive month, reaching their fastest rate of decrease since August. Employment levels increased due to long-term business expansion plans and a cautious improvement in demand conditions. Regarding pricing, average cost burdens rose slightly faster, marking the second-lowest rate since March 2021, while output charge inflation reached its highest point since July. Lastly, business sentiment showed signs of improvement in November.

TL;DR
GBP - Flash Services PMI.png
The forecast suggests a rise to 51.1 from the previous outcome of 50.9.

The forthcoming Flash Manufacturing PMI and Flash Services PMI for Great Britain are scheduled to be released on Friday, December 15, 2023, at 9:30 AM GMT.


USD - Empire State Manufacturing Index​

The Empire State Manufacturing Index is a significant forecaster of economic health, as it reflects how businesses promptly adapt to market changes. Changes in this index can provide early indications of future economic activities such as spending, hiring, and investment.

In November 2023, the New York Empire State Manufacturing Index in the United States increased to 9.1 points, a significant improvement from the -4.6 points recorded in October. Over the period spanning from 2001 to 2023, this index maintained an average of 7.42 points. Its highest point was reached in July 2021 at 43 points, while its lowest point was recorded at a staggering -78.2 points in April 2020.

TL;DR
USD - Empire State Manufacturing Index.png
The forecast for the Empire State Manufacturing Index suggests a decrease to b down from the previous outcome of 9.1.

The upcoming release of the Empire State Manufacturing Index is set for Friday, December 15, 2023, at 1:30 PM GMT.


USD - Flash Manufacturing PMI​

The Flash Manufacturing PMI acts as a key indicator of economic health. Businesses are extremely responsive to market fluctuations, and their purchasing managers hold the most current and relevant information regarding the company's economic prospects.

The S&P Global US Manufacturing PMI was confirmed at 49.4 in November 2023, marking the lowest level in three months and indicating a renewed deterioration in operating conditions within the manufacturing sector, primarily due to lower new orders. The return to a contraction in new sales resulted in a slower expansion of production and further workforce reductions. Additionally, inventories continued to decrease, and input buying remained stagnant. Meanwhile, the pace of input cost increases slowed significantly, leading to dampened inflation. Firms also moderated the extent to which they passed on higher costs to customers, resulting in a slower rise in selling prices. Looking back, business expectations in November showed improvement compared to October's recent low but still suggested subdued growth expectations for the year ahead.

TL;DR
USD - Flash Manufacturing PMI.png
The forecast for the Flash Manufacturing PMI suggests a minor decline to 49.2 from the previous reading of 49.4.


USD - Flash Services PMI​

The Flash Services PMI is a forward-looking gauge of economic well-being. Businesses respond promptly to market conditions, and their purchasing managers typically possess the most up-to-date and pertinent insights into the company's perspective on the economy.

The S&P Global US Services PMI was confirmed at 50.8 in November 2023, the highest in four months, from 50.6 in October. The reading pointed to further growth in the services sector, as output and new business expanded. Customer demand strengthened on the month, as new business from abroad also ticked up. Meanwhile, workforce numbers increased to the smallest extent for over a year, with backlogs falling at a quicker pace, amid reports of burgeoning spare capacity. Also, service providers hiked charges at a quicker rate, but input cost inflation eased to the slowest in over three years. Finally, expectations for output over the coming year were down to the joint-lowest in 2023 to date.

TL;DR
USD - Flash Services PMI.png
The forecast for the Flash Services PMI suggests a minor decrease to 50.7 from the previous reading of 50.8.

The upcoming news release for both the Flash Manufacturing PMI and Flash Services PMI is scheduled for Friday, December 15th, 2023, at 2:45 PM GMT.


Disclaimer: The market news provided herein is for informational purposes only and should not be considered trading advice.
 

Daniel LQDFX

Trader
Jul 21, 2023
126
0
22
43

Daily News Update


19 December 2023​

Tuesday​

On Tuesday, December 19, 2023, Australia is set to release its Monetary Policy Meeting Minutes, coinciding with Japan's announcement of their Interest Rate Decision. This will be closely followed by the latest update on the Consumer Price Index (CPI) from Canada, marking a significant day for key economic updates from these nations.​


AUD - Monetary Policy Meeting Minutes​

This document is a comprehensive account of the most recent meeting of the Reserve Bank of Australia (RBA) Board, offering a detailed analysis of the economic circumstances that shaped their determination of interest rate levels.

The Monetary Policy Meeting Minutes are scheduled for Tuesday, December 19th, at 12:30 AM GMT.


JPY - BoJ Interest Rate Decision​

Currency valuation is primarily influenced by short-term interest rates, with traders typically considering other indicators as tools to forecast future changes in these rates.

At its October meeting, the Bank of Japan (BoJ) maintained its key short-term interest rate at -0.1% and the target for 10-year bond yields at approximately 0%, as expected. The central bank also adjusted its stance on the long-term interest rate, defining 1.0% as a flexible "upper bound" rather than a strict limit, removing a commitment to defend this level. This follows the July decision to raise the long-term rate cap from 0.5% to 1%. In its quarterly outlook, the BoJ upgraded its inflation forecasts for the fiscal years 2023 and 2024 to 2.8%, up from previous estimates of 1.3% and 1.2%, surpassing its 2% goal. For fiscal year 2025, the Consumer Price Index (CPI) is expected to moderate to 1.7%, influenced by the diminishing effects of high oil prices and earlier increases in import prices. The bank noted that Japan's economy is likely to keep recovering at a moderate pace, driven by pent-up demand, but warned of potential drawbacks due to a global economic slowdown. The BoJ reaffirmed its readiness to implement additional easing measures if necessary.

TL;DR
JPY - BoJ Interest Rate Decision.png
The forecast for the Bank of Japan's (BoJ) interest rate decision suggests it will remain unchanged from the previous figure of -0.1%.

The forthcoming interest rate decision by the Bank of Japan (BOJ) is scheduled for Tuesday, December 19, 2023, at 03:00 AM GMT.


JPY - BOJ Press Conference​

This serves as one of the main channels through which the Bank of Japan (BOJ) communicates with investors about its monetary policy. It includes details on the factors influencing the latest interest rate decision, an overview of the economic forecast, inflation trends, and hints about the direction of future monetary policies.

The press conference is scheduled for Tuesday, December 19, 2023, at 03:00 AM GMT.


CAD – CPI m/m​

Consumer prices constitute the bulk of overall inflation. Inflation significantly impacts currency valuation since increasing prices compel the central bank to hike interest rates to adhere to their mandate of controlling inflation.

In a recent economic update, it was reported that Canada's Consumer Price Index (CPI) had seen a 0.1% increase in October 2023, aligning with market expectations and marking a rebound from a 0.1% decrease in September. The monthly uptick was primarily attributed to higher costs in areas such as travel tours and property taxes, along with other special charges that were typically assessed annually in October.

The forecast for Canadian CPI m/m is reading a decrease of 0.1%, indicating a slight deflationary trend in the economy, potentially signaling a period of reduced consumer spending and economic slowdown.


CAD - Median CPI y/y​

The majority of total inflation is driven by consumer prices. Inflation plays a crucial role in the valuation of currency, as the increase in prices prompts the central bank to elevate interest rates in adherence to their mandate of controlling inflation.

In October 2023, Canada's Consumer Price Index (CPI) Median experienced a modest decrease, dropping to 3.6% from the previous month's figure of 3.9%, which was consistent with market predictions. Reviewing historical data from 1990 to 2023, the average CPI Median in Canada was found to be 2.08%. The highest CPI Median recorded during this period was 5% in June 2022, and the lowest was 0.90% in November 1997.

The forecast for the Canadian Median CPI y/y is reading an increase of 3.3%, showcasing the rise in the average cost of living over the last year.


CAD - Trimmed CPI y/y​

A significant portion of overall inflation is comprised of consumer prices. The importance of inflation in determining currency value lies in the fact that escalating prices prompt central banks to increase interest rates, adhering to their commitment to manage and contain inflation.

In October 2023, Canada's year-on-year CPI Trimmed-Mean rate decreased to 3.5%, down from the previous month's 3.7%, which was slightly below the market's expected rate of 3.6%. Historical data from 1990 to 2023 indicates an average CPI Trimmed-Mean rate in Canada of 2.03%. The highest recorded CPI Trimmed-Mean rate within this period occurred in June 2022 at 5.60%, while the lowest was registered in December 1997 at 0.80%.

The forecast for Canadian Trimmed CPI y/y is reading an increase of 3.2%, showcasing the rise even with the extreme price movements being excluded from the CPI basket.

Canada's upcoming Consumer Price Index (CPI) data release is set for Tuesday, December 19, 2023, at 1:30 PM GMT.


Disclaimer: The market news provided herein is for informational purposes only and should not be considered trading advice.
 

Daniel LQDFX

Trader
Jul 21, 2023
126
0
22
43

Daily News Update


20 December 2023​

Wednesday​

Scheduled for Wednesday, December 20, 2023, are key economic announcements from both Great Britain and the United States. Great Britain is set to release its Consumer Price Index (CPI) data, which measures the annual change in the cost of goods and services. Concurrently, the United States will publish the Conference Board (CB) Consumer Confidence Index, a vital indicator of consumer sentiment and economic outlook in the U.S.​


GBP – CPI y/y​

The bulk of overall inflation is comprised of consumer prices. This aspect of inflation is crucial for the valuation of currency, as increased prices often prompt the central bank to hike interest rates in line with its commitment to controlling inflation.

In October 2023, the United Kingdom's inflation rate had dropped to 4.6%, a decrease from the 6.7% observed in the previous two months and below the market expectations of 4.8%. This reduction was largely due to decreased energy prices following Ofgem's decision to lower caps on household bills. Housing and utilities costs had fallen by 3.5%, and gas and electricity prices experienced their most significant decrease since January 1989. Additionally, food inflation had eased to 10.1%, the lowest since June 2022. The core inflation rate, which excludes volatile items, also declined to 5.7%, marking its lowest point since March 2022. On a monthly comparison, the Consumer Price Index had remained unchanged.

The forecast for the CPI y/y suggests a modest decrease from 4.6% to 4.0%.

The upcoming CPI y/y release is scheduled for Wednesday, December 20, 2023, at 07:00 AM GMT.

The last time, the British CPI y/y was announced on the 15th of November, 2023. You may find the market reaction graph (EURGBP M5) below:

15-11-2023-CPI-yy-GBP.jpg
USD - CB Consumer Confidence​

Financial confidence serves as a key predictor of consumer expenditure, which constitutes a significant portion of total economic activity.

The Conference Board reported an increase in the Consumer Confidence Index to 102.0 in November, up from a revised 99.1 in October, indicating a modest improvement in consumer sentiment. This rise was particularly noted among older householders, despite ongoing concerns about escalating prices and potential global conflicts. While the Present Situation Index saw a slight decrease, reflecting varied opinions on job availability and business conditions, the Expectations Index, which gauges short-term income and labor market outlooks, exhibited positive trends. Chief Economist Dana Peterson of The Conference Board pointed out robust consumer financial health, yet acknowledged ongoing apprehensions regarding interest rates and stock market volatility. The survey also revealed reduced but still significant concerns among consumers about a potential recession in the coming year.

TL;DR

  • Consumer Confidence Index increased to 102.0 in November from 99.1 in October.
  • Improvement noted especially among older householders.
  • Concerns remain about rising prices and global conflicts.
  • Present Situation Index decreased slightly.
  • Expectations Index showed positive trends.
  • Chief Economist Dana Peterson highlighted strong consumer financial health but acknowledged fears over interest rates and stock market volatility.
  • Survey indicated reduced yet significant concerns about a potential recession in the next year.

The projected forecast for the Conference Board (CB) Consumer Confidence Index suggests a modest increase from 102 to 103.8.

The forthcoming release of the Conference Board (CB) Consumer Confidence Index is scheduled for Wednesday, December 20, 2023, at 3:00 PM GMT.

The last time, the US CB Consumer Confidence Index was announced on the 28th of November, 2023. You may find the market reaction graph (GBPUSD M5) below:

28-11-2023-CB-Consumer-Confidence-USD.jpg


Disclaimer: The market news provided herein is for informational purposes only and should not be considered trading advice.
 

Daniel LQDFX

Trader
Jul 21, 2023
126
0
22
43

Daily News Update


21 December 2023​

Thursday​

In a significant economic update, the United States is set to announce its Final Gross Domestic Product (GDP) for the quarter, along with Unemployment Claims data, on Thursday, December 21, 2023. This announcement will provide key insights into the country’s economic health and labor market conditions, offering critical information for investors and policymakers.​


USD - Final GDP q/q​

This represents the most comprehensive indicator of economic activity and serves as the principal measure for assessing the overall health of the economy.

The US economy had experienced robust expansion in the third quarter of 2023, growing at an annualized rate of 5.2%, which exceeded both the preliminary estimate of 4.9% and the forecasts of 5%. This growth marked the strongest since the fourth quarter of 2021. Nonresidential investment was notably revised upwards, showing a 1.3% increase rather than the initially estimated 0.1% decline. The decrease in equipment spending was less severe than first thought (-3.5% compared to -3.8%), and spending on structures surged to 6.9%, significantly higher than the 1.6% increase in the preliminary estimate. Residential investment also saw an upturn for the first time in nearly two years, growing at a much faster rate of 6.2% compared to the 3.9% initially predicted. Private inventory contributions to growth were revised up to 1.4 percentage points, exceeding the earlier estimate of 1.32 points. Government spending growth accelerated more than expected, reaching 5.5% versus the previously estimated 4.6%. However, consumer spending increased by 3.6%, slightly below the 4% in the initial estimate but still representing the largest rise since the fourth quarter of 2021. The moderate slowdown was mainly attributed to a decrease in services spending. Export growth was strong at 6%, albeit slightly lower than the 6.2% initial estimate, while the increase in imports was more modest at 5.2%, compared to the previously estimated 5.7%.

TL;DR
USD - Final GDP q.q.png
The projection for the Final GDP q/q is currently estimated at 5.2%.

The upcoming release of the Final GDP q/q is set for Thursday, December 21, 2023, at 1:30 PM GMT.

The last time, the US Final GDP q/q was announced on 28th of September, 2023. You may find the market reaction graph (GBPUSD M5) below:

28-09-2023-Final-GDP-qq-USD.jpg

USD - Unemployment Claims​

The unemployment rate, often considered a lagging indicator, remains a crucial measure of the economy's health due to its strong correlation with consumer spending and labor market conditions. Additionally, unemployment levels play a significant role in guiding the country's monetary policy decisions.

The latest data had revealed a significant decrease in the number of Americans filing for unemployment benefits, with new claims dropping by 19,000 to reach 202,000 in the week ending December 9th. This figure was notably lower than the market's expectation of 220,000 and represented the lowest level in two months. The decline in new claims had signaled a tight labor market in the US, potentially giving the Federal Reserve more leeway to maintain its current interest rate, particularly if inflation persisted. Concurrently, continuing claims had seen a slight rise, increasing by 11,000 to 1,876,000 in the final week of November, yet still below the projected 1,887,000. On an unadjusted basis, claims had dropped by over 46,000, with significant decreases in states such as New York and Pennsylvania. The four-week moving average also had fallen, indicating a reduction in volatility in the job market.

TL;DR
USD - Unemployment Claims.png
The forecast for the US Unemployment Claims announcement is reading an increase to 215,000.

The upcoming release of Unemployment Claims is scheduled for Thursday, December 21, 2023, at 1:30 PM GMT.

The last time the US Unemployment Claims was announced on the 14th of December, 2023. You may find the market reaction graph (USDCAD M5) below:

14-12-2023-Unemployment-Claims-USD.jpg


Disclaimer: The market news provided herein is for informational purposes only and should not be considered trading advice.
 

Daniel LQDFX

Trader
Jul 21, 2023
126
0
22
43

Daily News Update


22 December 2023​

Friday​

On Friday, December 22, 2023, key economic news will be released by the UK, Canada, and the US. The UK is set to announce its monthly Retail Sales figures, Canada will disclose its monthly GDP data, and the US will present its monthly Core PCE Price Index along with the Revised University of Michigan Consumer Sentiment.​


GBP - Retail Sales m/m​

This measure acts as the principal indicator of consumer spending, which constitutes the majority of overall economic activity.

In October 2023, retail sales in the United Kingdom faced a surprising downturn with a 0.3% month-over-month decrease, falling short of market expectations that had anticipated a 0.3% growth. This unexpected decline was primarily attributed to a 2.0% drop in automotive fuel sales, driven by cautious consumer spending and adverse weather conditions. Additionally, food store receipts declined by 0.3%, with notable decreases in specialist food stores and alcohol and tobacco sales, plummeting by 4.2% and 10.4%, respectively. Non-food store trade also contracted by 0.2%, influenced by factors such as the rising cost of living, reduced customer footfall, and inclement weather. Within the non-food category, clothing stores (-0.9%), household goods stores (-1.1%), and department stores (-0.1%) experienced declines. In contrast, non-store retailing, primarily online sales, showed resilience with a 0.8% increase. On a yearly basis, the UK witnessed a continuous decline in retail sales, marking the 19th consecutive month of contraction in this crucial economic indicator.

TL;DR
1703178099240.png
The forecast suggests a shift from the previous result of -0.3% to a positive 0.6%.

The forthcoming Retail Sales m/m is set to be unveiled on Friday, December 22, 2023, at 07:00 AM GMT.

The last time the US Retail Sales m/m was announced on the 17th of November, 2023. You may find the market reaction graph (GBPJPY M5) below:
17-11-2023-Retail-Sales-mm-GBP.jpg

CAD - GDP m/m​

This metric is the most extensive evaluation of economic performance and serves as the primary indicator of the economy's condition.

In October 2023, Canada's economy is projected to have expanded by 0.2%, according to preliminary figures. This growth was influenced by gains in the mining, quarrying, oil and gas extraction, retail trade, and construction industries, though these were partly offset by a decrease in the wholesale trade sector. In the previous month, September, the Canadian economy saw a 0.1% growth, primarily due to a 0.3% rise in the goods-producing sectors, marking its first increase in six months. The services-producing sectors remained mostly stable. Notably, the manufacturing sector experienced a 0.9% increase, recovering from three months of decline, with both durable and non-durable manufacturing sectors showing improvement. Additionally, the construction sector and wholesale trade saw increases of 0.1% and 0.5% respectively. On the other hand, the agriculture, forestry, fishing, and hunting sector declined by 1.4%, continuing its 13-month downward trend. Similarly, the mining, quarrying, oil, and gas extraction sector experienced a 1.8% decline.

TL;DR
1703178126422.png
The GDP m/m forecast suggests a modest increase, moving from 0.1% to 0.2%.

The forthcoming GDP m/m data is scheduled for release on Friday, December 22, 2023, at 1:30 PM GMT.

The last time the Canadian GDP m/m was announced on the 30th of November, 2023. You may find the market reaction graph (CADJPY M5) below:

30-11-2023-GDP-mm-CAD.jpg

USD - Core PCE Price Index m/m​

This metric is the main tool used by the Federal Reserve to gauge inflation. Inflation plays a crucial role in determining the value of currency, as increasing prices prompt the central bank to hike interest rates, adhering to their mandate to keep inflation in check.

In October 2023, the Core Personal Consumption Expenditures (PCE) Price Index in the U.S., which excludes fluctuating items such as food and energy, recorded a modest increase of 0.2% from the prior month. This aligns with market predictions and shows a deceleration from September's 0.3% rise. The annual Core PCE rate, the Federal Reserve's preferred inflation gauge, dropped to 3.5%, the lowest since April 2021. In contrast, the overall PCE Price Index remained steady in October, defying expectations of a 0.1% increase. The year-over-year PCE inflation rate reduced to 3%, down from 3.4% in the previous month, consistent with earlier projections. These developments provide valuable insights into the changing inflation trends and their possible impact on future Federal Reserve monetary policies.

TL;DR
1703178164105.png
The upcoming Core PCE Price Index m/m forecast remains consistent with the previous figure, predicting a 0.2% outcome, unchanged from the prior result.

The upcoming release of the Core PCE Price Index m/m is scheduled for Friday, December 22, 2023, at 1:30 PM GMT.

The last time the US Core PCE Price Index m/m was announced on the 30th of November, 2023. You may find the market reaction graph (GBPUSD M5) below:

30-11-2023-Core-PCE-Price-Index-mm-USD.jpg
USD - Revised UoM Consumer Sentiment​

Consumer confidence in financial matters is a key predictor of consumer spending, which makes up the bulk of total economic activity. This is assessed through a survey of approximately 500 consumers, who are asked to evaluate the current and future economic conditions.

In December 2023, the University of Michigan's consumer sentiment for the US had surged to 69.4, up from 61.3 in the previous month, exceeding market expectations of 62.0 according to a preliminary estimate. This was the highest level since August, primarily driven by positive changes in expected inflation trajectories. Inflation expectations for the upcoming year had decreased to 3.1% from November's 4.5%, the lowest since March 2021. Furthermore, the five-year inflation outlook had fallen to 2.8%, tying with the second lowest figure since July 2021. The component measuring current economic conditions had risen to 74.0 from 68.3, and the index for consumer expectations had jumped to 66.4 from 56.8. At this point, US consumer sentiment was about 39% higher than the all-time low recorded in June 2022, yet still remained significantly below pre-pandemic levels.

TL;DR
1703178192663.png
The projected figure for the Revised University of Michigan Consumer Sentiment is currently indicating a value of 69.4.

The next Revised University of Michigan Consumer Sentiment report is scheduled for release on Friday, December 22, 2023, at 3:00 PM GMT.

The last time the US Revised UoM Consumer Sentiment report was announced on the 22nd of November, 2023. You may find the market reaction graph (USDJPY M5) below:

22-11-2023-Revised-UoM-Consumer-Sentiment-USD.jpg


Disclaimer: The market news provided herein is for informational purposes only and should not be considered trading advice.
 

Daniel LQDFX

Trader
Jul 21, 2023
126
0
22
43

Daily News Update


28 December 2023​

Thursday​

As the year draws to a close, all eyes are on the United States as it gears up for a significant economic announcement. On Thursday, December 28th, 2023, just days before New Year's celebrations begin, the US is scheduled to release its latest unemployment claims data. This release is poised to provide key insights into the nation's labor market as we head into 2024, potentially influencing both domestic and global economic forecasts. The announcement is eagerly awaited by economists, investors, and policy makers alike, who are keen to gauge the health of the American workforce amidst ongoing economic challenges.​


USD - Unemployment Claims​

In the constantly shifting landscape of economic indicators, the nation's unemployment data stands out as an early and vital gauge of economic health. Its market impact varies weekly, drawing more attention during periods of economic uncertainty or when the figures are exceptionally high or low. While typically seen as a lagging indicator, the number of unemployed individuals is a critical measure of the economy's overall state. This is because consumer spending, a key driver of economic activity, is closely linked to the health of the job market. Additionally, unemployment figures are a crucial factor for policymakers who are tasked with steering the nation's monetary policy. As such, these statistics are not just numbers but reflections of the broader economic narrative, influencing decisions from Wall Street to Main Street.

The U.S. labor market recently demonstrated its strength and resilience. In the week ending December 16th, initial unemployment claims rose slightly by 2,000, reaching 205,000, yet remained well below the anticipated 215,000 and close to a recent two-month low. This data suggests a robust labor market, potentially influencing the Federal Reserve's decisions regarding interest rates amid inflation concerns. Continuing claims also dropped slightly to 1,865,000, surpassing expectations of an increase. Furthermore, the four-week moving average decreased, and non-seasonally adjusted claims fell notably in states like California and Georgia, reinforcing the overall stability of the labor market.

TL;DR
USD - Unemployment Claims.png

The forecast for Unemployment Claims suggests a projected increase, rising from the previous figure of 205,000 to an anticipated 207,000.

The next release of the US Unemployment Claims data is scheduled for Thursday, December 28, 2023, at 1:30 GMT.


Disclaimer: The market news provided herein is for informational purposes only and should not be considered trading advice.
 

Daniel LQDFX

Trader
Jul 21, 2023
126
0
22
43

Daily News Update


29 December 2023​

Friday​

On Friday, 29th December 2023, the financial markets are anticipating the release of two key economic indicators: the Spanish Flash Consumer Price Index (CPI) year-over-year and the Chicago Purchasing Managers' Index (PMI). These announcements are expected to provide significant insights into the current economic conditions in Spain and the Chicago region, respectively.​


EUR - Spanish Flash CPI y/y​

Consumer prices constitute a major portion of overall inflation. Inflation plays a crucial role in currency valuation, as escalating prices prompt central banks to increase interest rates, adhering to their mandate to contain inflation.

In November 2023, Spain experienced a reduction in its year-on-year consumer price inflation rate, which fell to 3.2% from 3.5% in the preceding month, as indicated by preliminary data. This decline, marking the lowest inflation rate since August, was largely driven by decreased prices in fuel and tourist packages. The inflation rate for food and non-alcoholic beverages also showed signs of easing. Moreover, the core inflation rate, excluding the volatile sectors of food and energy, declined to 4.5% from October's 5.2%, reaching its lowest point since April 2022.

The forecast for the Spanish Flash Consumer Price Index (CPI) year-over-year indicates a modest reduction, with expectations of a decrease from the previous rate of 3.2% to 3.0%.

The release of the Spanish Flash Consumer Price Index (CPI) year-over-year is scheduled for 08:00 AM GMT on Friday, 29th December 2023.

USD - Chicago PMI​

The Chicago Purchasing Managers' Index (PMI) is a pivotal economic indicator derived from a survey of approximately 200 purchasing managers in the Chicago area. This survey queries respondents to evaluate the relative state of business conditions across various sectors, encompassing employment, production, new orders, prices, supplier deliveries, and inventories. As a leading indicator of economic health, the Chicago PMI is highly valued because businesses often respond swiftly to changing market conditions, and their purchasing managers possess some of the most up-to-date and pertinent insights into the company's perspective on the economy.

The Chicago Business Barometer, also known as the Chicago PMI, had climbed to 55.8 in November 2023 from 44 in the previous month, surpassing market forecasts of 45.4. This increase revealed the first month of growth in Chicago's economic activity since August 2022, presenting a solid overall expansion. Production had improved by 15.9 points to 62.4, reaching its highest level since December 2021, and new orders had risen by 12.5 points, marking the second consecutive month-on-month increase, driven by stronger demand. Additionally, inventories had entered expansion for the first time since March 2023, as firms scaled up for higher production, while order backlogs remained in contraction. Concurrently, employment had advanced by 3.7 points to 53.9, the highest since July 2022. In terms of price development, prices paid remained largely unchanged, decreasing marginally by 0.2 points to 59.9, and stayed below the levels observed for the majority of the past three years.

TL;DR
USD - Chicago PMI.png
The forecast for the Chicago PMI suggests a decrease, projecting a decline from the previous figure of 55.8 to 50.

The upcoming release of the Chicago PMI is scheduled for 2:45 PM GMT on Friday, 29th December 2023.


Disclaimer: The market news provided herein is for informational purposes only and should not be considered trading advice.
 

Daniel LQDFX

Trader
Jul 21, 2023
126
0
22
43

Daily News Update


03 January 2024​

Wednesday​

On Wednesday, January 3, 2024, the United States is scheduled to release high-impact economic data, including the ISM Manufacturing PMI and JOLTS Job Openings, alongside the minutes from the Federal Open Market Committee (FOMC) meeting.​


USD - ISM Manufacturing PMI​

As a foremost indicator of economic vitality, businesses respond rapidly to market conditions, with purchasing managers possessing the most immediate and pertinent insights into a company's perspective on the economy.

In November 2023, the ISM Manufacturing PMI in the United States held steady at 46.7, consistent with October's reading yet below the anticipated 47.6, signifying a continued contraction in the manufacturing sector. Companies adeptly adjusted their output in response to sustained softness in orders, with production falling into contraction at 48.5 (a decrease from 50.4) and employment declining to 45.8 (from 46.8). The Supplier Deliveries Index dropped to 46.2, indicating faster deliveries for the fourteenth month in a row. The rates of decrease in new orders and inventories slowed to 48.3 and 44.8, respectively, and a slight reduction in prices to 49.9 (from 45.1) pointed to stabilizing costs amid fluctuating energy and steel markets. The decrease in manufacturing supplier lead times is also viewed as a positive sign for future economic activity.

TL;DR
USD - ISM Manufacturing PMI.png
The projected figure for the upcoming ISM Manufacturing PMI is 47.1, marginally higher than the preceding value of 46.7.

The next ISM Manufacturing PMI is set to be released at 3:00 PM GMT on January 3, 2024.

The last time, the US ISM Manufacturing PMI was announced on the 1st of December, 2023. You may find the market reaction graph (USDJPY M5) below:

01-12-2023-ISM-Manufacturing-PMI-USD.jpg

USD - JOLTS Job Openings​

Despite the publication delay, this data garners significant attention from traders because of its potential to notably influence market dynamics. The count of job openings serves as a preliminary gauge of the overall employment landscape, highlighting its critical importance for market participants.

The U.S. Bureau of Labor Statistics announced in October 2023 that job openings declined to 8.7 million by month's end, leading to a job openings rate of 5.3%, a drop of 0.3 percentage points. Significant shifts occurred in sectors like health care, social assistance, finance, insurance, and real estate, all witnessing a decrease in openings, while the information sector saw an increase. The number of hires remained steady at 5.9 million, and total separations, encompassing quits, layoffs, and other types, showed minimal variation. This data offers valuable insight into labor market trends, highlighting changes in job availability and workforce stability.

TL;DR
USD - JOLTS Job Openings.png
The forecast for the JOLTS Job Openings indicates an anticipated rise from 8.73 million to 8.8 million.

The upcoming JOLTS Job Openings report is scheduled for release at 3:00 PM GMT on January 3, 2024.

The last time, the US JOLTS Job Openings report was announced on the 5th of December, 2023. You may find the market reaction graph (GBPUSD M5) below:

05-12-2023-JOLTS-Job-Openings-USD.jpg

USD - FOMC Meeting Minutes​

The record of the FOMC's latest meeting offers comprehensive insights into the economic and financial circumstances that shaped their decision-making process regarding the setting of interest rates.

The FOMC Meeting Minutes are scheduled for release at 7:00 PM GMT on January 3rd, 2024.

The last time the US FOMC Meeting Minutes was released on the 21st of November, 2023. You may find the market reaction graph (GBPUSD M5) below:

21-11-2023-FOMC-Meeting-Minutes-USD.jpg


Disclaimer: The market news provided herein is for informational purposes only and should not be considered trading advice.
 

Daniel LQDFX

Trader
Jul 21, 2023
126
0
22
43

Daily News Update


04 January 2024​

Thursday​

Significant economic updates are expected on Thursday, January 4th, 2024, from leading global economies. Germany is poised to release its Preliminary Consumer Price Index (CPI) on a monthly basis. In the United States, attention will be focused on the release of the ADP Non-Farm Employment Change and the latest Unemployment Claims data, providing key insights into the labor market's health.​


EUR - German Prelim CPI m/m​

Consumer prices constitute a significant portion of total inflation. Inflation plays a crucial role in currency valuation, as it compels the central bank to increase interest rates in adherence to its mandate to contain inflation.

In a notable economic development, Germany's Consumer Price Index (CPI) saw a 0.40% decrease in November 2023 compared to the previous month. Historical data from 1950 to 2023 shows that Germany's average monthly inflation rate has been 0.21%, with the highest spike of 3.10% occurring in October 1951 and the most significant drop of -2.73% recorded in January 1950.

The expected German Preliminary CPI m/m suggests a shift from the previous -0.4% to a positive 0.2% reading.

The upcoming release of the German Preliminary CPI m/m is scheduled for January 4th, 2024, at 1:00 PM GMT.

The last time, the German Prelim CPI m/m was announced on the 29th of November, 2023. You may find the market reaction graph (EURJPY M5) below:

29-11-2023-German-Prelim-CPI-mm-EUR.jpg

USD - ADP Non-Farm Employment Change​

Job creation serves as a critical leading indicator of consumer spending, which constitutes the bulk of overall economic activity.

In November 2023, U.S. private sector employment grew by 103,000 jobs, falling short of the expected 131,000 and slightly below October's revised figure of 106,000, according to ADP. The increase was largely driven by the services sector, which added 117,000 jobs, with significant gains in trade, transportation, utilities, education, health, financial activities, and information. Contrarily, job losses occurred in leisure, hospitality, and professional/business services. The goods-producing sector also declined, led by losses in manufacturing and construction. Wage growth showed signs of slowing, with the smallest increases since 2021 for both job-stayers and job-changers. ADP's Chief Economist, Nela Richardson, commented on the trend, noting a shift from the rapid growth in leisure and hospitality to more moderate hiring and wage increases expected in 2024.

TL;DR
USD - ADP Non-Farm Employment Change.png
The forecast for the upcoming ADP Non-Farm Employment Change indicates an expectation of 100K, which is marginally lower than the previous figure of 103K.

The upcoming ADP Non-Farm Employment Change report is scheduled for release at 1:15 PM GMT on January 4th, 2024.

The last time, the US ADP Non-Farm Employment Change report was announced on the 6th of December, 2023. You may find the market reaction graph (AUDUSD M5) below:

06-12-2023-ADP-Non-Farm-Employment-Change-USD.jpg

USD - Unemployment Claims​

While typically considered a lagging indicator, the unemployment rate is a vital sign of overall economic health, as consumer spending is closely linked to labor market conditions. Additionally, unemployment levels are a key factor in guiding the nation's monetary policy.

In the week ending December 23, the advance figure for seasonally adjusted initial claims had been 218,000, reflecting an increase of 12,000 from the previous week's revised level. The previous week's level had been revised up by 1,000 from 205,000 to 206,000. The 4-week moving average had been 212,000, indicating a decrease of 250 from the previous week's revised average. The previous week's average had been revised up by 250 from 212,000 to 212,250.

TL;DR
USD - Unemployment Claims.png
The forecast for the US Unemployment claims report is reading a decrease to 216,000.

The latest data on Unemployment Claims is set to be publicly released on January 4, 2024, at 1:30 PM GMT.


Disclaimer: The market news provided herein is for informational purposes only and should not be considered trading advice.
 

Daniel LQDFX

Trader
Jul 21, 2023
126
0
22
43

Daily News Update


05 January 2024​

Friday​

On Friday, January 5th, 2024, significant economic data releases are expected from both Canada and the United States. Canada is set to announce its latest figures for Employment Change and the Unemployment Rate. Concurrently, the United States will be releasing a series of key reports including Average Hourly Earnings month-over-month, Non-Farm Employment Change, the Unemployment Rate, and the ISM Services PMI, all of which are pivotal indicators of the economic landscape.​


CAD – Employment Change

Job creation, a leading indicator of consumer spending that forms a major part of overall economic activity, represents crucial economic data typically released soon after the month concludes. The significance of this data, combined with its prompt release, often results in substantial impacts on the market.

In a noteworthy economic development, Canada experienced a robust growth in its labor market in November 2023, with the addition of 24.90 thousand jobs. This recent increase aligns with the country's long-standing trend since 1976, which has seen an average monthly employment change of approximately 18.60 thousand. Historically, Canada's job market hit its peak in June 2020 with an extraordinary surge of 1035.80 thousand jobs, a stark contrast to the record drop of -1991.40 thousand jobs in April 2020.

The forecast for the upcoming Employment Change indicates an expectation of 13,200, which is lower than the previous figure of 24,900.

The forthcoming Employment Change data is scheduled to be released at 1:30 PM GMT on January 5th, 2024.

The last time, the Canadian Employment Change was announced on the 1st of December, 2023. You may find the market reaction graph (CADJPY M5) below:

01-12-2023-Employment-Change-CAD.jpg


CAD - Unemployment Rate

While often considered a lagging indicator, the unemployment rate is a crucial measure of overall economic health, as it is closely linked to consumer spending, which in turn is significantly influenced by labor market conditions.

In November 2023, Canada's unemployment rate climbed to 5.8%, a slight increase from 5.7% the previous month and matching market predictions. This marked the highest rate since January 2022, with the number of unemployed rising by 11,000 to 1.24 million. Concurrently, employment figures improved with 24,900 new jobs, bringing the total to 20.31 million and exceeding expectations of a 15,000 job increase. The labor force also expanded by 36,000 to 21.55 million. Since April 2023, the unemployment rate has cumulatively risen by 0.8 percentage points, significantly affecting younger workers. Youth unemployment (ages 15-24) jumped by 2.0 percentage points to 11.6% from April to November. In the same period, the rate for those aged 25-54 increased modestly by 0.6 percentage points to 4.9%, and the rate for individuals 55 and older rose by 0.7 percentage points to 4.6%.

TL;DR
CAD - Unemployment Rate.png
The forecast for the upcoming Unemployment Rate suggests a slight uptick, expecting it to rise to 5.9% from the previous figure of 5.8%.

The forthcoming Unemployment Rate is scheduled to be released at 1:30 PM GMT on January 5th, 2024.

The last time, the Canadian Unemployment Rate was announced on the 1st of December, 2023. You may find the market reaction graph (CADJPY M5) below:

01-12-2023-Unemployment-Rate-CAD.jpg


USD - Average Hourly Earnings m/m

As a leading indicator of consumer inflation, higher labor costs incurred by businesses are typically passed on to consumers, reflecting in increased prices for goods and services.

In November 2023, US private nonfarm employees saw their average hourly earnings increase by 12 cents or 0.4%, reaching $34.10, surpassing the previous month's 0.2% rise and the anticipated 0.3% increase. This growth represented the most substantial wage increase in four months. Similarly, hourly earnings for private-sector production and nonsupervisory employees also rose by 12 cents or 0.4%, to $29.30. Year-over-year, average hourly earnings in November experienced a 4% increase, maintaining the same growth rate as the previous month and in line with market expectations.

TL;DR
USD - Average Hourly Earnings mçm.png
The forecast for the upcoming Average Hourly Earnings m/m indicates a slight decrease, with expectations set at 0.3%, down from the previous rate of 0.4%.

The upcoming release of the Average Hourly Earnings m/m is scheduled for 1:30 PM GMT on January 5th, 2024.

The last time, the US Average Hourly Earnings m/m was announced on the 8th of December, 2023. You may find the market reaction graph (USDJPY M5) below:

08-12-2023-Average-Hourly-Earnings-mm-USD.jpg


USD - Non-Farm Employment Change

Job creation, as a key leading indicator of consumer spending, plays a major role in overall economic activity. This crucial economic data, typically released soon after the month's end, holds significant weight due to its importance and timely release, often leading to substantial impacts on the market.

In November 2023, the US job market experienced notable growth with the creation of 199,000 jobs, exceeding the 150,000 added in October and surpassing forecasts of a 180,000 increase. Despite this, the figure was below the average monthly gain of 240,000 jobs observed over the previous year, suggesting a slowdown in job market expansion. The healthcare sector was a major contributor, adding 77,000 positions, especially in ambulatory healthcare services (+36,000), hospitals (+24,000), and nursing/residential care facilities (+17,000). Government employment also saw a rise of 49,000 jobs, with local and state governments contributing 32,000 and 17,000 jobs, respectively. Manufacturing jobs grew by 28,000, slightly missing expectations but showing recovery post the UAW strike, notably in the automobile sector. However, the retail trade sector faced a setback, shedding 38,000 jobs.

TL;DR
USD - Non-Farm Employment Change.png
The forecast for the upcoming Non-Farm Employment Change suggests an expectation of 158,000 jobs, which is lower than the previous figure of 199,000 jobs.

The upcoming release of the Non-Farm Employment Change data is scheduled for 1:30 PM GMT on January 5th, 2024.

The last time, the US Non-Farm Employment Change was announced on the 8th December, 2023. You may find the market reaction graph (USDJPY M5) below:

08-12-2023-Non-Farm-Employment-Change-USD.jpg


USD - Unemployment Rate

While typically considered a lagging indicator, the count of unemployed individuals serves as a crucial gauge of overall economic well-being due to its strong correlation with consumer spending, a key factor in labor-market conditions. Furthermore, unemployment holds significant importance for policymakers tasked with guiding the nation's monetary policy.

In November 2023, the US unemployment rate had dropped to 3.7%, down from 3.9% in the preceding month, reaching its lowest level since July and defying expectations that it would hold steady at 3.9%. This development represented a modest reversal from the nearly two-year peak seen in October, countering the recent trend of a cooling labor market in the US. The total number of unemployed persons had decreased by 215,000 to 6.291 million, whereas the number of employed individuals had surged by 757,000 to 161.969 million. This decrease in unemployment had occurred in spite of a 0.1 percentage point growth in the labor force participation rate to 62.8%, while the employment rate had climbed by 0.3 percentage points to 60.5%

TL;DR

USD - Unemployment Rate.png

The forecast for the Unemployment rate suggests a slight increase to 3.8% from the previous outcome of 3.7%.

The Unemployment rate is scheduled to be released on January 5, 2024, at 1:30 PM GMT.

The last time, the US Unemployment Rate was announced on the 8th of December, 2023. You may find the market reaction graph (USDJPY M5) below:

08-12-2023-Unemployment-Rate-USD.jpg


USD - ISM Services PMI

A key gauge of economic vitality, the unemployment rate, serves as a leading indicator reflecting the responsiveness of businesses to market dynamics. Among those in the know, purchasing managers stand as a critical source of real-time insight into a company's perspective on the economy. This critical economic indicator stems from a survey encompassing approximately 300 purchasing managers. These respondents are tasked with evaluating the relative state of business conditions across various dimensions, including employment, production, new orders, pricing trends, supplier delivery times, and inventory levels.

In November 2023, the ISM Services PMI displayed a noteworthy improvement, surging to 52.7, up from October's reading of 51.8, and surpassing the anticipated forecast of 52. This uptick signals a robust growth trajectory within the services sector. The impetus behind this positive shift can be attributed to accelerated expansions in both business activity/production, which climbed to 55.1 from 54.1, and employment, which increased to 50.7 from 50.2. New orders managed to sustain their strength, holding steady at 55.5, mirroring the previous month's performance, while inventories exhibited a remarkable rebound, soaring to 55.4 from 49.5.

Despite some moderation, price pressures remained significant, registering at 58.3, a slight dip from the previous 58.6. Notably, the backlog of orders decreased to 49.1 from 50.9, indicating a reduction in pending orders, while the Supplier Deliveries Index rose to 49.6 from 47.5, suggesting improved supplier delivery efficiency. Anthony Nieves, Chair of the ISM Services Business Survey Committee, shed light on respondents' primary concerns, which revolve around issues such as inflation, interest rates, and geopolitical events. The data underscores the ongoing challenges posed by rising labor costs and labor shortages in the realm of employment within the services sector.

TL;DR
MetricValue
ISM Services PMI (Nov 2023)52.7
ISM Services PMI (Oct 2023)51.8
Forecasted ISM Services PMI (Nov 2023)52.0
Business Activity/Production (Nov 2023)55.1
Employment (Nov 2023)50.7
New Orders (Nov 2023)55.5
Inventories (Nov 2023)55.4
Price Pressures (Nov 2023)58.3
Backlog of Orders (Nov 2023)49.1
Supplier Deliveries Index (Nov 2023)49.6

The projected ISM Services PMI anticipates a marginal uptick, rising from the previous reading of 52.7 to 52.8.

The ISM Services PMI for January 5, 2024, is scheduled to be unveiled at 3:00 PM GMT. This release is highly anticipated and will offer valuable insights into the current state of the services sector, with potential implications for the broader economic landscape.

The last time, the US ISM Services PMI was announced on the 5th of December, 2023. You may find the market reaction graph (GBPUSD M5) below:

05-12-2023-ISM-Services-PMI-USD.jpg


Disclaimer: The market news provided herein is for informational purposes only and should not be considered trading advice.
 

Daniel LQDFX

Trader
Jul 21, 2023
126
0
22
43

Daily News Update


08 January 2024​

Monday​

On January 8th, Switzerland is set to announce its monthly Consumer Price Index (CPI) data.​


CHF – CPI m/m​

Consumer prices constitute a significant portion of overall inflation. Inflation plays a crucial role in the valuation of currency, as increasing prices often prompt the central bank to increase interest rates to adhere to their mandate of controlling inflation.

In a recent economic update, it was reported that Switzerland experienced a 0.2% decline in consumer prices in November 2023, exceeding the projected drop of 0.1%. This decrease marked a shift from the 0.1% increase observed in October. A historical overview reveals that, since 1950, Switzerland's monthly inflation rate has averaged around 0.18%. The country saw its highest inflation rate of 2.10% in November 1973 and its lowest at -1.00% in July 2004.

The CPI m/m forecast suggests a rise to 0.1%, up from the previous figure of -0.2%.

The next CPI m/m data for Switzerland is scheduled to be announced on Monday at 07:30 am GMT.

The last time, the Swiss CPI m/m was announced on the 4th of December, 2023. You may find the market reaction graph (CHFJPY M5) below:

04-12-2023-CPI-mm-CHF.jpg


Disclaimer: The market news provided herein is for informational purposes only and should not be considered trading advice.
 

Daniel LQDFX

Trader
Jul 21, 2023
126
0
22
43

Daily News Update


10 January 2024​

Wednesday​

In economic news, Australia is poised to release its CPI y/y data on January 10th, providing insights into the current inflation trends in the country.​


AUD – CPI y/y​

The majority of overall inflation is reflected in consumer prices. This aspect of inflation is critical for currency valuation as increasing prices often compel the central bank to hike interest rates, aligning with their commitment to containing inflation.

In October 2023, Australia recorded a 4.9% year-on-year rise in its Consumer Price Index (CPI), showing a deceleration from the 5.6% increase in September and falling short of the expected 5.2%. This decline in annual inflation, the first since July, was largely due to smaller increases in transport and housing expenses. Transport costs grew by 5.9%, a reduction from 9.4% in September, while housing inflation moderated to 6.1% from 7.2%. The rise in new dwelling prices was the most modest since August 2021. Additionally, inflation in furnishings, household equipment, and services, as well as in recreation and culture, showed a slowdown. In contrast, there was an increase in inflation for food and non-alcoholic beverages, spurred by higher prices for fruits and vegetables. Clothing and footwear prices saw a notable decline. The core CPI, which excludes volatile items, climbed 5.1% in October, down from 5.5% in September, but still significantly above the Reserve Bank of Australia's target range of 2-3%.

TL;DR
AUD – CPI y.y.png
The forecast for Australia's CPI y/y indicates a slight reduction to 4.5%, down from the earlier rate of 4.9%.

The upcoming CPI y/y data is set to be released on January 10th at 12:30 AM GMT.

The last time, the Australian CPI y/y was announced on the 29th of November, 2023. You may find the market reaction chart (EURAUD M5) below:

29-11-2023-CPI-yy-AUD.jpg


Disclaimer: The market news provided herein is for informational purposes only and should not be considered trading advice.
 

Daniel LQDFX

Trader
Jul 21, 2023
126
0
22
43

Daily News Update


11 January 2024​

Thursday​

On January 11th, a series of significant economic announcements are expected from the United States. These include the release of key metrics such as the Core Consumer Price Index (CPI) on a monthly basis, overall CPI for both monthly and year-over-year comparisons, and the latest figures on Unemployment Claims. These releases are highly anticipated for their potential impact on economic policy and market trends.​


USD – Core CPI m/m​

The bulk of overall inflation is represented by consumer prices. This aspect of inflation plays a vital role in determining the value of currency, as escalating prices often prompt the central bank to increase interest rates in alignment with their commitment to controlling inflation.

In November 2023, the core consumer prices in the United States, which exclude food and energy, rose by 0.3% compared to the prior month, aligning with market forecasts and marking a slight uptick from the 0.2% increase seen in the previous month. This trend suggests ongoing disinflation in the US economy, reflecting the impact of the Federal Reserve's monetary tightening measures. Notably, there was a 0.5% rise in consumer prices for services, excluding energy services, driven by increases in shelter, transportation, and medical care services. In the goods sector, used cars and trucks prices experienced a 1.6% surge, while new vehicle prices remained stable and apparel prices fell. From a year-on-year perspective, the core consumer prices showed a 4% increase.

TL;DR
USD – Core CPI m.m.png
According to the latest forecast, the CPI m/m in the United States is expected to remain steady at 0.3%, mirroring the previous month's results. This indicates a consistent trend in the core inflation rate.


USD – CPI m/m​

The majority of total inflation is reflected in consumer prices. Inflation's significance in the valuation of currency is evident, as higher prices often compel the central bank to increase interest rates, adhering to their mandate to control inflation.

In November 2023, the US consumer price index recorded a modest month-over-month increase of 0.1%, exceeding the anticipated flat rate and following October's stable figures. This increase was largely attributed to a 0.4% rise in shelter costs, a step up from the 0.3% increase seen in the previous month. A notable shift occurred in the used cars and trucks index, which saw a 1.6% rise, breaking a five-month trend of continuous declines. The food index, however, experienced a deceleration, growing by 0.2%, a decrease from the 0.3% growth in the preceding month. In contrast, the energy index fell by 2.3%, primarily due to a significant 6% decrease in the gasoline index, which outweighed increases in other energy components such as electricity (1.4%) and natural gas (2.8%).

TL;DR
USD – CPI m.m.png
The latest forecast for the CPI m/m suggests a small rise to 0.2%, up from the previous figure of 0.1%.


USD - CPI y/y​

Consumer prices make up a significant portion of total inflation. Inflation plays a crucial role in the valuation of currency, as increasing prices typically prompt the central bank to hike interest rates, in line with their mandate to keep inflation in check.

In November 2023, the United States recorded a dip in its annual inflation rate to 3.1%, the lowest in five months, meeting market expectations and showing a slight decline from October's 3.2%. This slowdown was largely due to a significant 5.4% reduction in energy costs, with gasoline prices dropping 8.9%, utility gas services falling 10.4%, and fuel oil prices plummeting 24.8%. Additionally, there was a moderation in price increases across several categories: food prices rose by 2.9% compared to 3.3% previously, shelter costs went up by 6.5% instead of 6.7%, new vehicle prices increased by 1.3% as opposed to 1.9%, and apparel prices grew by 1.1%, down from 2.6%. Used cars and trucks prices continued their downward trend, albeit at a slower rate of -3.8% compared to -7.1%. On a monthly scale, consumer prices saw a slight increase of 0.1%, defying expectations of a flat rate and contrasting with the static figures from October, as rising shelter costs balanced out the decline in the gasoline index. Core inflation remained unchanged at 4%, while the monthly rate edged up to 0.3% from 0.2%, aligning with projections.

TL;DR
USD - CPI y.y.png
The projected CPI y/y forecast suggests a minor decline to 3.0%, down from the previous rate of 3.1%.

The upcoming data for the US Core CPI m/m, CPI m/m, and CPI y/y is scheduled to be announced on January 11th at 1:30 PM GMT.

The last time, the US Core CPI m/m, CPI m/m, and CPI y/y was announced on the 12th of December 2023. You may find the market reaction charts (AUDUSD M5) below:

12-12-2023-Core-CPI-mm-USD.jpg

12-12-2023-CPI-mm-USD.jpg

12-12-2023-CPI-yy-USD.jpg

USD – Unemployment Claims​

While often considered a delayed indicator, the unemployment rate is crucial in assessing the economy's health, as consumer spending significantly correlates with the state of the job market. Additionally, unemployment figures are a key factor for policymakers in guiding the nation's monetary policy.

In a positive development for the U.S. economy, unemployment claims experienced a significant decline in the last week of 2023. New filings had dropped by 18,000 to 202,000, surpassing market expectations which had predicted claims to be around 216,000. This decrease marked the lowest level of new filings since October. In addition, ongoing claims also fell by 31,000 to 1,885,000, indicating that Americans were finding it easier to secure new employment. These latest figures were in line with other recent reports, all of which pointed to the sustained strength of the U.S. labor market. Such robust conditions afforded the Federal Reserve additional leeway to continue its assertive measures into 2024 to combat inflation, if necessary.

The forecast for the US Unemployment Claims is showing an increase to 210,000.

The upcoming release of Unemployment Claims data is scheduled for release on January 11th at 1:30 PM GMT.

The last time, the US Unemployment Claims was announced on the 04th of January 2024. You may find the market reaction chart (EURUSD M5) below:

04-01-2024-Unemployment-Claims-USD.jpg


Disclaimer: The market news provided herein is for informational purposes only and should not be considered trading advice.
 

Daniel LQDFX

Trader
Jul 21, 2023
126
0
22
43

Daily News Update


12 January 2024​

Friday​

On January 12th, a series of high-impact economic announcements are scheduled from China, Great Britain, and the United States. China will unveil its year-over-year Consumer Price Index (CPI), while Great Britain is set to announce its month-over-month Gross Domestic Product (GDP). Following these, the United States will release its month-over-month Core Producer Price Index (PPI) and overall PPI.​


CNY – CPI y/y​

A large part of overall inflation is represented by consumer prices. This aspect of inflation is significant for the valuation of currency, as higher prices typically prompt a response from the central bank, often in the form of increased interest rates.

In November 2023, China witnessed a significant year-over-year decrease in its consumer price index (CPI) of 0.5%, more pronounced than the 0.2% drop observed in the previous month and exceeding the forecasted 0.1% decline. This represented the steepest fall in CPI since November 2020, mainly attributed to a notable 4.2% reduction in food prices, surpassing the 4.0% decrease seen in October, largely due to decreased pork prices. Non-food inflation also decelerated to 0.4% from 0.7%, affected by slower growth in education costs (1.8% versus 2.3%) and a more significant decrease in transport prices (-2.4% versus -0.9%). Inflation rates for housing and health remained stable, while there was a minor rise in clothing inflation. The core CPI, which excludes food and energy, maintained a steady year-over-year increase of 0.6%, consistent with the previous month. Monthly, the CPI also saw a 0.5% decrease, in line with predictions, marking a sharper decline than October's 0.1% fall.

TL;DR
CNY – CPI y.y.png

The projection for the CPI y/y suggests a further decline to -0.7%, deepening from the previous figure of -0.5%.

The upcoming CPI y/y data is scheduled for release on January 12th at 1:30 AM GMT.

The last time, the Chinese CPI y/y data was announced on the 9th of December, 2023. You may find the market reaction chart (USDCNH M5) below:

09-12-2023-CPI-yy-CNH.jpg

GBP – GDP m/m​

This is the most comprehensive indicator of economic performance and serves as the key measure of an economy's overall well-being.

In October 2023, Britain's economy experienced a 0.3% contraction, reversing the growth trend of the previous two months and falling short of the anticipated steady performance. This downturn was largely driven by a 0.2% reduction in the services sector, particularly in information and communication. Notable declines were seen in areas such as computer programming and media production. Consumer-facing services also saw a slight 0.1% decrease. The production sector witnessed a more substantial fall of 0.8%, with manufacturing output dropping by 1.1%, notably in sectors like computer, electronic, and optical products, as well as machinery and equipment. Additionally, construction output declined by 0.5%. On a broader scale, over the three months leading to October, the British GDP remained stagnant, showing no growth.

TL;DR

GBP – GDP m.m.png

The latest forecast for the GDP m/m indicates an expected increase of 0.1%, up from the previous figure of -0.3%.

The forthcoming GDP m/m data is scheduled for release on January 12th at 07:00 AM GMT.

The last time, the British GDP m/m was announced on the 13th of December, 2023. You may find the market reaction chart (GBPUSD M5) below:

13-12-2023-GDP-mm-GBP.jpg

USD - Core PPI m/m​

The Core Producer Price Index (PPI) is an important economic indicator, as it tracks the changes in prices that domestic producers receive for their goods, excluding the more volatile elements such as food and energy. This makes it a more reliable gauge of underlying inflation trends, in contrast to the standard PPI, which can be affected by short-term variations in food and energy prices.

In November 2023, the Core Producer Prices in the United States, excluding food and energy costs, showed no change, mirroring the previous month of October. This outcome contrasted with market expectations, which had anticipated a 0.2% increase. On an annual basis, the US core PPI experienced a 2% rise in November, following a downwardly revised 2.3% increase in the prior month, falling short of market forecasts, which had projected a 2.2% advance.

The latest forecast for the Core PPI m/m suggests an expected increase of 0.2%, up from the previous result of 0%.

The upcoming Core PPI m/m data is scheduled for release on Friday, January 12th, at 1:30 PM GMT.

The last time, the US Core PPI m/m was announced on the 13th of December, 2023. You may find the market reaction chart (EURUSD M5) below:

13-12-2023-Core-PPI-mm-USD.jpg

USD - PPI m/m​

As a precursor to consumer inflation, the indicator reflects that when producers raise prices for goods and services, these increased costs are often transferred to the consumer.

In November 2023, producer prices in the US had steadied, following a 0.4% fall in the previous period, and contrary to the forecasts of a 0.1% rise. Prices for both goods and services had remained unchanged. The core PPI, excluding food and energy, was also flat. Within the goods category, gasoline costs had seen the most significant drop at 4.1%, followed by decreases in industrial chemicals, jet fuel, and liquefied petroleum gas. Contrarily, food prices had increased, with chicken eggs experiencing a notable jump of 58.8%, alongside rises in fresh fruits and melons. Utility natural gas and electric power prices had also moved higher. In the services sector, traveler accommodation had gone up by 4%, and there were increases in costs for deposit services, health, beauty, and optical goods retailing, as well as in food and alcohol wholesaling, and apparel, footwear, and accessories retailing. However, margins for automobile retailing had declined by 5.1%, along with decreases in chemicals, portfolio management, furniture, and truck transportation. Looking back a year ago, the headline index had been up 0.9%, while the core gauge had risen by 2%, marking the smallest increase since January 2021.

TL;DR

USD - PPI m.m.png

The latest forecast suggests a rise in the PPI m/m to 0.2%, up from the previous result of 0%.

The upcoming release of the PPI m/m is set for January 12th at 1:30 PM GMT.

The last time, the US PPI m/m data was announced on the 13th of December, 2023. You may find the market reaction chart (EURUSD M5) below:

13-12-2023-PPI-mm-USD.jpg


Disclaimer: The market news provided herein is for informational purposes only and should not be considered trading advice.
 

Daniel LQDFX

Trader
Jul 21, 2023
126
0
22
43

Daily News Update


16 January 2024​

Tuesday​

On Tuesday, January 16th, significant news announcements are on the horizon for Great Britain, Canada, and the United States. Great Britain is poised to unveil its Claimant Count Change, Canada has scheduled the release of its Consumer Price Index (CPI), and the United States is anticipated to announce its Empire State Manufacturing Index. These announcements hold the potential to impact various sectors and markets, making them events to closely monitor in the coming days.​


GBP - Claimant Count Change​

While often considered a trailing metric, the count of individuals without employment remains a vital gauge of the broader economic well-being due to its strong correlation with consumer spending. Additionally, unemployment holds significant importance in the decision-making processes of those responsible for shaping the nation's monetary policies.

In November 2023, the United Kingdom experienced a notable increase in the number of individuals claiming unemployment-related benefits. The count rose to 16,000, a significant jump from the 8,900 reported in October. This figure marked a substantial departure from the average monthly claimant count of 1,640, which had been maintained from 1971 through 2023. This data underscored the dynamic nature of the UK's job market. The highest claimant count on record was 860,400 in April 2020, reflecting the profound impact of the pandemic on employment. In contrast, the lowest count was recorded in June 2021, with a decrease of 169,200 in claimants, signaling a period of recovery and resilience in the job market.

TL;DR
GBP - Claimant Count Change.png
The prediction for the Claimant Count Change indicates a decrease to 3.0K, lower than the prior figure of 16K.

The next release of the Claimant Count Change is scheduled for January 16th at 7:00 AM GMT.

The last time, the British Claimant Count Change data was released on the 12th of December, 2023. You may find the market reaction chart (GBPUSD M5) below:

12-12-2023-Claimant-Count-Change-GBP.jpg

CAD – CPI m/m​

A majority of overall inflation is driven by consumer prices. Inflation significantly impacts currency value as increasing prices compel the central bank to hike interest rates, adhering to their mandate to contain inflation.

Unexpectedly, in November 2023, Canada saw a slight 0.1% rise in consumer prices compared to the previous month, contrary to the market's anticipation of a 0.1% decline. This unforeseen increase in consumer prices was largely due to a small 0.1% increase in gasoline prices, which happened even as crude oil benchmarks continued to fall during that time.

Canada's Consumer Price Index (CPI) is on the brink of a significant turnaround. The latest forecast for the month-on-month (m/m) period suggests a noteworthy decline of -0.2%, a stark contrast to the previous month's modest 0.1% uptick. This anticipated change in CPI reflects evolving economic dynamics and may have implications for consumers and policymakers alike.

The last time, the Canadian CPI m/m was announced on the 19th of December, 2023. You may find the market reaction chart (CADJPY M5) below:

19-12-2023-CPI-mm-CAD.jpg

CAD - Median CPI y/y​

The bulk of overall inflation is attributed to consumer prices. The significance of inflation to the valuation of currency stems from the fact that escalating prices prompt the central bank to increase interest rates, in line with their commitment to controlling inflation.

In November 2023, Canada's median Consumer Price Index (CPI) recorded a year-on-year increase of 3.4%, maintaining the growth rate observed in the previous month and slightly surpassing the market's expectations of a 3.3% rise. Historically, between 1990 and 2023, Canada's median CPI averaged 2.08%, peaking at 5.00% in June 2022 and reaching its lowest at 0.90% in November 1997.

The forecast for Canada's Median Consumer Price Index (CPI) year-over-year remains steady at 3.4%, with no variation from the previous figure.

The last time, the Canadian Median CPI y/y was announced on the 19th of December, 2023. You may find the market reaction charts (CADJPY M5) below:

19-12-2023-Median-CPI-yy-CAD.jpg

CAD - Trimmed CPI y/y​

Consumer prices constitute the majority of total inflation. Inflation plays a crucial role in determining the value of currency, as increasing prices compel central banks to elevate interest rates in adherence to their mandate of containing inflation.

In November 2023, Canada's trimmed-mean Consumer Price Index (CPI) saw a year-on-year increase of 3.5%, reflecting the same growth rate as the previous month and exceeding market expectations of a 3.3% rise. From 1990 to 2023, the average trimmed-mean CPI in Canada was 2.04%, reaching a peak of 5.60% in June 2022 and a low of 0.80% in December 1997.

The forecast for Canada's year-over-year Trimmed Median CPI remains unchanged at 3.4%, consistent with the previous month's figure.

The CPI m/m, y/y, and trimmed data for Canada is scheduled to be released on January 16th at 1:30 PM GMT.

The last time, the Canadian Trimmed CPI y/y was announced on the 19th December, 2023. You may find the market reaction charts (CADJPY M5) below:

19-12-2023-Trimmed-CPI-yy-CAD.jpg

USD - Empire State Manufacturing Index​

The Empire State Manufacturing Index stands as a key indicator of economic vitality. Businesses rapidly adjust to market dynamics, and variations in their outlook often serve as early indicators of upcoming economic activities, including expenditure, recruitment, and investment.

In December 2023, the NY Empire State Manufacturing Index experienced a sharp decline to -14.5, its lowest in four months, reflecting a reduction in New York’s business activity. This represented a significant drop from the 9.1 reading in November and was far below the anticipated forecast of 2. The index revealed a continuous decrease in new orders for the third consecutive month, dropping to -11.3 from -4.9, while shipments also fell, moving from 10 to -6.4. Additionally, there was a notable ongoing decrease in unfilled orders (-24 compared to -23.2), and delivery times shortened more rapidly than at any point since the pandemic began, as indicated by the change from -6.1 to -15.6. Inventory levels also saw a decrease, going from 9.1 to -5.2. Employment experienced a slight decrease (-8.4 from -4.5), with a marginal reduction in the average workweek (-2.4 compared to -3.8). However, there was a decrease in the rate of input price increases (16.7, down from 22.2), while the rate of increase in selling prices remained relatively stable (11.5, slightly up from 11.1). Despite these challenges, firms showed a slight uptick in optimism in December, with the index at 12.1, up from -0.9, yet they remained cautious about near-term prospects.

TL;DR

USD - Empire State Manufacturing Index.png

The forecast for the Empire State Manufacturing Index suggests an improvement to -7.1, up from the previous reading of -14.5.

The next release of the Empire State Manufacturing Index is scheduled for January 16th at 1:30 PM GMT.

The last, the US Empire State Manufacturing Index was announced on the 15th of December, 2023. You may find the market reaction chart (AUDUSD M5) below:

15-12-2023-Empire-State-Manufacturing-Index-USD.jpg


Disclaimer: The market news provided herein is for informational purposes only and should not be considered trading advice.
 

Daniel LQDFX

Trader
Jul 21, 2023
126
0
22
43

Daily News Update


17 January 2024​

Wednesday​


On Wednesday, January 17th, a trio of critical economic data announcements from China, Great Britain, and the United States are set to significantly influence global markets. China is prepared to unveil its Industrial Production statistics, measured year-over-year, offering insights into the country's manufacturing sector's health. Concurrently, Great Britain is expected to release its Consumer Price Index (CPI), also on a year-over-year basis, which will provide valuable information about inflation trends in the UK economy. Over in the United States, the spotlight shifts to consumer behavior, with the release of the monthly Core Retail Sales and Retail Sales figures. These indicators are crucial in assessing the vibrancy of the American consumer market and will give investors and analysts a deeper understanding of current spending patterns in the U.S. economy.


CNY - Industrial Production y/y

Industrial Production y/y is a pivotal indicator of economic well-being, as production plays a major role in driving the economy and swiftly responds to the fluctuations in the business cycle.

In November 2023, China's industrial production saw a notable year-on-year increase of 6.6%, surpassing the previous month's growth of 4.6% and exceeding market expectations of a 5.6% rise. This marked the most rapid expansion in industrial production since February 2022. The increase was primarily driven by accelerated growth in mining (3.9% compared to 2.9% in October), manufacturing (6.7% from 5.1%), and utilities (9.9% up from 1.5%). Notably, production in specific industries saw significant growth; electrical machinery production rose to 10.6% from 9.8% in October, computer and communications increased to 10.6% from 4.8%, and textiles grew slightly to 2.1% from 2.0%. General equipment production also experienced a turnaround, growing by 0.8% after a previous decline of 0.1%. However, the growth rate softened in sectors like non-ferrous metals (10.2%, down from 12.5%) and chemicals (9.6%, down from 12.1%). Additionally, the decline in non-metal mineral output eased to -0.6% from -1.1%. For the first eleven months of 2023, industrial output had registered a growth of 4.3% compared to the same period in 2022.

TL;DR
CNY - Industrial Production y.y.png
The Industrial Production y/y forecast points to a minor dip from the previous figure of 6.6% to 6.3%.

The upcoming release of the Industrial Production y/y data is set for January 17th at 02:00 AM GMT.

The last time, the Chinese Industrial Production y/y was announced on the 15th of December, 2023. You may find the market reaction chart (USDCNH M5) below:

15-12-2023-Industrial-Production-yy-CNY.jpg


GBP - CPI y/y

Consumer prices are the primary drivers of overall inflation. This inflation plays a critical role in the valuation of currency, as increasing prices prompt central banks to elevate interest rates, adhering to their mandate of containing inflation.

In November 2023, the UK witnessed a decline in its annual inflation rate to 3.9%, the lowest since September 2021, dropping from October's 4.6% and falling below the expected 4.4%. This slowdown was largely due to a significant reduction in transport costs, which fell by 1.5% after previously increasing by 0.5%, mainly because of lower motor fuel prices, secondhand car costs, maintenance, repairs, and airfares. The recreation and culture sector also saw prices rise by 5.3%, down from 6.4%, influenced by costs in computer games, theatre admissions, and live music events. Food and non-alcoholic beverage prices increased by 9.1%, less than the prior 10.1%, with notable changes in bread and cereals. There were modest rises in alcoholic beverages and tobacco (10.2% up from 11%), clothing and footwear (5.7% up from 6.2%), and health (7.4% up from 8%). Housing and utilities prices continued to fall, decreasing to 3.4% from 3.5%. However, inflation rates remained unchanged for communication (8.1%), education (4.5%), and restaurants and hotels (7.5%). Additionally, the annual core inflation rate dropped to 5.1%, marking its lowest point since January 2022.

TL;DR
GBP - CPI y.y.png
The forecast for Great Britain's y/y Consumer Price Index (CPI) is expected to stay consistent at 3.9%, mirroring the previous result.

The forthcoming release of Great Britain's year-over-year Consumer Price Index (CPI) is scheduled for January 17th at 07:00 AM GMT.

The last time, the British CPI y/y was announced on the 20th of December, 2023. You may find the market reaction chart (GBPUSD M5) below:

20-12-2023-CPI-yy-GBP.jpg


USD - Core Retail Sales m/m

The month-over-month figures of Core Retail Sales are significant indicators of consumer spending, a vital component of economic growth. By excluding the often volatile food and energy sectors, these Core Retail Sales figures give a more accurate reflection of the underlying patterns in consumer expenditure.

In November 2023, the U.S. saw a slight increase in retail sales, excluding motor vehicles and parts, with a growth of 0.2% over the previous month. This rise, which followed a revised stagnation in October, exceeded market expectations of a 0.1% decrease, signaling a marginal rise in consumer spending in non-automotive sectors.

The projection for the Core Retail Sales m/m suggests that there will be no change from the previous figure, remaining steady at 0.2%.

The last time, the US Core Retail Sales m/m data was announced on the 14th of December, 2023. You may find the market reaction chart (USDCAD M5) below:

14-12-2023-Core-Retail-Sales-mm-USD.jpg


USD - Retail Sales m/m

This metric is recognized as the leading indicator of consumer spending, which forms a substantial part of overall economic activity.

In an unexpected turn, U.S. retail sales in November 2023 rose by 0.3%, a recovery from the revised 0.2% decrease seen in October, and notably higher than the forecasted 0.1% decline. This rise marks a strong start to the holiday shopping season, with substantial growth observed in several sectors. Food services and drinking places led the way with a 1.6% increase, followed by nonstore retailers at 1%, and health and personal care, as well as furniture stores, each recording a 0.9% rise. Clothing stores saw a 0.6% uptick, while motor vehicles and parts dealers increased by 0.5%, and food and beverage stores went up by 0.2%. In contrast, sales at gasoline stations dropped by 2.9% due to falling gas prices. Additionally, decreases were seen in miscellaneous retailers (-2%), electronics and appliance stores (-1.1%), building material and garden equipment suppliers (-0.4%), and general merchandise stores (-0.2%). Excluding autos, gas, building materials, and food services, retail sales showed a robust growth of 0.4%. It's important to highlight that these retail sales figures do not account for inflation adjustments.

TL;DR
USD - Retail Sales m.m.png
The projection for month-over-month Retail Sales suggests that they will remain steady, matching the previous figure of 0.3%.

The upcoming release of the Core Retail Sales m/m and Retail Sales m/m data is scheduled for January 17th at 1:30 PM GMT.

The last time, the US Retail Sales m/m data was announced on the 14th of December, 2023. You may find the market reaction chart (USDCAD M5) below:

14-12-2023-Retail-Sales-mm-USD.jpg


Disclaimer: The market news provided herein is for informational purposes only and should not be considered trading advice.
 

Daniel LQDFX

Trader
Jul 21, 2023
126
0
22
43

Daily News Update


18 January 2024​

Thursday​

On Thursday, January 18th, a significant day for economic news is on the horizon, as both Australia and the United States are poised to release crucial employment data. Australia will announce its latest Employment Change and Unemployment Rate figures, providing insights into the current state of its labor market. Concurrently, the United States is set to release its Unemployment Claims report, offering a snapshot of jobless claims across the country. These announcements are eagerly anticipated by investors and economists alike, as they provide valuable indicators of the economic health and trends in both nations.​


AUD - Employment Change​

The creation of new jobs is a key early sign of consumer spending trends, representing a significant portion of the overall economy.

In a recent economic update, the number of unemployed individuals in the region surged by about 19,000, hitting a new high of 572,000. This increase was observed in both sectors, with full-time job seekers rising by over 10,000 to around 384,000 and part-time seekers by approximately 8,000 to nearly 188,000. In a contrasting trend, the overall employment market showed encouraging signs of expansion, with a significant addition of 61,500 jobs. This pushed the total number of employed individuals to over 14.26 million, surpassing both the anticipated increase of 11,000 and the previous month's gain of 42,700 jobs. The surge was primarily driven by a substantial rise in full-time employment, which grew by 57,000 to almost 9.91 million, accompanied by a smaller yet notable increase in part-time employment by 4,500, bringing the total to 4.35 million. The labor force participation rate also saw an upward movement, reaching 67.2% from 67.0%, exceeding the forecast of 66.9%. Meanwhile, the underemployment rate showed a minor increase, moving up to 6.5% from 6.3%, but still remained significantly below the pre-pandemic levels by 2.2 points.

TL;DR
AUD - Employment Change.png
The latest forecast for Australia's Employment Change reveals a significant decline, with the expected figure now standing at 16.1K, a notable drop from the previous figure of 61.5K.

The forthcoming announcement regarding Employment Change is scheduled for the 18th of January at 12:30 AM GMT.

The last time, the Australian Employment Change was announced on the 14th of December, 2023. You may find the market reaction chart (AUDUSD M5) below:

14-12-2023-Employment-Change-AUD.jpg


AUD – Unemployment Rate​

While often considered a trailing indicator, the unemployment rate is a crucial gauge of the economy's overall well-being, as consumer expenditure is closely linked to the state of the labor market.

In a notable economic development during November 2023, Australia's unemployment rate saw a modest uptick to 3.9%, a marginal rise from the previous month's 3.8% and slightly above the forecasted rate. This figure represented the highest unemployment rate the country had witnessed since May 2022.

The projected forecast for the Unemployment Rate suggests it will remain steady at 3.9%, unchanged from the previous figure.

The next scheduled announcement for the Unemployment Rate is set for January 18th at 12:30 AM GMT.

The last time, the Australian Unemployment Rate was announced on the 14th of December, 2023. You may find the market reaction chart (AUDUSD M5) below:

14-12-2023-Unemployment-Rate-AUD.jpg

USD - Unemployment Claims​

Despite being traditionally seen as a lagging indicator, the unemployment rate holds significant importance as an indicator of the economy's health, given its strong correlation with consumer spending, which is closely tied to labor market conditions. Additionally, the rate of unemployment plays a crucial role in guiding the nation's monetary policy decisions.

In the week ending January 6th, the number of Americans filing for unemployment benefits dipped by 1,000 from the previously revised figure, settling at 202,000. This figure notably outperformed market predictions of 210,000. Additionally, continuing claims saw a decrease of 34,000 from the previous week, totaling 1,834,000, which also came in below market expectations of 1,871,000. These numbers align with other recent employment indicators, highlighting the exceptionally tight labor market conditions in the United States. This situation potentially provides the Federal Reserve with flexibility to extend its hawkish policy stance into 2024 if required as a measure to combat inflation.

In recent economic news, the forecast for unemployment claims shows a modest uptick, rising to 205K from the previous figure of 202K.

The upcoming release of the Unemployment Claims report is scheduled for January 18th at 1:30 PM GMT, serving as a pivotal event for economists, investors, and analysts seeking key insights into the labor market's status.

The last time, the US Unemployment Claims was announced on the 11th of January, 2024. You may find the market reaction chart (GBPUSD M5) below:

11-01-2024-Unemployment-Claims-USD.jpg


Disclaimer: The market news provided herein is for informational purposes only and should not be considered trading advice.
 

Daniel LQDFX

Trader
Jul 21, 2023
126
0
22
43

Daily News Update


19 January 2024​

Friday​

Friday, January 19th, is marked as a key date for economic announcements from both Great Britain and the United States. Great Britain is poised to release its monthly Retail Sales figures, providing insights into consumer spending trends. Simultaneously, the United States will be disclosing its Preliminary University of Michigan Consumer Sentiment Index, offering a snapshot of consumer confidence and economic outlook in the country.​


GBP - Retail Sales m/m​

Monthly Retail Sales serve as the primary indicator of consumer expenditure, which constitutes the bulk of total economic activity.

In November 2023, the United Kingdom experienced a substantial surge in retail sales, which rose by 1.3% from the previous month, significantly outperforming market expectations of a 0.4% increase and marking the strongest growth since January. This upswing was largely attributed to a 2.3% increase in non-food store sales, a notable jump from October's modest 0.2% rise, with retailers citing early Black Friday sales and extensive discounting campaigns as key drivers. Household goods sales also saw a remarkable rise, climbing by 3.5%.

In addition, food stores reported a 0.8% growth in sales, slightly up from the 0.1% increase in October. Sales of automotive fuel also grew, rising by 0.6%, likely aided by falling fuel prices. Meanwhile, non-store retailing, primarily online sales, registered a modest increase of 0.2%.

On a year-over-year basis, retail sales in November edged up by 0.1%, recovering from a revised decline of 2.5% in October. This annual increase was more favorable than the anticipated 1.3% decrease forecasted by market analysts.

TL;DR
GBP - Retail Sales m.m.png
The forecast for Great Britain's monthly Retail Sales indicates a decrease, with a projected figure of 0.4%, which is lower compared to the previous outcome of 1.3%.

The upcoming Retail Sales m/m data is scheduled for release on January 19th at 07:00 AM GMT.

The last time, the British Retail Sales m/m was announced on the 22nd of December, 2023. You may find the market reaction chart (GBPJPY M5) below:

22-12-2023-Retail-Sales-mm-GBP.jpg
USD - Preliminary University of Michigan Consumer Sentiment​

Consumer financial confidence, recognized as a key predictor of consumer spending that makes up a significant portion of all economic activities, is gauged through a survey of approximately 500 consumers. This survey asks participants to evaluate the present and future economic conditions.

In December 2023, the University of Michigan's US Consumer Sentiment Index was revised upwards to a five-month high of 69.7, from an initial estimate of 69.4. This revision came as a result of significant improvements in consumer perceptions of inflation's trajectory. Inflation expectations for the coming year were adjusted down to 3.1% from November's 4.5%, reaching the lowest point since March 2021, aligning with the preliminary estimate. Furthermore, the five-year inflation outlook was slightly higher than initially thought at 2.9%, compared to the first estimate of 2.8%, but still down from November's 3.2%. Additionally, the component of the index that measures consumer expectations rose more than first estimated to 67.4 (versus 66.4 in the preliminary estimate and 56.8 in November), while the gauge for current economic conditions increased to 73.3, although it was slightly below the initial estimate of 74, but still higher than the previous month's 68.3.

TL;DR
USD - Preliminary University of Michigan Consumer Sentiment.png
The projected forecast for the Preliminary UoM Consumer Sentiment data suggests a modest decline, moving from the previous reading of 69.7 to an anticipated 68.8.

The upcoming Preliminary UoM Consumer Sentiment data is scheduled for release on Friday, January 19th, at 3:00 PM GMT.

The last time, the US Preliminary UoM Consumer Sentiment data was announced on 22nd of December, 2023. You may find the market reaction chart (EURUSD M5) below:

22-12-2023-Prelim-UoM-Consumer-Sentiment-USD.jpg


Disclaimer: The market news provided herein is for informational purposes only and should not be considered trading advice.
 

Daniel LQDFX

Trader
Jul 21, 2023
126
0
22
43

Daily News Update


23 January 2024​

Tuesday​

On January 23rd, a pivotal day for financial markets, Japan and New Zealand are poised to make major announcements that could impact global economics. The Bank of Japan is scheduled to reveal its Interest Rate Decision, a critical moment that could influence financial trends and strategies. Simultaneously, New Zealand is set to disclose its Consumer Price Index (CPI) on a quarterly basis, providing key insights into the country's economic health and inflation trends. These announcements are eagerly awaited by investors and policymakers alike, as they could have significant implications for international financial markets.​


JPY – Bank of Japan Interest Rate Decision​

Short-term interest rates stand as the most crucial element in currency valuation, with traders primarily focusing on other indicators to forecast future rate changes.

In its final meeting of the previous year, the Bank of Japan (BoJ) unanimously decided to maintain its key short-term interest rate at -0.1% and the 10-year bond yields at around 0%, as was widely anticipated. The BoJ also kept the flexible upper limit of 1.0% for long-term government bond yields unchanged. In response to the high level of uncertainty both domestically and internationally, the bank committed to continuing its monetary easing policy. The central bank emphasized its strategy to adapt to changes in economic activity, price trends, and financial conditions, with the goal of achieving a sustainable 2% inflation target, in tandem with wage increases. The BoJ also stated its willingness to take additional easing measures if necessary, a stance reinforced by Governor Kazuo Ueda's remarks on the lagging wage increases compared to rising prices and concerns about sustaining the target inflation level.

TL;DR
JPY – Bank of Japan Interest Rate Decision.png
The forecast suggests that there will be no change in the upcoming announcement, with the interest rate expected to remain at the previous level of -0.1%.

The next Interest Rate Decision from the Bank of Japan is scheduled for release at 03:00 AM GMT on January 23rd.

The last time, the Bank of Japan announced its Interest Rate Decision on the 19th of December, 2023. You may find the market reaction chart (USDJPY M5) below:

19-12-2023-BOJ-Press-Conference-JPY.jpg
NZD – CPI q/q​

Inflation, primarily driven by consumer prices, plays a significant role in currency valuation. This is because increasing prices prompt central banks to hike interest rates, adhering to their mandate to control inflation.

In September 2023, New Zealand experienced a significant rise in its Consumer Price Index (CPI), with an increase of 1.80% compared to the 1.1% growth seen in the previous quarter. The transportation sector was notably impacted, showing a 7.1% surge. This was largely attributed to increased costs in private transport supplies and services, which went up by 11.6%, along with a 2.8% rise in vehicle purchases, and a 3.2% increase in passenger transport services.

The housing and household utilities sector also witnessed a considerable growth of 1.7%. This was primarily driven by a sharp 9.4% increase in property rates and related services, a 1.2% rise in actual rentals for housing, and a 0.6% hike in homeownership costs.

Additionally, the food sector recorded a 0.9% increase. Significant contributors to this rise were restaurant meals and ready-to-eat food, which went up by 1.7%, fruit and vegetables increasing by 0.9%, and grocery food seeing a modest rise of 0.2%.

These figures from September 2023 depicted a notable shift in New Zealand’s cost of living and consumer spending, presenting considerable implications for both households and the business sector.

TL;DR
NZD – CPI q.q.png
The forecast for the upcoming New Zealand CPI q/q suggests a figure of 0.3%, compared to the previous quarter’s result of 1.8%.

The upcoming New Zealand CPI q/q is set to be announced at 9:45 PM GMT on January 23rd.

The last time, the New Zealand CPI q/q was announced on the 16th of October, 2023. You may find the market reaction chart (NZDUSD M5) below:

16-10-2023-CPI-qq-NZD.jpg


Disclaimer: The market news provided herein is for informational purposes only and should not be considered trading advice.