Daily News Updates by LQDFX

Daniel LQDFX

Trader
Jul 21, 2023
126
0
22
43

Daily News Update


24 January 2024​

Wednesday​

January 24th is set to be a momentous day in the financial world, marked by a series of major news releases anticipated to impact market movements significantly. France, Germany, and Great Britain are all scheduled to publish their Flash Manufacturing PMI and Flash Services PMI data. Concurrently, the Bank of Canada will announce its Overnight Rate, a key economic indicator. Alongside these developments, the United States will also release its Flash Manufacturing PMI and Flash Services PMI. Adding to the day's significance, the Bank of Canada will hold a press conference, likely to provide further insights into its rate decision and economic outlook.​


EUR - French Flash Manufacturing PMI​

This metric is crucial for evaluating the economic landscape. Businesses often respond quickly to changes in the market, and the perspectives of their purchasing managers provide timely and pertinent information about a company's view of economic conditions. In the survey, around 750 purchasing managers are queried to evaluate the state of different business components, such as employment, production, new orders, prices, supplier deliveries, and inventories.

In December of 2023, the HCOB France Manufacturing PMI had fallen to 42.1 from 42.9 in the previous month, marking the lowest reading on record, aside from the pandemic-induced crash in the second quarter of 2022. This figure was a slight upward revision from the preliminary reading of 42. The decline pointed to the 11th consecutive month of decreasing activity in French manufacturing. This trend was driven by slowing conditions in key markets and increased international competitive pressures, which continued to suppress new orders. As a result, manufacturing output contracted for the 19th consecutive month, and outstanding orders decreased. The low demand for capacity led to reduced purchasing levels and triggered a seventh consecutive month of job losses. In terms of pricing, a renewed decrease in input costs, coupled with intensified competition, compelled firms to lower their output charges. Looking back, French manufacturers had reported a consistent pessimism about the outlook for 2024, although this sentiment had reached its lowest level in five months.

TL;DR
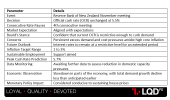
AspectDetail
PMI Value (Dec 2023)42.1
Previous Month's PMI Value42.9
Comparison to Record LowLowest since pandemic in Q2 2022
Preliminary Reading42.0
Consecutive Months of Decline11
Cause of DeclineSlowing market conditions, increased international competition
Manufacturing Output TrendContracted for 19th consecutive month
Orders StatusDecreased
Demand for CapacityLow, leading to reduced purchasing
Employment Trend7th consecutive month of job losses
Pricing ChangesDecrease in input costs; firms lowered output charges due to competition
Outlook for 2024Consistently pessimistic, though sentiment slightly improved in the past 5 months

The projected French Flash Manufacturing PMI is expected to rise to 43, up from the previous figure of 42.1.

The upcoming French Flash Manufacturing PMI is scheduled for January 24th at 08:15 AM GMT.

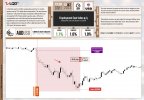
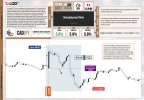
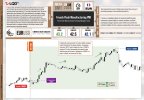
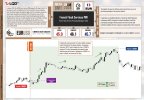
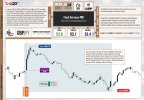
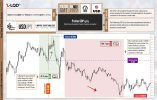
The last time, the French Flash Manufacturing PMI was announced on the 15th of December, 2023. You may find the market reaction chart (EURUSD M5) below:
15-12-2023-French-Flash-Manufacturing-PMI-EUR.jpg

EUR – French Flash Services PMI​

This metric is crucial for evaluating the state of the economy. Businesses often respond quickly to changes in the market, and the views of their purchasing managers provide highly current and pertinent information about the company's perspective on economic conditions. In the survey, around 750 purchasing managers are queried to evaluate various aspects of business, such as employment, production, new orders, prices, supplier deliveries, and inventory levels.

In December 2023, the HCOB France Services PMI rose to 45.7, marking its highest level in four months. This increase surpassed initial estimates and market forecasts, which had been set at 44.3, and was a notable improvement from November's figure of 45.4. Despite this rise, the reading indicated the seventh consecutive month of economic contraction, primarily driven by weak demand conditions. Businesses experienced a decline in new orders for the eighth consecutive month, although the rate of decline eased compared to November’s three-year low. The backlog of orders saw a significant reduction, one of the fastest in over three years, while employment growth remained steady.

Regarding prices, the rate of input price inflation was the lowest since August 2021. However, the prices charged by businesses increased at a moderate pace. In a positive turn, business confidence showed significant improvement, reaching a four-month high.

TL;DR

AspectDetail
PMI Value (Dec 2023)45.7
Comparison to Previous MonthsHighest in four months
Initial Estimates44.3
Previous Month's PMI Value45.4
Consecutive Months of Contraction7
Main Cause of ContractionWeak demand conditions
New Orders TrendDeclined for the 8th consecutive month, but at a slower rate than November
Backlog of OrdersSignificantly reduced, fastest in over three years
Employment GrowthRemained steady

The forecast for French Flash Services PMI suggests a modest increase to 46.4, up from the previous reading of 45.7.

The upcoming French Flash Services PMI release is scheduled to be disclosed on January 24th at 08:15 AM GMT.

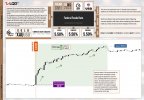
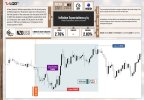
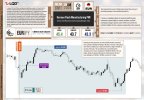
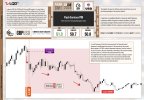
The last time, the French Flash Services PMI was announced on the 15th of December, 2023. You may find the market reaction chart (EURUSD M5) below:
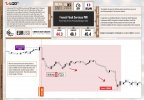
15-12-2023-French-Flash-Services-PMI-EUR.jpg

EUR – German Flash Manufacturing PMI​

This key economic indicator offers a leading insight into the health of the economy, as businesses are known to swiftly respond to fluctuating market conditions. The views of purchasing managers, who are deeply entrenched in the day-to-day operations of their companies, provide some of the most immediate and pertinent perspectives on economic trends. The survey, encompassing responses from approximately 800 purchasing managers, asks these professionals to evaluate various business elements. These elements include employment levels, production rates, new order volumes, pricing trends, the efficiency of supplier deliveries, and the status of inventory stocks. This comprehensive assessment helps paint a clear picture of the current economic landscape.

The HCOB Germany Manufacturing PMI had been revised slightly higher to 43.3 in December 2023, up from a preliminary figure of 43.1, and marking an improvement from November’s 42.6. Despite remaining in contraction territory, there were indications that the manufacturing sector might have passed the worst of its downturn. The period witnessed solid and somewhat accelerated declines in both output and employment. However, more forward-looking indicators had been showing signs of improvement, with new orders falling at their slowest rate in eight months and business expectations turning positive for the first time since the previous April. On the pricing front, manufacturers had continued to reduce factory gate charges amidst competitive pressures and lower input costs. Notably, the rate of decline in output prices had been the slowest in seven months, although still modest. Concurrently, manufacturers had cut workforce numbers at the fastest rate since October 2020, adapting to reduced capacity utilization.

TL;DR

AspectDetail
PMI Value (Dec 2023)43.3
Preliminary PMI Value43.1
Previous Month's PMI Value42.6
General TrendImprovement, but still in contraction
Output and EmploymentSolid declines, somewhat accelerated
New OrdersSlowest rate of decline in eight months
Business ExpectationsTurned positive, first time since previous April
Pricing TrendsReduction in factory gate charges due to competitive pressures and lower input costs
Output PricesSlowest decline in seven months, still modest
Employment TrendFastest workforce reduction since October 2020
Capacity UtilizationAdapted to reduced capacity, hence workforce cuts

The projected German Flash Manufacturing PMI suggests a rise to 44.6, up from the previous reading of 43.3.

The forthcoming release of the German Flash Manufacturing PMI is set to be revealed on January 24th at 08:30 AM GMT.

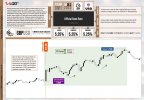
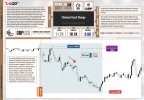
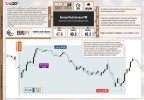
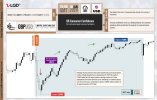
The last time, the German Flash Manufacturing PMI was announced on the 15th of December, 2023. You may find the market reaction chart (EURJPY M5) below:
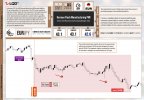
15-12-2023-German-Flash-Manufacturing-PMI-EUR.jpg

EUR – German Flash Services PMI​

The Purchasing Managers’ Index (PMI) is widely recognized as a critical barometer of economic health. This index is pivotal because businesses often respond swiftly to fluctuations in market conditions, and purchasing managers are at the forefront of gauging these changes. They possess up-to-the-minute insights that reflect the company’s perspective on the economy. The PMI is compiled from a survey of approximately 800 purchasing managers. These professionals are asked to evaluate various aspects of business conditions, such as employment, production, new orders, prices, supplier deliveries, and inventory levels. Their responses offer a comprehensive overview of the economic landscape, making the PMI a valuable tool for understanding the current state of the economy.

The HCOB Germany Services PMI was revised upwards to 49.3 in December 2023, from an initial estimate of 48.4, marking a slight increase from November’s figure of 49.6. This revision indicated that the services sector experienced a modest acceleration in its rate of contraction. Factors contributing to this trend included tightened financial conditions, general weakness in the broader economy, and client hesitancy driven by political uncertainty and geopolitical tensions.

The services sector saw a continued decline in new business inflows for the sixth consecutive month, particularly in terms of new work received from international sources. Concurrently, the level of outstanding business further decreased. In response to these challenges, service providers reduced their staff numbers at the fastest rate since June 2020, primarily as a measure to cut costs, which were rising notably due to increased wages. Additionally, a hike in road tolls at the beginning of the month contributed to a sharp and accelerated rise in overall input costs.

Despite these challenges, expectations for business activity over the next 12 months remained relatively stable, with little change from previous forecasts.

TL;DR

AspectDetail
PMI Value (Dec 2023)49.3
Initial Estimate48.4
Previous Month's PMI Value (Nov)49.6
TrendSlight acceleration in rate of contraction
Contributing FactorsTightened financial conditions, economic weakness, political uncertainty, geopolitical tensions
New Business InflowsDeclined for 6th consecutive month, especially from international sources
Outstanding BusinessDecreased
Employment ChangesFastest reduction in staff numbers since June 2020
Reason for Employment ChangesCost cutting, notably due to increased wages
Additional Cost FactorsIncrease in road tolls, leading to sharp rise in overall input costs
Business Activity ExpectationsRelatively stable for the next 12 months

The forecast suggests a rise in the German Flash Services PMI to 49.7, up from the previous figure of 49.3.

The upcoming release of the German Flash Services PMI is scheduled for January 24th at 08:30 AM GMT.

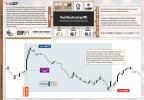
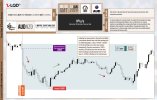
The last time, the German Flash Services PMI was announced on the 15th of December, 2023. You may find the market reaction graph (EURJPY M5) below:
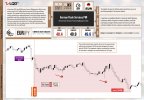
15-12-2023-German-Flash-Services-PMI-EUR.jpg

GBP - Flash Manufacturing PMI​

The Purchasing Managers' Index (PMI) stands as a foremost indicator of economic vitality, reflecting how businesses rapidly adjust to market fluctuations. This survey, encompassing around 650 purchasing managers, serves as a lens into a company's economic outlook, with these managers offering some of the most timely and pertinent insights available. Participants in the survey are asked to evaluate various facets of business conditions, including employment, production, new orders, prices, supplier deliveries, and inventory levels, providing a comprehensive snapshot of the economic environment.

In December 2023, the S&P Global UK Manufacturing PMI had recorded a slight decrease to 46.2, falling just below the initial estimate of 46.4 and marking a decline from November's seven-month high of 47.2. The manufacturing sector experienced its tenth consecutive month of production decline, primarily due to downturns in the consumer and intermediate goods sub-sectors. This reduction in output was attributed to a combination of lower new business intakes, reduced overseas demand, and efforts by manufacturers and their clients to reduce inventory levels.

The sector also saw a continuous decrease in new business inflows for the ninth month in a row. Additionally, there was a significant reduction in backlogs of work, and the industry faced job cuts for the fifteenth consecutive month. In terms of pricing, there was a continued decrease in input costs, while average selling prices experienced a slight increase for the second consecutive month.

Business confidence in the manufacturing sector reached a 12-month low, reflecting concerns over a weakening economy, the closure of client businesses, and the impact of high interest rates.

TL;DR

AspectDetail
PMI Value (Dec 2023)46.2
Initial Estimate46.4
Previous Month's PMI Value (Nov)47.2
Production Trend10th consecutive month of decline
Affected Sub-SectorsConsumer and intermediate goods
Causes of Output ReductionLower new business intakes, reduced overseas demand, inventory reduction efforts
New Business InflowsDecreased for 9th consecutive month
Backlogs of WorkSignificant reduction
EmploymentJob cuts for 15th consecutive month
Pricing TrendsDecrease in input costs, slight increase in average selling prices
Business ConfidenceReached a 12-month low
ConcernsWeakening economy, closure of client businesses, high interest rates

The British Flash Manufacturing PMI is expected to rise to 47 from its previous reading of 46.2, according to the forecast.

The British Flash Manufacturing PMI is set to be released on January 24th at 09:30 AM GMT.

The last time, the British Flash Manufacturing PMI was announced on the 15th of December, 2023. You may find the market reaction chart (GBPAUD M5) below:
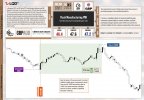
15-12-2023-Flash-Manufacturing-PMI-GBP.jpg

GBP – Flash Services PMI​

In the fast-paced world of economics, businesses are often the first to sense shifts in market conditions. Their responses are crucial indicators of economic health. At the forefront of this insight are purchasing managers, whose perspectives offer a direct glimpse into a company's outlook on the economy. To tap into this valuable source of information, a survey of approximately 650 purchasing managers is conducted. This survey probes these professionals to assess various aspects of business conditions. Key areas of focus include employment trends, production rates, new orders, pricing dynamics, supplier delivery performance, and inventory levels. Their responses provide a real-time barometer of the economic landscape, making it a vital tool for understanding market trends.

In a noteworthy deviation from Eurozone trends, the UK services sector experienced a significant boost in December 2023, with the S&P Global/CIPS UK Services PMI rising to 53.4, the highest since June and above expectations. This growth, marking a second consecutive month of expansion, is mainly attributed to increased new orders, particularly in financial and technology sectors, suggesting a revival in consumer demand. This positive development occurs despite ongoing economic challenges such as high living costs, tight budgets, and restrictive monetary policies by the Bank of England. While the sector faces rising operating costs and wage pressures, leading to the highest input cost inflation since August and cautious hiring, there is a growing optimism about future business conditions, reaching a seven-month high, indicating a resilient and potentially robust outlook for the UK services sector.

TL;DR

AspectDetail
PMI Value (Dec 2023)53.4
Comparison to Previous MonthsHighest since June, above expectations
TrendSecond consecutive month of expansion
Main Growth DriversIncreased new orders, especially in financial and technology sectors
Contextual ChallengesHigh living costs, tight budgets, restrictive monetary policies
Operating Costs and WagesRising, leading to highest input cost inflation since August
Hiring PracticesCautious
Business OptimismGrowing, reaching a seven-month high
Sector OutlookResilient and potentially robust

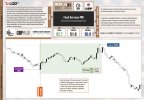
The latest forecast for the British Flash Services PMI suggests an expansion at 53.0, which is marginally lower than the previous figure of 53.4.

The British Flash Services PMI is set to be released on January 24th at 09:30 AM GMT.

The last time, the British Flash Services PMI was announced on the 15th of December, 2023. You may find the market reaction chart (GBPAUD M5) below:
15-12-2023-Flash-Services-PMI-GBP.jpg

CAD - Overnight Rate​

In the dynamic world of currency trading, short-term interest rates have emerged as the key factor influencing currency valuation. According to industry experts, traders prioritize these rates above all other economic indicators. The central focus is not just on the current rates but significantly on their future trajectory. Traders meticulously analyze various economic indicators, but their primary goal is to forecast how these rates will shift in the future. This approach underscores the critical role that short-term interest rates play in shaping the valuation of currencies in the global financial market.

In December 2023, the Bank of Canada made the decision to maintain its target for the overnight rate at 5% for the third consecutive meeting, aligning with market expectations and leaving borrowing costs at their highest in 22 years. Policymakers had observed signs suggesting that their monetary policy was effectively moderating spending and easing price pressures. Despite this, there remained a cautious stance regarding the inflation outlook, with the Bank expressing readiness to increase the policy rate further if necessary. The central focus for the Bank was to achieve a sustained reduction in core inflation. It continued to closely monitor the balance between demand and supply in the economy, inflation expectations, wage growth, and corporate pricing behavior. Additionally, the Bank confirmed its ongoing commitment to quantitative tightening, reflecting its strategic approach to managing the economic challenges at the time.

TL;DR

AspectDetail
Overnight Rate DecisionMaintained at 5%
Consecutive Meetings at This Rate3
Market ExpectationAligned with decision
Borrowing CostsHighest in 22 years
Monetary Policy ImpactModerating spending, easing price pressures
Stance on InflationCautious, readiness to increase rate if necessary
Primary FocusSustained reduction in core inflation
Monitoring FocusBalance between demand and supply, inflation expectations, wage growth, corporate pricing behavior
Quantitative TighteningOngoing commitment

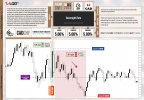
The forecast for the upcoming Bank of Canada Overnight Rate suggests it will remain unchanged at 5.00%, consistent with the previous announcement.

The upcoming Bank of Canada Overnight Rate announcement is scheduled for January 24th at 2:45 PM GMT.

The last time, the Canadian Overnight Rate was announced on the 6th of December, 2023. You may find the market reaction chart (CADCHF M5) below:
06-12-2023-Overnight-Rate-CAD.jpg

USD – Flash Manufacturing PMI​

As a primary indicator of economic well-being, businesses swiftly respond to market fluctuations, and their purchasing managers often possess the most up-to-date and pertinent understanding of the company's economic perspective. A survey encompassing approximately 800 purchasing managers is conducted, where these professionals are queried to evaluate various aspects of business conditions such as employment, production, new orders, prices, supplier deliveries, and inventory levels.

In December 2023, the U.S. manufacturing sector experienced a marked downturn, with the S&P Global U.S. Manufacturing PMI being revised to a lower rate of 47.9 from the initial 48.2 estimate, indicating a more severe decline compared to November. This was due to a decrease in output and an accelerated drop in new orders, reflecting weak demand both domestically and abroad. Manufacturers responded by cutting down on input purchases and hiring. The industry faced increased inflationary pressures, with costs rising sharply due to higher prices for metals, plastics, and transportation. Although selling prices increased at the fastest rate since April, overall client demand remained low, leading to a reduction in employment for the third month in a row. Despite these challenges, there was a slight improvement in business confidence, reaching a three-month high.

TL;DR

AspectDetail
PMI Value (Dec 2023)47.9
Initial Estimate48.2
Comparison to NovemberMore severe decline
Output TrendDecrease
New OrdersAccelerated drop
Demand ConditionsWeak, both domestically and abroad
Manufacturer ResponsesReduced input purchases and hiring
Inflationary PressuresIncreased, with higher costs for metals, plastics, and transportation
Selling PricesIncreased at fastest rate since April
Client DemandRemained low
Employment TrendReduction for the third consecutive month
Business ConfidenceSlight improvement, three-month high

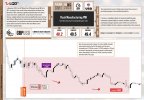
The latest projection for the US Flash Manufacturing PMI suggests a contraction, with an anticipated figure of 47.2. This represents a slight decrease from the previous figure of 47.9.

The forthcoming release of the US Flash Manufacturing PMI is scheduled for January 24th at 2:45 PM GMT.

The last time, the US Flash Manufacturing PMI was announced on the 15th of December, 2023. You may find the market reaction chart (GBPUSD M5) below:
15-12-2023-Flash-Manufacturing-PMI-USD.jpg

USD – Flash Services PMI​

The Purchasing Managers’ Index (PMI) stands out as a significant indicator of economic health, offering early insights into the state of the economy. Businesses react promptly to changing market conditions, and purchasing managers are uniquely positioned to provide current and invaluable perspectives. This survey involves around 400 purchasing managers who are surveyed to gauge their evaluations of different facets of business conditions, including employment, production, new orders, pricing, supplier deliveries, and inventory levels.

In December 2023, the S&P Global US Services PMI underwent a slight upward revision, reaching 51.4 from an initial estimate of 51.3. This revision highlighted the continued strength of the services sector, representing the most robust growth seen in five months. The improved output was driven by heightened demand conditions, with new orders surging at their fastest rate since June. Businesses were buoyed by the positive sales environment, leading to an increase in hiring activity. However, service providers also faced rising input costs due to higher wages and food prices, contributing to inflation. Nonetheless, efforts to stimulate new sales tempered the increase in output charges. Notably, business confidence saw a modest uptick, fueled by expectations of increased client demand, potential interest rate reductions, and investments in advertising and new product development.

TL;DR

AspectDetail
PMI Value (Dec 2023)51.4
Initial Estimate51.3
Growth IndicatorMost robust in five months
Output DriversHeightened demand, fastest new orders rate since June
Hiring ActivityIncrease due to positive sales environment
Input CostsRising, influenced by higher wages and food prices
Inflation ContributionSignificant, despite efforts to stimulate new sales
Output Charge AdjustmentsTempered increase
Business ConfidenceModest uptick
Confidence FactorsExpectations of increased client demand, potential interest rate reductions, advertising and new product investments

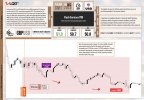
The projected figure for the US Flash Services PMI indicates a continuing expansion, though at a slightly reduced rate, with a forecast of 51.0 compared to the previous outcome of 51.4.

The upcoming release of the US Flash Services PMI is set for January 24th at 2:45 PM GMT.

The last time, the US Flash Services PMI was announced on the 15th of December, 2023. You may find the market reaction chart (GBPUSD M5) below:
15-12-2023-Flash-Services-PMI-USD.jpg

CAD – BOC Press Conference​

This is one of the main ways the Bank of Canada interacts with investors about its monetary policy. It thoroughly discusses the elements influencing the latest decision on interest rates, including the general economic forecast and inflation. Crucially, it offers hints about potential future monetary policy directions.

In the Monetary Policy Report Press Conference opening statement held on October 25, 2023, the Bank of Canada announced that they had maintained the policy interest rate at 5% and continued the policy of quantitative tightening. Although inflation had decreased since the summer of 2022, it was still considered high. The Bank had kept the policy rate steady to allow monetary policy to work on cooling the economy and alleviating price pressures. They expected further easing of inflation, although it might be slow, and had noted an increase in inflationary risks. The statement also highlighted the global economic context, geopolitical tensions, and the importance of monitoring various economic indicators and policy decisions in the future.

TL;DR

AspectDetail
Policy Interest Rate DecisionMaintained at 5%
Quantitative TighteningContinued
Inflation StatusDecreased since summer 2022 but still high
Reason for Steady Policy RateTo cool the economy and alleviate price pressures
Inflation OutlookExpected further easing, though slow
Inflationary RisksIncreased
Global Economic ContextHighlighted as important factor
Geopolitical TensionsNoted as a consideration
Future Policy MonitoringEmphasis on monitoring various economic indicators and making future policy decisions

The Bank of Canada (BOC) Press Conference is scheduled to take place on January 24th at 4:00 PM GMT.


Disclaimer: The market news provided herein is for informational purposes only and should not be considered trading advice.
 

Daniel LQDFX

Trader
Jul 21, 2023
126
0
22
43

Daily News Update


25 January 2024​

Thursday​

On January 25th, significant announcements are expected from both Europe and the United States. The European Central Bank is scheduled to release its Main Refinancing Rate. Meanwhile, the U.S. will be unveiling its Advance GDP quarter-over-quarter and Unemployment Claims data. Subsequently, the European Central Bank will conduct a press conference.​


EUR – ECB Main Refinancing Rate​

In the world of currency valuation, short-term interest rates reign supreme, with traders closely scrutinizing various indicators primarily as tools to forecast future rate fluctuations. The pivotal decision on setting these rates within the Eurozone falls to a panel of 6 members from the ECB Executive Board and 15 of the 19 governors representing the Euro area central banks, who participate in this process through a rotation system. It’s worth noting that the specific breakdown of votes in this decision-making process remains undisclosed to the public.

At its previous meeting on December 14, 2023, the European Central Bank (ECB) had decided to maintain interest rates at their multi-year highs for the second consecutive time, as part of its efforts to combat high inflation. The main refinancing operations rate was held steady at a 22-year peak of 4.5%, while the deposit facility rate remained at a record high of 4%. The ECB also had announced that full reinvestment under the Pandemic Emergency Purchase Programme (PEPP) would end on June 30, followed by a monthly decrease in the portfolio by €7.5 billion until the end of 2024. Policymakers had pledged to keep rates at sufficiently restrictive levels as long as necessary to bring inflation back to the target. At that time, the ECB had projected inflation to average 5.4% in 2023, decreasing to 2.7% in 2024, 2.1% in 2025, and 1.9% in 2026, with the core rate slightly higher. The focus had then shifted to President Lagarde’s comments, particularly concerning the ECB’s stance on speculations of potential interest-rate cuts.

TL;DR

EUR – ECB Main Refinancing Rate.png

The ECB Main Refinancing Rate forecast suggests it will remain unchanged at 4.50%, mirroring the previous outcome.

The forthcoming release of the ECB Main Refinancing Rate is set for January 25th at 1:15 PM GMT.

The last time, ECB Main Refinancing Rate was announced on the 14th of December, 2023. You may find the market reaction chart (EURUSD M5) below:

14-12-2023-Main-Refinancing-Rate-EUR.jpg

EUR – ECB Press Conference​

As a key means of communication with investors, the ECB employs this method to convey its stance on monetary policy. It provides a detailed analysis of the factors influencing recent interest rate decisions and other policy measures, including the broader economic outlook and inflation trends. Importantly, it offers valuable hints about the direction of future monetary policy, making it a crucial resource for investors and financial markets alike.

The European Central Bank (ECB) Press Conference is scheduled for January 25th at 1:45 PM GMT.


USD – Advance GDP q/q​

Advance GDP q/q is the most comprehensive indicator of economic performance and serves as the key indicator of the economy’s overall condition.

In the third quarter of 2023, the U.S. economy experienced a robust surge, achieving an annualized growth rate of 4.9%, surpassing expectations, and marking its most vigorous expansion since late 2021. This upturn was propelled by a substantial boost in consumer spending, notably in sectors such as housing, utilities, healthcare, and more. Additionally, there was a significant rebound in exports, which rose by 6.2%, along with a noticeable uptick in imports. Private inventories made a positive contribution to growth after three consecutive quarters of decline. Furthermore, residential investment saw its first increase in nearly two years, and government spending accelerated. However, nonresidential investment contracted, primarily attributed to declines in equipment and a slowdown in structural investments.

TL;DR

USD – Advance GDP q.q.png

The forthcoming release of the Advance GDP q/q data indicates an anticipated decrease, moving from the prior growth rate of 4.9% to a projected more modest rate of 2.3%.

The release of Advance GDP q/q is set for January 25th at 1:30 PM GMT.

The last time, US Advance GDP q/q was announced on the 26th of October, 2023. You may find the market reaction chart (USDJPY M5) below:

26-10-2023-Advance-GDP-qq-USD.jpg

USD – Unemployment Claims​

While commonly regarded as a lagging indicator, the count of individuals without employment holds substantial significance in gauging the overall economic well-being. This is primarily due to the strong correlation between labor market conditions and consumer spending. Moreover, unemployment stands as a pivotal factor for those tasked with guiding the nation’s monetary policy.

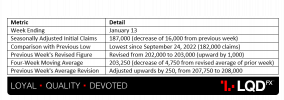
In the week ending January 13, there were 187,000 seasonally adjusted initial claims, marking a decrease of 16,000 from the revised figure of the previous week. This represented the lowest level of initial claims since September 24, 2022, when they had stood at 182,000. The figure for the previous week had been revised upward by 1,000, from 202,000 to 203,000. The four-week moving average was reported at 203,250, reflecting a decrease of 4,750 from the revised average of the prior week. Additionally, the average for the week before had been adjusted upwards by 250, from 207,750 to 208,000.

TL;DR

USD – Unemployment Claims.png

The anticipated data for Unemployment Claims shows a rise to 192K, exceeding the previous figure of 187K.

The upcoming release of Unemployment Claims data is scheduled for January 25 at 1:30 PM GMT.

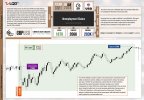
The last time, US Unemployment Claims data was announced on the 18th of January, 2024. You may find the market reaction chart (GBPUSD M5) below:

18-01-2024-Unemployment-Claims-USD.jpg


Disclaimer: The market news provided herein is for informational purposes only and should not be considered trading advice.
 

Attachments

  • USD – Unemployment Claims.png
    USD – Unemployment Claims.png
    32.2 KB · Views: 0

Daniel LQDFX

Trader
Jul 21, 2023
126
0
22
43

Daily News Update


26 January 2024​

Friday​

On January 26th, a notable news event is scheduled in the US, with the release of its monthly Core PCE Price Index.​


USD - Core PCE Price Index m/m​

The Core PCE Price Index is the primary measure of inflation used by the Federal Reserve. Inflation plays a crucial role in the valuation of currency, as increasing prices compel the central bank to elevate interest rates to adhere to their mandate of containing inflation.

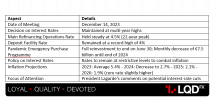
In November 2023, the core Personal Consumption Expenditures (PCE) price index in the United States, which excluded the more volatile food and energy sectors, showed a slight month-on-month increase of 0.1%, falling below the expected 0.2% rise. This outcome was in line with the previous month's revised rate, continuing a trend of slowing inflation, a key focus of the Federal Reserve. This ongoing disinflation across various pricing metrics fed into the anticipation that the Federal Reserve might lower borrowing rates multiple times in the forthcoming year. On a year-over-year basis, the core PCE prices rose by 3.2%, less than the forecasted 3.3%, and represented a deceleration from October's adjusted increase of 3.5%.

TL;DR

  • November 2023's US core PCE price index rose 0.1% month-on-month, less than the expected 0.2%.
  • The year-over-year increase was 3.2%, lower than the anticipated 3.3%.
  • This data reflects a continuation of the trend of slowing inflation.
  • The trend is feeding expectations of multiple Federal Reserve rate cuts in the upcoming year.
The projected Core PCE Price Index is anticipated to show an increase to 0.2%, up from the previous result of 0.1%.

The upcoming release of the monthly Core PCE Price Index is scheduled for January 26th at 1:30 PM GMT.

The last time, US Core PCE Price Index m/m was announced on the 22nd of December, 2023. You may find the market reaction chart (USOIL M5) below:

22-12-2023-Core-PCE-Price-Index-mm-USD.jpg


Disclaimer: The market news provided herein is for informational purposes only and should not be considered trading advice.
 

Daniel LQDFX

Trader
Jul 21, 2023
126
0
22
43
30th January 2024

Tuesday


The United States is poised for a pivotal day on January 30th, with key economic indicators set to be unveiled. The nation awaits the release of the Consumer Confidence Index by the Conference Board, a critical measure of the economic outlook from the consumer perspective. In addition, the Job Openings and Labor Turnover Survey (JOLTS) data will be announced, providing insights into the current state of job openings across the country. These releases are expected to shed light on the economic health of the U.S. and could have significant implications for markets and policy decisions.


USD - CB Consumer Confidence

Financial confidence, a pivotal indicator of consumer spending that constitutes a major portion of overall economic activity, is assessed through a survey of approximately 3,000 households, where participants are asked to evaluate current and future economic conditions, including labor availability, business conditions, and the general economic situation.

In December, the Conference Board Consumer Confidence Index saw an increase to 110.7, up from a revised 101.0 in November. This rise was attributed to improved perceptions of current business conditions and job prospects, as reflected in the Present Situation Index climbing to 148.5. Additionally, the Expectations Index, which gauges short-term income, business, and labor market outlook, jumped to 85.6, returning to levels of optimism last seen in July. According to Dana Peterson, Chief Economist at The Conference Board, December's boost in confidence was widespread across all age groups and income levels, with significant gains in the 35-54 age group and households earning above $125,000. Despite ongoing concerns about rising prices, political issues, interest rates, and global conflicts decreased as primary concerns. The perceived likelihood of a U.S. recession in the next year also diminished, reaching its lowest point in 2023, though a significant portion still anticipates a potential downturn in 2024.


TL;DR


    • Consumer Confidence Index rose to 110.7 in December, up from November's 101.0.
    • Present Situation Index at 148.5; Expectations Index at 85.6, matching July's optimism.
    • Confidence gains across all age and income groups, notably among 35-54 and those earning above $125,000.
    • Concerns about prices, politics, interest rates, and conflicts lessened.
    • Lowest recession likelihood for 2023 noted, but 2024 downturn concerns remain.
The CB Consumer Confidence forecast suggests a modest increase from the previous reading of 110.7 to 111.5.

The upcoming release of the US CB Consumer Confidence report is scheduled for announcement January 30th at 3:00 PM GMT.

The last time, US CB Consumer Confidence report was announced on the 20th of December, 2023. You may find the market reaction chart (AUDUSD M5) below:


20-12-2023-CB-Consumer-Confidence-USD.jpg


USD - JOLTS Job Openings

Despite its delayed release compared to other data, traders closely monitor this information due to its significant potential to impact the market. The number of job vacancies serves as an early indicator of the broader employment situation, underscoring its importance for market participants.

In November 2023, the number of job openings decreased by 62,000 compared to the previous month, reaching 8.790 million. This marked the lowest level since March 2021 and fell below the market consensus of 8.85 million. It was the third consecutive month of declines in US job openings, reflecting the ongoing easing of labor market conditions. During the month, job openings decreased in transportation, warehousing, and utilities (-128,000) as well as in the federal government (-58,000). On the other hand, job openings increased in wholesale trade (+63,000). In terms of regional distribution, job openings fell in the South (-128,000), the Northeast (-29,000), and the West (-7,000), but they rose in the Midwest (+102,000).

TL;DR

CategoryChangeDetails
Total Job Openings-62,000Decreased to 8.790 million, lowest since March 2021.
Market ConsensusBelowFell below the expected 8.85 million.
Consecutive Declines3rd MonthThird consecutive month of decline.
Transportation, Warehousing, & Utilities-128,000Significant decrease in job openings.
Federal Government-58,000Decrease in job openings.
Wholesale Trade+63,000Increase in job openings.
Regional Distribution:
- South-128,000Decrease in job openings.
- Northeast-29,000Decrease in job openings.
- West-7,000Slight decrease in job openings.
- Midwest+102,000Increase in job openings.


Projections for the JOLTS Job Openings suggest a modest drop to 8.69 million, down from the previous figure of 8.79 million.

The upcoming release of JOLTS Job Openings is scheduled for January 30th at 3:00 PM GMT.

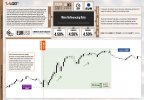
The last time, the US JOLTS Job Openings was announced on the 3rd of January, 2024. You may find the market reaction chart (GBPUSD M5) below:


03-01-2024-JOLTS-Job-Openings-USD.jpg


Disclaimer: The market news provided herein is for informational purposes only and should not be considered trading advice.
 

Daniel LQDFX

Trader
Jul 21, 2023
126
0
22
43

Daily News Update


31 January 2024​

Wednesday​

On January 31st, global financial markets are set to experience significant volatility due to a series of key economic announcements from major economies. Australia will release its Consumer Price Index (CPI), followed by China's Manufacturing Purchasing Managers' Index (PMI). Germany will announce its Preliminary CPI, and the United States is scheduled to publish both the ADP Non-Farm Employment Change and the Employment Cost Index. Additionally, Canada will disclose its monthly GDP figures. The day's events will culminate with the US Federal Reserve's decision on the Federal Funds Rate and a closely-watched press conference by the Federal Open Market Committee (FOMC), making it a critical day for investors and market analysts worldwide.​


AUD - CPI q/q​

The majority of overall inflation is reflected in consumer prices. Inflation plays a crucial role in the valuation of currency, as it prompts central banks to increase interest rates. This action is typically taken to adhere to their mandate of containing inflation, ensuring economic stability.

In the third quarter of 2023, Australia's consumer prices exhibited a notable acceleration, rising by 1.2% quarter-on-quarter. This exceeded market projections, which had anticipated a more modest 1.1% increase, and marked a substantial uptick from the 0.8% gain observed in the preceding period.

The projected CPI q/q basis shows an expectation of 0.8%, which is lower than the previous figure of 1.2%.

The last time, the Australian CPI q/q was announced on the 25th of October, 2023. You may find the market reaction chart (AUDUSD M5) below:

25-10-2023-CPI-qq-AUD.jpg

AUD - Australia Monthly CPI Indicator​

Consumer prices make up a significant portion of total inflation. Inflation plays a crucial role in the valuation of currency, as increasing prices compel the central bank to hike interest rates, adhering to their mandate to control inflation.

In Australia, the Consumer Price Index (CPI) for the month ending in November 2023 had seen an annual increase of 4.3%, a decrease from the 4.9% rise in October and slightly below the anticipated 4.4%. This marked the second consecutive month of a declining yearly inflation rate, reaching its lowest since January 2022. This slowdown was influenced by a reduction in the growth rate of food prices, which had increased by 4.6% compared to 5.3% in October, and transport costs, especially fuel prices, rising by 3.6% versus 5.9%. Additionally, there was a deceleration in the cost increase for health services (5.2% compared to 6.3%), and recreation and culture activities (1.2% compared to 2.7%). There were also price decreases in furnishings, household equipment & services (-0.3% versus 0.4%), and clothing and footwear (-0.9% versus -1.5%). On the other hand, housing costs had seen a faster increase of 6.6% compared to 6.1%, driven by higher rents, costs of new dwellings for owner-occupiers, and electricity prices. The monthly CPI, excluding volatile items and travel, had gone up by 4.8% in November, down from the 5.1% increase in October. Inflation continued to remain above the Reserve Bank of Australia's target range of 2-3%.

TL;DR
CategoryNovember 2023 IncreaseOctober 2023 Increase
Overall Annual CPI Increase4.3%4.9%
Food Prices4.6%5.3%
Transport Costs (especially fuel)3.6%5.9%
Health Services5.2%6.3%
Recreation and Culture Activities1.2%2.7%
Furnishings, Household Equipment & Services-0.3%0.4%
Clothing and Footwear-0.9%-1.5%
Housing Costs6.6%6.1%
Monthly CPI Excluding Volatile Items & Travel4.8%5.1%

The forecast for Australia's Monthly Consumer Price Index (CPI) indicates a drop to 3.6% from the earlier figure of 4.3%.


AUD - Trimmed Mean CPI q/q​

The majority of overall inflation is attributed to consumer prices. Inflation significantly impacts the value of currency, as increased prices prompt the central bank to elevate interest rates in adherence to their mandate of containing inflation.

In the third quarter of 2023, the Reserve Bank of Australia's trimmed-mean Consumer Price Index (CPI) had shown an uptick, increasing by 1.2% quarter-on-quarter. This had exceeded market projections of a 1.1% rise and had marked an acceleration from the previously revised 1.0% increase in the preceding period.

The forecast suggests a decline to 0.9% from the previous outcome of 1.2%.

The forthcoming release of Australia's CPI is scheduled for January 31st at 00:30 AM GMT.

The last time, the Australian Trimmed Mean CPI q/q was announced on the 25th of October, 2023. You may find the market reaction chart (AUDUSD M5) below:

25-10-2023-Trimmed-Mean-CPI-qq-AUD.jpg

CNY - Manufacturing PMI​

It serves as a pivotal gauge for the economic well-being, as businesses are swift in responding to market dynamics. Among those who possess the most up-to-date and pertinent insights into a company's economic outlook are its purchasing managers. This indicator is derived through a survey conducted among 3,000 purchasing managers, in which respondents evaluate the current status of various business aspects such as employment, production, new orders, pricing, supplier deliveries, and inventory levels.

In December 2023, China's official NBS Manufacturing PMI took an unexpected dip to 49.0, down from the previous month's 49.4 and falling short of the market's predicted 49.5. This marked the third consecutive month of factory activity contraction and the most significant decline in six months. The downturn was attributed to a faltering recovery, influenced by weaknesses in the property sector, deflationary risks, and mounting global challenges. New orders experienced their fastest rate of reduction since June, declining from 48.7 to 49.4 in November. Foreign sales continued to decline for the ninth straight month, dropping from 45.8 to 46.3, while purchasing activity remained subdued, shifting from 49.0 to 49.6. Furthermore, employment in the sector declined for the tenth month in a row, with the most significant drop in the period, going from 47.1 to 48.1. Output growth hit a five-month low, although delivery times stayed stable at 50.3. Regarding prices, input cost inflation increased, reversing a trend that had seen it at its lowest level in five months (rising from 51.5 to 50.7), while output prices continued to fall (from 47.7 to 48.2). Finally, business sentiment in the manufacturing sector improved, reaching its highest point since February, moving from 55.9 to 55.8.

TL;DR
IndicatorDecember 2023November 2023Change
Overall NBS Manufacturing PMI49.049.4Decrease
New Orders49.448.7Decrease
Foreign Sales46.345.8Decrease
Purchasing Activity49.649.0Decrease
Employment48.147.1Decrease
Output Growth5-month low-Decrease
Delivery Times50.350.3Stable
Input Cost Inflation50.751.5Increase
Output Prices48.247.7Decrease
Business Sentiment55.855.9Increase

The projected Manufacturing PMI shows a modest uptick to 49.2 from the earlier figure of 49.0.

The upcoming release of the Manufacturing PMI is scheduled for January 31st at 1:30 AM GMT.

The last time, Chinese Manufacturing PMI was announced on the 31st of December, 2023. You may find the market reaction chart (USDCNY M5) below:

31-12-2023-Manufacturing-PMI-CNY.jpg

EUR - German Prelim CPI m/m​

Consumer prices predominantly drive overall inflation. In the context of currency valuation, inflation holds significant importance, as rising prices often lead the central bank to raise interest rates in line with their responsibility to manage and control inflation.

In a recent update on Germany's economic indicators, the Consumer Price Index saw a slight uptick of 0.10% in December 2023 when compared to the previous month. Historical data indicates that since 1950, Germany's average monthly inflation rate has stood at 0.21%. The highest monthly increase on record occurred in October 1951 at 3.10%, while the lowest recorded was a decline of -2.73% in January 1950.

The latest forecast reveals an anticipated increase of 0.4%, up from the previous figure of 0.1%.

The upcoming release of the German Preliminary CPI m/m is scheduled for January 31st at 1:00 PM GMT.

The last time, German Preliminary CPI m/m was announced on the 4th of January, 2024. You may find the market reaction chart (EURJPY M5) below:

04-01-2024-German-Prelim-CPI-mm-EUR.jpg

USD - ADP Non-Farm Employment Change​

The generation of new jobs serves as a vital leading indicator for consumer spending, a significant driver of overall economic activity. These job creation estimates are obtained through the analysis of payroll data encompassing over 25 million workers by ADP.

In December 2023, private businesses in the United States added 164,000 workers to their payrolls, surpassing both the downwardly revised figure of 101,000 in November and the forecasted 115,000. The leisure and hospitality sector led the job creation with the addition of 59,000 positions, followed by education/health services (42,000), construction (24,000), financial activities (18,000), and trade/transportation/utilities (15,000). However, job losses were observed in manufacturing (-13,000), information services (-2,000), and natural resources and mining (-2,000). Meanwhile, the pace of wage growth continued to decelerate, with job-stayers experiencing a 5.4% increase in earnings, while those changing jobs saw an 8% rise. Nela Richardson, the chief economist at ADP, remarked, "We are witnessing a return to a labor market reminiscent of pre-pandemic hiring. Although wage growth did not drive the recent inflationary pressures, the retreat in pay growth has substantially reduced the risk of a wage-price spiral."

TL;DR
SectorJob Change (December 2023)Notable Details
Total Private Sector+164,000Surpassed November's 101,000 and forecast of 115,000
Leisure and Hospitality+59,000Leading sector in job creation
Education/Health Services+42,000-
Construction+24,000-
Financial Activities+18,000-
Trade/Transportation/Utilities+15,000-
Manufacturing-13,000Job losses observed
Information Services-2,000Job losses observed
Natural Resources and Mining-2,000Job losses observed
Wage Growth-Job-stayers: +5.4%, Job-changers: +8%

The ADP Non-Farm Employment Change forecast is showing a decrease to 125,000, down from the previous figure of 164,000.

The forthcoming ADP Non-Farm Employment Change report is scheduled for January 31st at 1:15 PM GMT.

The last time, the US ADP Non-Farm Employment Change report was announced on the 4th of January, 2024. You may find the market reaction chart (GBPUSD M5) below:

04-01-2024-ADP-Non-Farm-Employment-Change-USD.jpg

CAD - GDP m/m​

GDP month-to-month is the most comprehensive indicator of economic activity and serves as the primary indicator of the economy's overall well-being.

In November 2023, Canada's economy is anticipated to have experienced a modest growth of 0.1%, according to preliminary data. This growth was driven by advancements in the manufacturing, transportation, warehousing, agriculture, forestry, fishing, and hunting sectors, which helped to balance the declines observed in retail trade. October's economic performance showcased stability for the third consecutive month, characterized by a 0.1% rise in services-producing industries, while goods-producing industries remained largely unchanged. Notably, retail trade witnessed a significant 1.2% increase, the highest since January. The mining, quarrying, and oil and gas extraction sector also saw a 1% increase, recovering from two months of decline. In contrast, the manufacturing sector experienced a downturn for the fourth time in five months, with a 0.6% decrease in October, predominantly in durable goods manufacturing, which fell by 1.3%. However, non-durable goods manufacturing slightly improved by 0.2%, marking its second consecutive month of growth. Moreover, the wholesale trade sector experienced a decline of 0.7%

TL;DR
SectorNovember 2023 Growth (Preliminary)October 2023 Growth
Overall Economic Growth+0.1%-
ManufacturingGrowth-0.6% Decrease
Transportation and WarehousingGrowth-
Agriculture, Forestry, Fishing, and HuntingGrowth-
Retail TradeDecline+1.2% Increase
Services-Producing Industries-+0.1% Increase
Goods-Producing IndustriesLargely UnchangedLargely Unchanged
Mining, Quarrying, and Oil and Gas Extraction-+1% Increase
Durable Goods Manufacturing--1.3% Decrease
Non-Durable Goods Manufacturing-+0.2% Increase
Wholesale Trade--0.7% Decrease

The GDP m/m forecast is showing a slight increase at 0.1%, compared to the previous reading of 0.0%.

The upcoming GDP m/m report is set to be published on January 31st at 1:30 PM GMT.

The last time, Canadian GDP m/m was announced on the 22nd of December, 2023. You may find the market reaction chart (CADJPY M5) below:

22-12-2023-GDP-mm-CAD.jpg

USD - Employment Cost Index q/q​

The Employment Cost Index quarter-to-quarter is a leading indicator of consumer inflation because when businesses experience increased labor expenses, they typically transfer those higher costs to consumers.

In the third quarter of 2023, compensation costs for U.S. civilian workers rose by 1.1%, slightly above expectations. This increase was driven by a 1.2% growth in wages and salaries, while benefit costs increased by 0.9%. Private industry workers saw a 1.0% rise in compensation costs, and state and local government workers experienced a more substantial 1.5% increase. On a year-on-year basis, employment costs grew by 4.3%, a slight decrease from the 4.5% rise in the previous quarter.

The projected Employment Cost Index quarter-to-quarter stands at 1.0%, which is marginally below the previous reading of 1.1%.

The forthcoming Employment Cost Index q/q is scheduled for publication on January 31st at 1:30 PM GMT.

The last time, the US Employment Cost Index q/q was announced on the 31st of October, 2023. You may find the market reaction chart (AUDUSD M5) below:

31-10-2023-Employment-Cost-Index-qq-USD.jpg

USD - Federal Funds Rate​

Traders maintain a vigilant eye on the Federal Funds rate because short-term interest rates hold a pivotal role in determining currency value. In the world of currency trading, these rates take center stage, with most other indicators serving primarily as tools to anticipate how these rates might evolve in the coming periods. This emphasis on short-term interest rates underscores their significance in shaping the currency market's dynamics and outcomes.

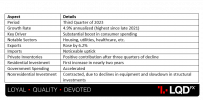
In December 2023, the Federal Reserve maintained its federal funds rate at a range of 5.25% to 5.5% for the third consecutive meeting, aligning with expectations. However, it signaled potential reductions of 75 basis points in 2024. The Fed noted that economic growth appears to be decelerating and job growth, while still robust, has slowed down. The unemployment rate continues to be low. Although inflation has decreased over the past year, it remains high.

The Fed also released updated forecasts. The projection for GDP growth in 2023 has been raised to 2.6%, up from the 2.1% forecast in September, but the outlook for 2024 has been slightly reduced to 1.4% from 1.5%. Inflation expectations, as measured by the Personal Consumption Expenditures (PCE) index, have been revised downwards for both 2023 (from 3.3% to 2.8%) and 2024 (from 2.5% to 2.4%). Similarly, the core PCE inflation forecast has been lowered to 3.2% for 2023 (previously 3.7%) and 2.4% for 2024 (previously 2.6%). Unemployment rate projections are unchanged at 3.8% for 2023 and 4.1% for 2024. Additionally, the updated dot plot indicates that the median projection for the federal funds rate at the end of 2024 has decreased to 4.6%, down from 5.1% in the September estimate.

TL;DR
IndicatorDecember 2023Previous ForecastChanges Noted
Federal Funds Rate5.25% to 5.5%5.25% to 5.5%Maintained; potential 75 basis points reduction in 2024
GDP Growth 20232.6%2.1% (September)Increased forecast
GDP Growth 20241.4%1.5% (September)Slightly reduced forecast
PCE Inflation 20232.8%3.3% (September)Decreased forecast
PCE Inflation 20242.4%2.5% (September)Decreased forecast
Core PCE Inflation 20233.2%3.7% (September)Decreased forecast
Core PCE Inflation 20242.4%2.6% (September)Decreased forecast
Unemployment Rate 20233.8%3.8%Unchanged
Unemployment Rate 20244.1%4.1%Unchanged
End of 2024 Federal Funds Rate Projection4.6%5.1% (September)Decreased projection

The anticipated Federal Funds Rate is projected to stay steady at 5.50%, consistent with its previous rate.

The Federal Funds Rate for the upcoming month is set to be announced on January 31st at 7:00 PM GMT.

The last time, the US Federal Funds Rate was announced on the 13th of December, 2023. You may find the market reaction chart (XAUUSD M5) below:

13-12-2023-Federal-Funds-Rate-USD.jpg

USD – FOMC Press Conference​

This is a key tool for the Federal Reserve to engage with investors about its monetary policy. It thoroughly explains the reasons behind the latest decisions on interest rates and other policies, and includes insights on economic situations like the outlook for future growth and inflation. Crucially, it offers hints about upcoming monetary policy moves.

The Federal Open Market Committee (FOMC) press conference is scheduled for January 31st at 7:30 PM GMT.


Disclaimer: The market news provided herein is for informational purposes only and should not be considered trading advice.
 

Daniel LQDFX

Trader
Jul 21, 2023
126
0
22
43

Daily News Update


1 February 2024​

Thursday​

On February 1st, significant market-moving announcements are expected from both Great Britain and the United States, capturing the attention of the global trading community. Great Britain is set to disclose its Official Bank Rate, while the United States will release its Unemployment Claims and ISM Manufacturing PMI data.​


GBP - Official Bank Rate​

Short-term interest rates are the primary determinant in currency valuation, with traders considering most other economic indicators largely as tools to forecast future changes in these rates.

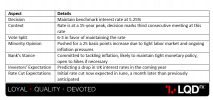
During its December session, the Bank of England's committee decided in a 6-3 vote to maintain the benchmark interest rate at 5.25%, a 15-year peak, marking the third consecutive meeting at this rate. This decision reflects the Bank's ongoing commitment to tackling inflation, despite growing concerns over an economic downturn. The minority of members, however, pushed for a 25 basis points increase, pointing to the tight labor market and ongoing inflation pressures. The Bank has underscored the likelihood of maintaining a tight monetary policy for an extended period to control inflation, and it hasn't ruled out further hikes if inflation remains high. Despite this stance, investors are predicting a drop in UK interest rates in the coming year. Post-decision, there has been a shift in expectations for rate cuts, with the initial reduction now projected for June, a month later than previously anticipated.

TL;DR
GBP - Official Bank Rate.png
The forecast indicates that the Official Bank Rate is expected to stay steady at 5.25%, maintaining the same level as the previous rate.

The Official Bank Rate for the upcoming month will be announced on February 1st at 12:00 PM GMT.

The last time, the British Official Bank Rate was announced on the 14th of December, 2023. You may find the market reaction chart (GBPUSD M5) below:

14-12-2023-Official-Bank-Rate-GBP.jpg

USD – Unemployment Claims​

The unemployment rate, while often regarded as a lagging indicator, is crucial for assessing the economic well-being due to its substantial link with consumer spending, which depends greatly on the state of the job market. Furthermore, this rate is a key factor in shaping the country's monetary policy.

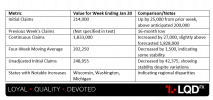
Applications for unemployment benefits in the US had seen an increase of 25,000, reaching 214,000 for the week ending on January 20th, marking a notable jump from the prior week's 16-month low and surpassing the anticipated 200,000. Concurrently, continuous claims for unemployment had risen by 27,000 to 1,833,000, slightly exceeding the forecasted 1,828,000, suggesting a lengthier job-finding process for some individuals. This uptick had contrasted with the robust labor market performance observed in December and early January, raising questions about the labor market's resilience in the face of the Federal Reserve's tightening policies. However, the four-week moving average, a less volatile indicator, had fallen slightly by 1,500 to 202,250, while the unadjusted initial claims had decreased by 42,375 to 248,955, indicating some stability despite seasonal variations. Notably, only Wisconsin, Washington, and Michigan had reported increases in unemployment filings, highlighting regional disparities.

TL;DR
USD – Unemployment Claims.png
The projected figures for unemployment claims suggest a rise to 218,000 from the previous count of 214,000.

The forthcoming release of Unemployment Claims data is scheduled for February 1st at 1:30 PM GMT.

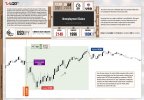
The last time, the US Unemployment Claims data was announced on the 25th of January, 2024. You may find the market reaction chart (USDJPY M5) below:

25-01-2024-Unemployment-Claims-USD.jpg

USD - ISM Manufacturing PMI​

As a foremost indicator of the economy's health, businesses are prompt in their reaction to market trends, with purchasing managers often providing the most immediate and pertinent perspective on the company's economic stance. This is assessed through a survey of approximately 300 purchasing managers, who are asked to evaluate various aspects of business conditions, such as employment, production, new orders, prices, supplier deliveries, and inventory levels.

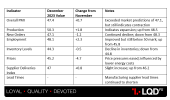
The US ISM Manufacturing PMI had seen a modest improvement, reaching 47.4 in December 2023, up from November's 46.7 and surpassing market predictions of 47.1. Despite this increase, the index had indicated a continued contraction in manufacturing for the 14th consecutive month, marking the longest downturn since 2000-2001. Production had shown signs of recovery, moving up to 50.3 from 48.5. However, declines were observed in new orders (47.1 from 48.3), employment (48.1 from 45.8), and inventory levels (44.3 from 44.8). Price pressures also eased to 45.2 from 49.9, influenced by lower energy costs despite higher prices for steel and aluminum. Additionally, the Supplier Deliveries Index had risen slightly to 47 from 46.2, and manufacturing supplier lead times had continued to shorten, which could have boded well for future economic activity.

TL;DR
USD - ISM Manufacturing PMI.png
The upcoming ISM Manufacturing PMI is expected to register at 47.6, showing a slight dip from the previous mark of 47.4.

The upcoming release of the ISM Manufacturing PMI is scheduled for February 1st at 3:00 PM GMT.

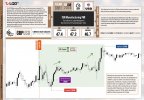
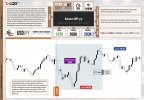
The last time, the US ISM Manufacturing PMI data was announced on the 3rd of January, 2024. You may find the market reaction chart (GBPUSD M5) below:

03-01-2024-ISM-Manufacturing-PMI-USD.jpg


Disclaimer: The market news provided herein is for informational purposes only and should not be considered trading advice.
 

Daniel LQDFX

Trader
Jul 21, 2023
126
0
22
43

Daily News Update


2 February 2024​

Friday​

On February 2nd, the United States is scheduled to release several key economic indicators, including the monthly Average Hourly Earnings, Non-Farm Employment Change, Unemployment Rate, and the Revised University of Michigan Consumer Sentiment.​


USD - Average Hourly Earnings m/m​

This is a primary indicator of consumer inflation. Generally, when businesses incur higher labor costs, these increased expenses tend to be transferred to the consumer.

In December 2023, the average hourly earnings for all employees in the US private nonfarm sector saw an increase of 15 cents, a 0.4% rise, bringing the rate to $34.27. This increment matched the rate observed in the previous month and exceeded the market expectations of a 0.3% rise. For private-sector production and nonsupervisory employees, the average hourly earnings increased by 10 cents, or 0.3%, reaching $29.42. Looking at the year-over-year data, there has been a 4.1% increase in average hourly earnings, a slight acceleration from the 4% rise noted in the previous month and surpassing the anticipated 3.9% increase.

The projection for the Average Hourly Earnings m/m suggests a modest decline to 0.3%, down from the previous figure of 0.4%.

The upcoming release of the Average Hourly Earnings m/m data is scheduled for February 2nd at 1:30 PM GMT.

The last time, the US Average Hourly Earnings m/m was announced on the [/B]January 5th at 1:30 PM GMT[/B]. You may find the market reaction chart (USDJPY M5) below:

05-01-2024-Average-Hourly-Earnings-mm-USD.jpg

USD - Non-Farm Employment Change​

The creation of jobs serves as a crucial early sign of consumer spending, a major driver of the overall economy.

In December 2023, the US job market outperformed expectations, adding 216,000 jobs. This figure not only exceeded the revised total of 173,000 jobs from the previous month but also surpassed market predictions of 170,000 jobs. There was a notable expansion in several sectors: government employment rose by 52,000 jobs, the leisure and hospitality sector added 40,000, health care increased by 38,000, social assistance by 21,000, and construction by 17,000. However, the transportation and warehousing sector saw a decrease of 23,000 jobs. Industries such as mining, manufacturing, and financial activities remained relatively stable with little change. Throughout 2023, the economy gained 2.7 million jobs, marking the smallest yearly growth since 2019, if we exclude the pandemic year. This equates to an average of 225,000 jobs each month, with significant contributions from the government and health care industries. The growth in leisure and hospitality was less than in 2022 and remains 163,000 jobs short of its pre-pandemic level.

TL;DR
USD - Non-Farm Employment Change.png

Projections for the Non-Farm Employment Change suggest a decline to 175,000, down from the previous figure of 216,000.

The upcoming release of the Non-Farm Employment Change data is scheduled for February 2nd at 1:30 PM GMT.

The last time, the US Non-Farm Employment Change data was announced on the [/B]January 5th at 1:30 PM GMT[/B]. You may find the market reaction chart (USDJPY M5) below:

05-01-2024-Non-Farm-Employment-Change-USD.jpg

USD - Unemployment Rate​

While often seen as a trailing indicator, the unemployment rate is a key measure of the economy's overall health, as consumer spending closely relates to the state of the labor market. Additionally, unemployment levels are a critical factor for policymakers guiding the nation's monetary policy.

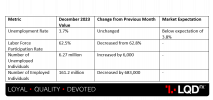
In December 2023, the unemployment rate in the United States remained steady at 3.7%, consistent with the previous month's figure and marginally below the market expectation of 3.8%. This stability was partly due to a decrease in new entrants to the workforce. The labor force participation rate saw a slight decline, falling to 62.5% from 62.8% in November. Moreover, the number of unemployed individuals experienced a minor increase of 6,000, bringing the total to 6.27 million. Concurrently, there was a reduction in the number of employed individuals, which decreased by 683,000 to a total of 161.2 million.

TL;DR
USD - Unemployment Rate.png
Projections for the Unemployment Rate suggest it will remain steady at the same level as before, 3.7%.

The next release of the Unemployment Rate data is scheduled for February 2nd at 1:30 PM GMT.

The last time, the US Unemployment Rate data was announced on the [/B]January 5th at 1:30 PM GMT[/B]. You may find the market reaction chart (USDJPY M5) below:

05-01-2024-Unemployment-Rate-USD.jpg

USD - Revised UoM Consumer Sentiment​

Consumer financial confidence, a key predictor of consumer expenditure which forms the bulk of total economic activity, is gauged through a survey of approximately 500 consumers. This survey asks participants to evaluate the current and future economic conditions.

In January 2024, the University of Michigan's consumer sentiment index in the US reached a peak of 78.8, its highest since July 2021. This marked a significant increase from 69.7 in December and exceeded the anticipated figure of 70, as per preliminary data. This boost in consumer sentiment is attributed to growing confidence that inflation is easing and income expectations are improving. Inflation expectations for the upcoming year decreased to 2.9%, the lowest since December 2020, down from 3.1% in the preceding month. Additionally, the five-year inflation outlook slightly fell to 2.8% from 2.9%. The component measuring future expectations jumped to 75.9 from 67.4, while the index for current economic conditions rose to 83.3 from 73.3. Combining the figures for January and December reveals a 29% cumulative rise in consumer sentiment, the largest two-month increase since the 1991 recession's end. For the second month in a row, all five components of the index saw increases, including a 27% jump in short-term business conditions outlook and a 14% rise in perceptions of current personal finances.

TL;DR
USD - Revised UoM Consumer Sentiment.png
The expectation for the Revised UoM Consumer Sentiment for the forecast stands at 78.8.

The revised University of Michigan Consumer Sentiment data is scheduled for release on February 2nd at 3:00 PM GMT.

The last time, the University of Michigan Consumer Sentiment data was announced on the [/B]December 22nd at 3:00 PM GMT[/B]. You may find the market reaction chart (EURUSD M5) below:

22-12-2023-Revised-UoM-Consumer-Sentiment-USD.jpg


Disclaimer: The market news provided herein is for informational purposes only and should not be considered trading advice.
 

Daniel LQDFX

Trader
Jul 21, 2023
126
0
22
43

Daily News Update


5 February 2024​

Monday​

In a significant development scheduled for Monday, the United States is set to release its latest ISM Services PMI data. This announcement is keenly awaited by economists and market analysts, as it provides crucial insights into the health of the service sector, which is a major component of the US economy.​


USD - ISM Services PMI​

The ISM Services PMI is a pivotal gauge of economic vitality, as businesses swiftly adjust to market dynamics, and purchasing managers are often privy to the most immediate and pertinent perspectives on the economic landscape. This survey encompasses approximately 300 purchasing managers, soliciting their assessment on various aspects of business operations such as employment, production, new orders, pricing, supplier deliveries, and stock levels.

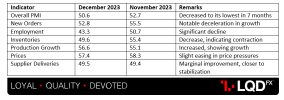
In an unexpected development, the ISM Services PMI in the United States decreased to 50.6 in December 2023, reaching its lowest level in seven months. This represented a decline from the November reading of 52.7 and fell short of the anticipated 52.6. The downturn was marked by a notable deceleration in new orders, which dropped to 52.8 from 55.5, alongside declines in employment (to 43.3 from 50.7) and inventories (to 49.6 from 55.4). Conversely, there was an uptick in production growth, which increased to 56.6 from 55.1, and a slight easing of price pressures, with the index moving to 57.4 from 58.3. The performance of supplier deliveries also saw a marginal improvement, edging up to 49.5 from 49.4. Anthony Nieves, Chair of the Institute for Supply Management Services Business Survey Committee, observed that the responses varied significantly across different companies and sectors, with the predominant concerns being economic uncertainty, geopolitical events, and labor market challenges.

TL;DR

USD - ISM Services PMI.png

The ISM Services PMI forecast stands at 51.7, a slight improvement from the previous 50.6 reading.

The ISM Services PMI is scheduled for release at 3:00 PM GMT on Monday, February 5th`.

The last time, the US ISM Services PMI was announced on the 5th of January, 2024. You may find the market reaction chart (GBPUSD M5) below:

05-01-2024-ISM-Services-PMI-USD.jpg


Disclaimer: The market news provided herein is for informational purposes only and should not be considered trading advice.
 

Daniel LQDFX

Trader
Jul 21, 2023
126
0
22
43

Daily News Update


6 February 2024​

Tuesday​

On February 6th, key financial updates are set to be announced by Australia and New Zealand, drawing significant attention from investors and market analysts globally. Australia is scheduled to reveal its Cash Rate decision, a critical indicator of the country's monetary policy stance and economic health. Simultaneously, New Zealand will disclose its Employment Change for the quarter and the current Unemployment Rate, providing valuable insights into the nation's labor market conditions and overall economic vitality. These announcements are eagerly anticipated, as they have the potential to influence financial markets and economic strategies in both countries and beyond.​


AUD - Cash Rate​

Traders primarily focus on short-term interest rates as the key determinant of currency value, considering other economic indicators largely in terms of their potential impact on future rate adjustments.

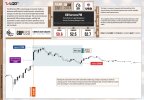
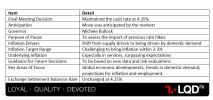
At its final meeting of the year, the Reserve Bank of Australia had maintained the cash rate at 4.35%, a move that had been anticipated by the markets. This pause had provided Governor Michele Bullock and her colleagues the opportunity to assess the impact of previous rate hikes. Bullock had recently highlighted that inflation was being driven by domestic demand, marking a shift from earlier supply-driven inflationary pressures. The central bank had noted the challenging pace of bringing inflation within the 2-3% target range, with underlying inflation, especially in services, surpassing expectations. Future rate decisions were to be guided by new data and risk evaluations, as stated by the bank's officials. They also stressed the importance of keeping an eye on global economic developments, trends in domestic demand, and projections for inflation and employment. The rate for Exchange Settlement balances was kept unchanged at 4.25%.

TL;DR
AUD - Cash Rate.png
The forecast for the Reserve Bank of Australia's interest rate decision remains steady at 4.35%, in line with the previous result.

The next Cash Rate announcement is set to be published on February 6th at 3:30 AM GMT.

The last time, the Australian Cash Rate was announced on the 5th of December, 2023. You may find the market reaction chart (AUDUSD M5) below:

05-12-2023-Cash-Rate-AUD.jpg

NZD - Employment Change q/q​

Despite the delayed publication, this data emerges as a key early signal of employment trends and frequently exerts a profound impact on market dynamics. The generation of jobs is a vital precursor to consumer expenditure, which constitutes a substantial portion of overall economic performance.

In a surprising shift, New Zealand's employment figures for September 2023 showed a decrease of 0.20%, deviating from the 1% growth observed in the preceding quarter. Historically, New Zealand's average employment change has hovered around 0.39%. The peak of this trend was seen in the second quarter of 2016 with a remarkable 2.60% increase, while the most significant dip occurred in the first quarter of 2009, with employment decreasing by 1.80%.

TL;DR
NZD - Employment Change q.q.png
The forecast suggests a minor decline to -0.3% from the previous -0.2% result.

The upcoming Employment Change q/q report is scheduled to be published on February 6th at 9:45 PM GMT.

The last time, the New Zealand Employment Change q/q data was announced on the 31st of October, 2023. You may find the market reaction chart (NZDJPY M5) below:

31-10-2023-Employment-Change-qq-NZD.jpg


NZD - Unemployment Rate​

Despite typically being seen as a delayed measure, the unemployment rate is a critical indicator of the economy's overall condition, as consumer spending closely aligns with the state of the job market.

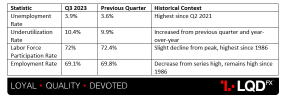
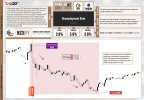
In the September quarter of 2023, New Zealand experienced a rise in its unemployment rate to 3.9%, marking the highest level since the June quarter of 2021, from the previous quarter's 3.6%, aligning with market forecasts. Concurrently, the underutilization rate escalated to 10.4%, an increase from 9.9% in the preceding quarter and 8.9% year-over-year. The labor force participation rate slightly declined to 72%, down from a peak of 72.4% in the prior quarter, the highest since 1986, while the employment rate decreased to 69.1% from a series high of 69.8% in the previous quarter, yet remains significantly high since records began in 1986.

TL;DR
NZD - Unemployment Rate.png
The Unemployment Rate forecast suggests a slight increase to 4% from the previous outcome of 3.9%.

The upcoming release of the Unemployment Rate data is scheduled for February 6th at 9:45 PM GMT.

The last time, the New Zealand Unemployment Rate data was announced on the 31st of October, 2023. You may find the market reaction chart (NZDJPY M5) below:

31-10-2023-Unemployment-Rate-NZD.jpg


Disclaimer: The market news provided herein is for informational purposes only and should not be considered trading advice.
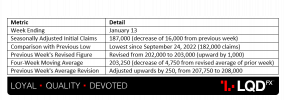
 

Daniel LQDFX

Trader
Jul 21, 2023
126
0
22
43

Daily News Update


8 February 2024​

Thursday​

On February 8th, significant economic updates are expected as China announces its year-over-year Consumer Price Index (CPI) data, and the United States releases its latest figures on Unemployment Claims, providing key insights into the economic health of two of the world's leading economies.​


CNY – CPI y/y​

The bulk of overall inflation is driven by consumer prices. This aspect of inflation is crucial for the valuation of currency, as escalating prices prompt central banks to counteract by increasing interest rates.

In December 2023, China's consumer prices experienced a decline of 0.3% year-over-year, marking the third consecutive month of reduction, which represented the longest streak of decline since October 2009. The figures were slightly better than market forecasts, which anticipated a 0.4% decrease, and showed a moderation from November's steepest drop in three years of 0.5%. Food prices saw a less pronounced decrease since September, declining by 3.7% compared to 4.2% in November, as the fall in pork prices softened. Meanwhile, non-food inflation saw a slight increase to 0.5% from 0.4%, driven by rising costs in clothing (1.4% from 1.3%), housing (steady at 0.3%), health (1.4% from 1.3%), and education (steady at 1.8%), while the decrease in transport prices became less severe (-2.2% from -2.4%). Core consumer prices, which exclude food and energy prices, saw a year-over-year increase of 0.6% in December, maintaining the rate observed in the previous two months. Over the full year, consumer prices witnessed a modest rise of 0.2%. On a monthly basis, the CPI inched up by 0.1%, indicating the first increase in three months, yet it was below the consensus expectation of a 0.2% increase.

TL;DR

CNY – CPI y.y.png

The CPI y/y forecast is anticipated to improve to -0.1% from its previous value of -0.3%.

The upcoming CPI y/y data is scheduled for release on February 8th at 1:30 AM GMT.


USD - Unemployment Claims​

While typically seen as a trailing measure, the unemployment rate is a crucial indicator of the economy's well-being, given its strong link to consumer spending, which is closely tied to the state of the job market. Additionally, it plays a significant role in guiding the monetary policy decisions made by the country's policymakers.

The U.S. has witnessed a notable increase in unemployment claims for the second week in a row, with the latest figures reaching 224,000 in the week ending January 27th, the highest since mid-November, and exceeding the anticipated 212,000. This rise reflects a growing trend of job market instability, underscored by a rise in the 4-week moving average of claims to 207,750. Regionally, the most significant spikes in claims were observed in California, New York, and Oregon, whereas Illinois and Missouri saw notable decreases. Moreover, the number of continuing claims, indicating those still receiving unemployment benefits, escalated to 1,898,000, the highest in nine weeks, suggesting an increase in the duration of unemployment for many Americans. This series of increases in unemployment claims highlights concerns regarding the labor market's health and may influence future economic policies.

TL;DR

USD - Unemployment Claims.png

The forecast for Unemployment Claims suggests a minor uptick in numbers, rising to 227,000 from the previous figure of 224,000.

The upcoming release of the Unemployment Claims data is scheduled for February 8th at 1:30 PM GMT.


Disclaimer: The market news provided herein is for informational purposes only and should not be considered trading advice.
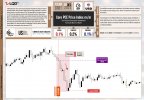
 

Daniel LQDFX

Trader
Jul 21, 2023
126
0
22
43

Daily News Update


9 February 2024​

Friday​

On February 9th, Canada is set to release key employment data, including updates on Employment Change and the Unemployment Rate. This announcement is eagerly anticipated as it provides crucial insights into the country's labor market and overall economic health.​


CAD – Employment Change

The creation of jobs serves as a pivotal forward-looking measure for consumer expenditure, which constitutes the bulk of total economic activity.

In December 2023, Canada experienced a slight uptick in job numbers, with an addition of merely 100 positions, marking a notable deceleration from the 24,900 jobs created in November and falling below the expected 13,500 increase. The employment landscape saw significant contractions in sectors such as wholesale & retail trade, which lost 21,000 positions, and manufacturing, where 18,000 jobs were cut. Conversely, positive momentum was observed in fields like professional, scientific & technical services, which welcomed 46,000 new roles, health care & social assistance, adding 16,000 positions, and other services, which expanded by 12,000 jobs. The pace of job creation in December remained flat at 0.0%, consistent with the minimal shifts observed in November (0.1%) and October (0.1%). In comparison, the average job growth per month in the second half of 2023 was 23,000, a decline from the 48,000 monthly average seen in the first six months, against an average monthly population increase of 79,000.

TL;DR
CAD – Employment Change.png
The Employment Change forecast stands at -0.5K, which is a decrease compared to the previous result of 0.1K.

The upcoming Employment Change data is set to be announced on February 9th at 1:30 PM GMT.

The last time, Canadian Employment Change data was announced on the 5th of January, 2024. You may find the market reaction chart (CADJPY M5) below:

05-01-2024-Employment-Change-CAD.jpg
CAD - Unemployment Rate

Although typically considered a delayed reflection of economic conditions, the total number of unemployed individuals is a crucial indicator of the economy's overall well-being due to the strong relationship between the state of the job market and consumer spending.

In December 2023, Canada's unemployment rate remained steady at 5.8%, consistent with the 22-month peak observed in November and slightly better than the anticipated 5.9%. This outcome, while surpassing market forecasts, continued to highlight the weakening trend in the Canadian labor market, in line with other indicators of decelerating economic growth. This trend has been putting pressure on the Bank of Canada to accelerate its easing of monetary policy. The count of unemployed people increased marginally by 4,800 to reach 1,245,200 during this period. This was due to a rise in unemployment among the older population (+18,300) which outweighed minor decreases in unemployment among the prime working-age group (-4,400) and the youth (-9,200). Meanwhile, the economy saw a net addition of 100 jobs, leaving the total employment figure essentially stable at 20,312,600. As a result, the labor force participation rate slightly decreased by 0.2 percentage points to 65.4%, mirroring trends seen in the US and preventing a rise in the unemployment rate.

TL;DR
CAD - Unemployment Rate.png
Projections for the unemployment rate suggest a rise to 5.9%, which is an increase from the previous figure of 5.8%.

The forthcoming announcement of unemployment rate data is scheduled for February 9th at 1:30 PM GMT.

The last time, Canadian Unemployment Rate data was announced on the 5th of January, 2024. You may find the market reaction chart (CADJPY M5) below:

05-01-2024-Unemployment-Rate-CAD.jpg


Disclaimer: The market news provided herein is for informational purposes only and should not be considered trading advice.

 
Last edited:

Daniel LQDFX

Trader
Jul 21, 2023
126
0
22
43

Daily News Update


12 February 2024​

Monday​

On February 12th, a speech by Bank of England Governor Bailey is anticipated, which could influence the currency's value.​


GBP - Governor of the BOE, Andrew Bailey, delivers a speech​

Scheduled to speak at Loughborough University, Governor Bailey's remarks are highly anticipated. A more hawkish stance than expected is generally positive for the currency. As the leader of the central bank, with the authority over short-term interest rates, his influence on the nation's currency value surpasses that of any other individual. Market participants pay close attention to his public statements, as they frequently contain hints about future monetary policy.

On Thursday, 1st February, Bank of England's Governor Andrew Bailey hinted that the central bank may share the financial market's predictions about impending rate decreases. Speaking with CNBC, Bailey chose not to specify when the rate cuts might occur but acknowledged that the market's expectations did not conflict with his views. After the central bank decided to maintain the interest rate at 5.25%, the investment community predicted a drop to 4.25% by the end of the year through four rate cuts. The Monetary Policy Committee was divided (6-3) over this, showing varied opinions on inflation trends. Although inflation ticked up slightly to 4% annually in December, it's generally moving closer to the bank's target of 2%. Bailey pointed out that the bank is considering rate reductions, shifting the focus from how high rates need to be to how long current rates should be maintained to ensure inflation stabilizes. He also noted the alignment between the bank's stance and market predictions regarding the timing for easing rates, expressing optimism about establishing a definitive route towards rate cuts.

TL;DR
GBP - Governor of the BOE, Andrew Bailey, delivers a speech.png
Andrew Bailey, the Governor of the Bank of England (BOE), is scheduled to deliver a speech on Monday the 12th of February, at 6:00 PM GMT.


Disclaimer: The market news provided herein is for informational purposes only and should not be considered trading advice.
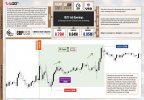
 

Daniel LQDFX

Trader
Jul 21, 2023
126
0
22
43
13th February 2024

Tuesday


A significant news announcement is on the horizon, with New Zealand, Great Britain, Switzerland, and the United States all preparing to release important economic data. New Zealand is poised to unveil its quarterly Inflation Expectations, while Great Britain will disclose its Claimant Count Change figures. Switzerland will release its monthly Consumer Price Index (CPI), and the United States will announce both its Core CPI and CPI readings. These updates are eagerly anticipated by economists and investors worldwide as they provide crucial insights into the economic conditions of these nations.


NZD - Inflation Expectations q/q

Business managers regularly assess their expectations for annual price changes in goods and services over the next two years, with these assessments released quarterly approximately 50 days before each quarter concludes. These inflation expectations can influence actual inflation rates as they may lead to wage demands from workers when they anticipate rising prices. This data is derived from a survey conducted with approximately 100 consumers, querying them about their price expectations for goods and services 24 months into the future.

In New Zealand, inflation expectations for the fourth quarter of 2023 dropped to 2.76 %, down from 2.83 % in the third quarter of the same year. Over the period from 1987 to 2023, New Zealand's average inflation expectations stood at 2.54 %, with a peak of 8.30 % in the third quarter of 1987 and a notable low of 1.24 % in the second quarter of 2020.

Predictions suggest a minor drop in the forecast to 2.6%, down from the previous result of 2.76%.

The upcoming release of the New Zealand Inflation Expectations q/q is set for Tuesday the 13th of February at 2:00 AM GMT.

The last time, New Zealand Inflation Expectations q/q was announced on the 8th of November, 2023. You may find the market reaction chart (NZDUSD M5) below:

08-11-2023-Inflation-Expectations-qq-NZD.jpg


GBP - Claimant Count Change

The Claimant Count, updated on a monthly basis approximately 16 days after the conclusion of each month, is traditionally viewed as a lagging indicator. Nonetheless, it carries substantial significance as it portrays the count of individuals currently without employment. This metric plays a vital role in signaling the overall economic health, given the robust connection between consumer spending and labor market dynamics. Furthermore, unemployment continues to be a critical factor in influencing the decision-making of authorities responsible for shaping the nation's monetary policies.

The United Kingdom's (UK) ILO Unemployment Rate remained steady at 4.2% in the three months leading up to November, as reported by the Office for National Statistics (ONS) last Tuesday. This figure aligned with market expectations for the November quarter. The report further detailed that the number of people claiming jobless benefits rose by 11.7K in December, marking a significant increase from the 0.6K rise in November. In terms of employment changes, November saw an addition of 73K jobs, surpassing the 50K job gain recorded in October. Additionally, the Average Earnings excluding Bonus in the UK experienced a 6.6% year-over-year increase in November, a slight decrease from the 7.2% rise in October and in line with market forecasts. Meanwhile, Average Earnings including Bonus also witnessed a growth, albeit at a slower pace of 6.5%, compared to the 7.2% increase in October and below the anticipated 6.8% rise. These figures are considered crucial indicators of the UK's economic health and labor market trends.

16-01-2024-Claimant-Count-Change-GBP.jpg

TL;DR

IndicatorCurrent FigurePrevious FigureMarket Expectation
ILO Unemployment Rate (3 months to Nov)4.2%4.2%4.2%
Jobless Claims Change (Dec)+11.7K+0.6K-
Employment Change (Nov)+73K+50K-
Average Earnings Excluding Bonus (YoY Nov)6.6%7.2%6.6%
Average Earnings Including Bonus (YoY Nov)6.5%7.2%6.8%


The predicted figure for Claimant Count Change suggests a decrease to 6,000 from the former result of 11,700.

On Tuesday, the 13th of February at 7:00 AM GMT, Great Britain will unveil its Claimant Count Change data.

View attachment 734592

CHF - CPI m/m

The measure described reflects the change in the price of goods and services purchased by consumers, and is released monthly, approximately three days after the end of each month. It represents the earliest major inflation data released by any country, providing insights just days after the month concludes. Consumer prices, which account for a majority of overall inflation, are crucial for currency valuation because rising prices may prompt the central bank to increase interest rates to fulfill its mandate of containing inflation. This is achieved by sampling the average price of various goods and services and comparing it to the previous sampling.

In December 2023, the Consumer Price Index (CPI) in Switzerland remained static, showing no deviation from the figures of the preceding month. This stability in the month-on-month inflation rate is consistent with the country's historical pattern, where the average monthly inflation rate has been approximately 0.18 % from 1950 to 2023. The CPI experienced its highest surge in November 1973, reaching an unprecedented peak of 2.10 %, and witnessed its most significant decline in July 2004, when it plummeted to a record low of -1.00 %.

The CPI m/m forecast suggests a rise to 0.3%, up from the previous reading of 0%.

The next release of the CPI m/m is set for Tuesday the 13th of February, at 7:30 AM GMT.

The last time, the Swiss CPI m/m was announced on the 8th of January, 2024. You may find the market reaction chart (CHFJPY M5) below:


08-01-2024-CPI-mm-CHF.jpg


USD - Core CPI m/m

Consumer Price Index (CPI), excluding food and energy components, measures changes in the cost of goods and services purchased by consumers. This economic indicator is released on a monthly basis, approximately 16 days after the month concludes. While food and energy prices contribute significantly to CPI, their volatility can distort the underlying trend. The Federal Open Market Committee and traders typically prioritize the Core CPI data, which excludes these volatile components. Consumer prices hold a substantial weight in overall inflation, making inflation a crucial factor influencing currency valuation. As inflation rises, central banks often respond by increasing interest rates to fulfill their mandate of containing inflation. This measure is also known as CPI Ex Food and Energy or Underlying CPI.

In December 2023, the core US consumer price index, which omits fluctuating items like food and energy, increased by 0.3% from the prior month, mirroring the rise in November and aligning with expectations. The rate of price growth for services, excluding those related to energy, moderated to 0.4% from 0.5% the previous month, with a notable slowdown in transportation service costs to 0.1% from 1.1%. Conversely, expenses for housing rose more rapidly at 0.5% compared to 0.4% previously, and medical care services saw a higher increase at 0.7% up from 0.6%. In the goods sector, there was a recovery in the prices of clothing (0.1% after a 1.3% decrease), new vehicles (0.3% after a 0.1% decrease), and alcoholic drinks (0.3% after a 0.1% decrease). On the other hand, the cost for used cars and trucks saw a decrease to 0.5% from 1.6%, and there was a drop in prices for medical care products (-0.1% from 0.5%) and tobacco-related items (-0.1% from 1.1%).

TL;DR

CategoryDecember 2023 ChangeNovember 2023 Change
Core CPI (Month-on-Month)+0.3%+0.3%
Services Excluding Energy+0.4%+0.5%
- Transportation Services+0.1%+1.1%
- Housing+0.5%+0.4%
- Medical Care Services+0.7%+0.6%
Goods--
- Clothing+0.1% (recovery)-1.3%
- New Vehicles+0.3% (recovery)-0.1%
- Alcoholic Drinks+0.3% (recovery)-0.1%
- Used Cars and Trucks-0.5%-1.6%
- Medical Care Products-0.1%+0.5%
- Tobacco-0.1%+1.1%


The Core CPI m/m forecast stands at 0.3%, mirroring the previous result.

The last time, the US Core CPI m/m was announced on the 11th of January, 2024. You may find the market reaction chart (GBPUSD M5) below:

11-01-2024-Core-CPI-mm-USD.jpg

USD - CPI m/m

Consumer Price Index (CPI) measures the fluctuation in the cost of goods and services acquired by consumers. It is published on a monthly basis, approximately 16 days after the conclusion of the respective month. Consumer prices play a pivotal role in determining overall inflation rates. Inflation is of significant importance in the context of currency valuation, as escalating prices prompt central banks to consider increasing interest rates in order to fulfill their mandate of controlling inflation. The CPI is computed by sampling the average prices of diverse goods and services and comparing them with previous samples.

In December 2023, US consumer prices witnessed a 0.3% increase over the previous month, marking the highest rise in three months, which exceeded the anticipated 0.2% and followed a 0.1% increase in November. A significant portion of this monthly rise in overall prices was driven by the shelter index, which went up by 0.5%, compared to 0.4% in the preceding month. Additionally, there was a 1.5% increase in the motor vehicle insurance index, up from the 1% rise seen in November. The index for used cars and trucks also saw an increase, albeit a smaller one of 0.5%, following a more substantial 1.6% increase in November. Other areas that saw price increases included recreation, new vehicles, education, and airline fares. The energy sector experienced a 0.4% increase, with the electricity index rising by 1.3% and the gasoline index by 0.2%, which more than compensated for a 0.4% decrease in the natural gas index. The food index saw a consistent 0.2% rise, mirroring the increase in November. In contrast, there were declines in certain indexes, such as household furnishings & operations, which fell by 0.4%, and personal care, which decreased by 0.3%.

TL;DR

CategoryDecember 2023 Change
Overall Consumer Prices+0.3%
Shelter Index+0.5%
Motor Vehicle Insurance+1.5%
Used Cars and Trucks+0.5%
RecreationIncrease
New VehiclesIncrease
EducationIncrease
Airline FaresIncrease
Energy Sector+0.4%
- Electricity+1.3%
- Gasoline+0.2%
- Natural Gas-0.4%
Food Index+0.2%
Household Furnishings & Operations-0.4%
Personal Care-0.3%


The upcoming CPI m/m report suggests a modest decline in the month-on-month inflation rate, with expectations pointing to a decrease from the previous figure of 0.3% to 0.2%.

The last time, the US CPI m/m was announced on the 11th of January, 2024. You may find the market reaction chart (GBPUSD M5) below:

11-01-2024-CPI-mm-USD.jpg


USD - CPI y/y

The Consumer Price Index (CPI) measures fluctuations in the cost of goods and services acquired by consumers. It is published monthly, typically around 16 days after the conclusion of the respective month. Notably, this data is reported without seasonal adjustments. Consumer prices are a significant component of overall inflation, making CPI a key indicator. Inflation holds significance in the context of currency valuation as it often prompts central banks to consider raising interest rates in pursuit of their mandate to contain inflation. The CPI is calculated by sampling and comparing the average prices of a variety of goods and services over time.

In December 2023, the annual inflation rate in the US rose to 3.4% from a five-month low of 3.1% in November, surpassing market expectations of 3.2%. This increase was attributed to a slower decline in energy prices. Energy costs fell by 2%, compared to a 5.4% drop in November, with gasoline prices decreasing by 1.9% (versus an 8.9% decline), utility (piped) gas service dropping by 13.8% (compared to a 10.4% decrease), and fuel oil prices plummeting by 14.7% (against a 24.8% fall). Meanwhile, the rate of price increases moderated for food (2.7% versus 2.9%), shelter (6.2% versus 6.5%), new vehicles (1% versus 1.3%), apparel (1% versus 1.1%), medical care commodities (4.7% versus 5%), and transportation services (9.7% versus 10.1%), while prices for used cars and trucks continued their downward trend, dropping by 1.3% compared to a 3.8% fall in the previous month. The annual core inflation rate, which excludes volatile items such as food and energy, softened to 3.9%, remaining below the 4% recorded in the preceding period but still above the anticipated 3.8%. On a monthly basis, consumer prices in December increased by 0.3%, marking the largest rise in three months and exceeding the predicted 0.2%.

TL;DR

CategoryAnnual Change (Dec 2023)Annual Change (Nov 2023)
Annual Inflation Rate3.4%3.1%
Energy Costs-2%-5.4%
- Gasoline-1.9%-8.9%
- Utility Gas Service-13.8%-10.4%
- Fuel Oil-14.7%-24.8%
Food2.7%2.9%
Shelter6.2%6.5%
New Vehicles1%1.3%
Apparel1%1.1%
Medical Care Commodities4.7%5%
Transportation Services9.7%10.1%
Used Cars and Trucks-1.3%-3.8%
Core Inflation Rate (excl. Food & Energy)3.9%4%
Monthly Consumer Prices Increase+0.3%-


The forecast for the US CPI y/y is reading a decreased 2.9%.

The forthcoming release of all CPI data is scheduled for Tuesday the 13th of February, at 1:30 PM GMT.

The last time, the US CPI y/y was announced on the 11th of January, 2024. You may find the market reaction chart (GBPUSD M5) below:

11-01-2024-CPI-yy-USD.jpg
 

Daniel LQDFX

Trader
Jul 21, 2023
126
0
22
43
14th February 2024

Wednesday


The United Kingdom is poised to unveil its year-over-year Consumer Price Index (CPI) figures on February 14th, providing key insights into the nation's inflation trends.


GBP - CPI y/y

This statement refers to the regular monthly evaluation of changes in the prices of consumer goods and services, typically released around 16 days after each month ends. This information is crucial in the UK, where it acts as the main gauge for the central bank to track and manage inflation. Prices paid by consumers make up a significant part of the overall inflation picture. Inflation's impact on the value of money is significant, as rising prices can lead the central bank to increase interest rates to fulfill its role in keeping inflation in check. The process involves comparing the current average prices of a broad selection of goods and services with those from a year ago.

In December 2023, the UK's annual inflation rate unexpectedly climbed to 4%, up from a near two-year low of 3.9% in November and surpassing the anticipated 3.8%. This marks the first rise in the inflation rate in ten months. The most significant increase was in the prices of alcohol and tobacco, which jumped to 12.9% from 10.2%, largely due to higher tobacco duty. There was also a noticeable rise in the recreation and culture sector, including items like DVDs, computer software, games consoles, sports equipment, toys, and package holidays, climbing to 5.7% from 5.3%. Other areas experiencing inflation growth included clothing and footwear (up to 6.4% from 5.7%), furniture and household equipment (rising to 2.5% from 2.3%), and communication (increasing to 8.5% from 8.1%). Conversely, inflation rates decreased for food and non-alcoholic beverages (falling to 8% from 9.2%), driven by lower prices of milk, cheese, and eggs; health (dropping to 7.3% from 7.4%); restaurants and hotels (down to 7% from 7.5%); and transport (declining to -1.1% from -1.5%). Month-over-month, the Consumer Price Index (CPI) rose by 0.4%, while the core CPI increased by 0.6%, keeping the annual rate steady at 5.1%.

TL;DR

SectorInflation Rate December 2023Inflation Rate November 2023Change
Overall Inflation4.0%3.9%+0.1%
Alcohol & Tobacco12.9%10.2%+2.7%
Recreation & Culture5.7%5.3%+0.4%
Clothing & Footwear6.4%5.7%+0.7%
Furniture & Household Equipment2.5%2.3%+0.2%
Communication8.5%8.1%+0.4%
Food & Non-Alcoholic Beverages8.0%9.2%-1.2%
Health7.3%7.4%-0.1%
Restaurants & Hotels7.0%7.5%-0.5%
Transport-1.1%-1.5%+0.4%


The projected CPI y/y basis is expected to show a modest rise, reaching 4.1% from the earlier figure of 4%.

The upcoming CPI y/y report is scheduled for release on Wednesday at 7:00 AM GMT.

The last time, the British CPI y/y was announced on the 15th of January, 2024. You may find the market reaction chart (GBPJPY M5) below:

17-01-2024-CPI-yy-GBP.jpg


Daniel LQDFX

Trader
Jul 21, 2023
126
0
22
43

Daily News Update


15 February 2024​

Thursday​

On February 15th, a significant slate of economic data releases is scheduled, with Australia set to disclose its Employment Change and Unemployment Rate figures, Great Britain to report its month-over-month GDP, and the United States to announce its Core Retail Sales month-over-month, Empire State Manufacturing Index, Retail Sales month-over-month, and Unemployment Claims.​


AUD - Employment Change​

The Employment Change metric, which reports the variation in the number of individuals employed compared to the previous month, is a critical economic indicator released monthly, approximately 15 days following the conclusion of the month. Given its significance and timely publication, this data exerts a substantial influence on market dynamics. Furthermore, job creation serves as a pivotal leading indicator of consumer spending, the primary driver of overall economic activity.

In a surprising turn of events, Australia's employment figures for December 2023 witnessed a significant downturn, with a loss of 65,100 jobs, bringing the total number to 14.20 million. This development sharply contrasted with market expectations of a 17,600 job increase and reversed the previous month's substantial gain of 72,600 jobs, which was an upward revision. This marked the first decline in employment in the country in three months. The drop was primarily due to a steep decrease in full-time employment, which plummeted by 106,600 to 9.79 million. In contrast, part-time employment saw an increase, adding 41,400 jobs to reach 4.41 million. Despite this setback, the overall employment figures for the year leading up to December reflected a growth of 381,000 jobs, or a 2.8% increase.

TL;DR
MetricFigureChange
Total Employment14.20 million-65,100 jobs
Full-time Employment9.79 million-106,600 jobs
Part-time Employment4.41 million+41,400 jobs
Monthly Job Expectation-Expected increase of 17,600 jobs
Previous Month's Gain-+72,600 jobs
Yearly Job Growth-+381,000 jobs (2.8%)
The forecast for Employment Change suggests an increase of 15,000 compared to the previous outcome, which showed a decrease of 65,100.

The upcoming Australian Employment Change data announcement is scheduled for Thursday the 15th at 12:30 AM GMT.

The last time, Australian Employment Change data was announced on the 18th of January, 2024. You may find the market reaction chart (AUDNZD M5) below:
18-01-2024-Employment-Change-AUD.jpg

AUD - Unemployment Rate​

The statistic in focus represents the proportion of the entire labor force that is unemployed and has been actively looking for work in the previous month. Released monthly, usually around 15 days after the end of the month, this figure, though often seen as a lagging indicator, plays a crucial role in assessing the health of the economy due to its direct correlation with consumer spending. It is also commonly known as the "Unemployment Rate.

In December 2023, Australia's unemployment rate stayed at 3.9%, unchanged from the previous month and meeting expectations. The unemployed population slightly fell by 800 to 573,600, with a decrease in individuals looking for full-time work and an uptick in those seeking part-time positions. Employment saw an unexpected decline, falling by 65,100 to 14.2 million, negating the prior month's increase of 72,600. This drop was primarily due to a significant reduction in full-time jobs, although there was a slight rise in part-time roles. The labor force participation rate decreased to 66.8%, down from November's record peak of 67.3% and below the projected 67.1%. The underemployment rate held steady at 6.5%, significantly below the levels seen before the pandemic, while total monthly working hours decreased by 0.5% to 1.926 billion.

TL;DR
MetricFigureChange
Unemployment Rate3.9%Unchanged
Unemployed Population573,600-800
Total Employment14.2 million-65,100
Full-time Employment-Significant reduction
Part-time Employment-Slight increase
Labor Force Participation Rate66.8%Decreased from 67.3% to below 67.1% projected
Underemployment Rate6.5%Steady, below pre-pandemic levels
Total Monthly Working Hours1.926 billion-0.5%
The forecast for the unemployment rate suggests a modest increase to 4.0% from the previous figure of 3.9%.

The upcoming Australian Unemployment Rate announcement is scheduled for Thursday the 15th at 12:30 AM GMT.

The last time, Australian Unemployment Rate data was announced on the 18th of January, 2024. You may find the market reaction chart (AUDNZD M5) below:
18-01-2024-Unemployment-Rate-AUD.jpg

GBP - GDP m/m​

The change in the total value of all goods and services produced by the economy, which is the broadest measure of economic activity and the primary gauge of the economy's health, is released monthly, approximately 40 days after the end of the month.

In November 2023, the British economy exhibited a notable expansion of 0.3% on a month-over-month basis, a rebound from the 0.3% contraction witnessed in October, and exceeded market forecasts of a 0.2% increase. This expansion represented the most significant growth observed in a span of five months, predominantly propelled by a 0.4% uptick in services output. Within this sector, the information and communication segment experienced a significant surge of 1.5%, attributed mainly to enhancements in computer game publishing and telecommunications. Additionally, the wholesale and retail trade sector recorded a 0.5% increase, while professional, scientific, and technical activities saw a growth of 0.6%. Conversely, a decline of 0.2% was recorded in both the financial and insurance activities and the education sectors. The production output also witnessed a growth of 0.3%, marking its first increase since June 2023, with manufacturing contributing a 0.4% rise. In contrast, the construction sector faced a downturn of 0.2%. Over the three-month period leading up to November, the UK's GDP contracted by 0.2%.

TL;DR
SectorGrowthNotes
Overall GDP Month-over-Month+0.3%Exceeded forecasts; rebound from October's -0.3%
Services Output+0.4%Main driver of growth
Information and Communication+1.5%Boosted by computer game publishing and telecoms
Wholesale and Retail Trade+0.5%-
Professional, Scientific, and Technical Activities+0.6%-
Financial and Insurance Activities-0.2%Decline
Education-0.2%Decline
Production Output+0.3%First increase since June 2023
Manufacturing+0.4%Contributed to production growth
Construction-0.2%Decline
GDP Over the Last Three Months-0.2%Indicative of a contraction
The GDP m/m forecast indicates a 0.0% growth, a decline from the prior rate of 0.3%.

The upcoming British GDP m/m release is scheduled for Thursday the 15th at 7:00 AM GMT.

The last time, British GDP m/m was announced on the 12th of January, 2024. You may find the market reaction chart (GBPJPY M5) below:
12-01-2024-GDP-mm-GBP.jpg

USD - Core Retail Sales m/m​

The Core Retail Sales, which exclude automobile sales, provide a measure of the total value of sales at the retail level. This data is released monthly, approximately 16 days after the end of each month. Automobile sales, though accounting for about 20% of total Retail Sales, are excluded due to their high volatility, which can distort the underlying spending trends. Therefore, the Core Retail Sales data is considered a more accurate indicator of spending patterns. This measure is also known as "Retail Sales Ex Autos."

The increase, excluding automobiles, stood at 0.4%. Notably, motor-vehicle sales had surged by 1.1%, while sales at gas stations had dropped amid falling pump prices. This diverse growth led to a decline in Treasuries and US stocks, as traders had scaled back expectations for Federal Reserve interest-rate cuts in the following year. These figures, highlighting an unexpected strength in household spending, contradicted earlier recession forecasts. However, experts had anticipated a slowdown in consumer momentum for 2024 due to persistent inflation, high borrowing costs, and diminishing savings. The 'control group sales', crucial for GDP calculations, showed a 0.8% increase, the most significant since July. It's important to note that these retail statistics mainly reflected merchandise purchases, a small segment of total consumer spending, with comprehensive data on December's personal consumption expenditures expected later. In contrast, a separate report had indicated that manufacturing output experienced minimal growth in December, marking the sector's weakest performance since 2020.

TL;DR
MetricChangeDetails
Retail Sales Excluding Automobiles+0.4%Indicates solid consumer spending excluding motor-vehicle sales
Motor-Vehicle Sales+1.1%Significant increase in sales
Gas Station SalesDeclineDecreased due to falling pump prices
Market Reaction-Decline in Treasuries and US stocks as rate-cut expectations were scaled back
Household Spending-Showed unexpected strength, contrary to recession forecasts
Consumer Momentum (2024 Forecast)-Expected slowdown due to inflation, high borrowing costs, and lower savings
Control Group Sales+0.8%Largest increase since July, important for GDP calculations
Retail Statistics-Reflect merchandise purchases, a minor part of total consumer spending
Manufacturing Output (December)Minimal GrowthWeakest performance since 2020
The forecast indicates a slight decline from the prior result of 0.4% to 0.2%.

The upcoming Core Retail Sales m/m report is scheduled for release this Thursday at 1:30 PM GMT.

The last time, US Core Retail Sales m/m was announced on the 17th of January, 2024. You may find the market reaction chart (GBPUSD M5) below:
17-01-2024-Core-Retail-Sales-mm-USD.jpg

USD - Empire State Manufacturing Index​

The New York Manufacturing Index is a diffusion index derived from a survey of approximately 200 manufacturers in New York State, released monthly around the midpoint of the month in question. A reading above 0.0 signifies improving conditions, while a figure below indicates deterioration. As a leading indicator of economic health, this index reflects businesses' rapid response to market conditions, with shifts in sentiment potentially serving as precursors to broader economic activities such as spending, hiring, and investment. This index, also known as the New York Manufacturing Index, offers insights into the relative level of general business conditions as perceived by the surveyed manufacturers.

In January 2024, the NY Empire State Manufacturing Index sharply fell to -43.7, its lowest since May 2020, indicating a significant decline in New York's manufacturing activity. This drop was much steeper than the -14.5 reading in December and far below the -5 forecast. There were substantial decreases in new orders and shipments, along with a continued significant reduction in unfilled orders. Additionally, delivery times shortened, and inventories slightly decreased. There was a modest decline in employment and the average workweek. Input prices rose at a faster pace, while selling price increases remained stable. Although optimism was low, firms anticipated some improvement in the coming six months, and there was a notable increase in the capital spending index, suggesting an uptick in investment plans.

TL;DR
MetricFigureChange/Details
NY Empire State Manufacturing Index-43.7Sharpest decline since May 2020
Previous Month's Reading-14.5-
Forecast-5Actual figures far below expectations
New OrdersDecreaseSubstantial decreases noted
ShipmentsDecreaseSignificant decline observed
Unfilled OrdersSignificant ReductionContinued notable reduction
Delivery TimesShortened-
InventoriesSlight Decrease-
EmploymentModest Decline-
Average WorkweekModest Decline-
Input PricesFaster Pace Increase-
Selling Price IncreasesStable-
Future OutlookLow OptimismSome improvement expected in the next six months
Capital Spending IndexNotable IncreaseSuggests an uptick in investment plans
The forecast for the Empire State Manufacturing Index suggests an improvement to -19 from the previous figure of -43.7.

The upcoming Empire State Manufacturing Index is scheduled for Thursday the 15th at 1:30 PM GMT.

The last time, US Empire State Manufacturing Index data was announced on the 16th of January, 2024. You may find the market reaction chart (EURUSD M5) below:
16-01-2024-Empire-State-Manufacturing-Index-USD.jpg

USD - Retail Sales m/m​

The Advance Retail Sales report quantifies the monthly variation in the aggregate value of sales at the retail level, typically published around 16 days following the conclusion of the month. Serving as both the earliest and most comprehensive assessment of vital consumer spending data, this report is considered the principal indicator of consumer expenditure, which constitutes the majority of overall economic activity.

In December 2023, retail sales in the United States experienced a significant surge, with a month-over-month increase of 0.6%, surpassing expectations of 0.4% and marking the largest uptick in three months. This growth was primarily driven by a notable 1.2% increase in auto sales. Excluding auto sales, retail figures still saw a respectable rise of 0.4%. Other notable gains were observed in nonstore retailers (1.5%), clothing (1.5%), general merchandise stores (1.3%), miscellaneous store retailers (0.7%), building materials and garden equipment (0.4%), sporting goods, hobby, musical instrument, and book stores (0.3%), as well as food and beverage stores (0.2%). However, some sectors experienced declines, including health and personal care (-1.4%), gasoline stations (-1.3%), furniture (-1%), and electronics and appliances (-0.3%), while sales remained unchanged at food services and drinking establishments. When excluding auto sales, gasoline, building materials, and food services, core retail sales saw a robust increase of 0.8%, marking the most significant rise since July. Looking at the entire year of 2023, unadjusted retail sales showed a solid 3.2% growth.

TL;DR
CategoryChangeDetails
Overall Retail Sales+0.6%Largest increase in three months
Auto Sales+1.2%Major contributor to overall growth
Retail Sales Excluding Auto+0.4%Respectable rise despite excluding auto sales
Nonstore Retailers+1.5%Significant growth
Clothing Stores+1.5%Notable increase
General Merchandise Stores+1.3%Solid growth
Miscellaneous Store Retailers+0.7%Moderate increase
Building Materials and Garden Equipment Stores+0.4%Slight rise
Sporting Goods, Hobby, Musical Instrument, and Book Stores+0.3%Minor increase
Food and Beverage Stores+0.2%Small uptick
Health and Personal Care Stores-1.4%Decline
Gasoline Stations-1.3%Decrease due to falling pump prices
Furniture Stores-1%Reduction
Electronics and Appliances Stores-0.3%Slight decline
Food Services and Drinking EstablishmentsUnchangedNo growth observed
Core Retail Sales (Excluding Autos, Gasoline, Building Materials, and Food Services)+0.8%Most significant rise since July
Unadjusted Retail Sales Growth (Yearly)+3.2%Solid annual growth
The forecast suggests a decrease to 0.1% from the previous reading of 0.6%.

The upcoming Retail Sales data release is set for Thursday the 15th at 1:30 PM GMT.

The last time, US Retail Sales data was announced on the 17th of January, 2024. You may find the market reaction chart (GBPUSD M5) below:
17-01-2024-Retail-Sales-mm-USD.jpg

USD - Unemployment Claims​

The weekly release of initial unemployment insurance claims, typically published on the first Thursday following the prior week, serves as an early indicator of the nation's economic status. Market impact varies, with heightened attention during periods of significant developments or extreme readings. While considered a lagging indicator, the number of individuals filing for unemployment is a crucial signal for assessing overall economic well-being due to its strong correlation with consumer spending. Furthermore, unemployment figures hold substantial importance for policymakers responsible for steering the country's monetary policies. This data is also referred to as "Jobless Claims" or "Initial Claims."

In the week ending February 2nd, US unemployment claims decreased by 9,000, reaching 218,000, slightly surpassing the anticipated 220,000 but remaining significantly higher than the average of the preceding two months. Concurrently, continuing claims dropped by 23,000 to 1,871,000 in the final week of January, reflecting a continuation of the upward trend in unemployment that began in late January, indicating potential challenges in maintaining the labor market's robustness seen in December's strong jobs report. The four-week moving average rose by 3,750 to 212,250, while non-seasonally adjusted claims decreased by 31,192 to 232,727, with notable declines in Oregon, Ohio, and California, and increases in Missouri and Texas.

TL;DR
MetricFigureChange/Details
Initial Unemployment Claims218,000Decreased by 9,000; slightly above forecast of 220,000
Continuing Claims1,871,000Dropped by 23,000 in the last week of January
Four-Week Moving Average212,250Increased by 3,750
Non-Seasonally Adjusted Claims232,727Decreased by 31,192; notable declines in Oregon, Ohio, California
Notable State Increases-Increases in Missouri and Texas
The projected number of Unemployment Claims is expected to rise marginally to 220,000, up from the previous figure of 218,000.

The upcoming release of Unemployment Claims data is scheduled for Thursday at 1:30 PM GMT.

The last time, US Unemployment Claims data was announced on the 8th of February, 2024. You may find the market reaction chart (NZDUSD M5) below:

08-02-2024-Unemployment-Claims-USD.jpg


Disclaimer: The market news provided herein is for informational purposes only and should not be considered trading advice.
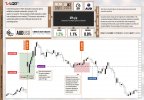
 

Daniel LQDFX

Trader
Jul 21, 2023
126
0
22
43

Daily News Update


16 February 2024​

Friday​

This upcoming Friday will feature noteworthy economic data releases from both Great Britain and the United States. Great Britain is set to announce its monthly Retail Sales figures, while the United States has scheduled the release of its monthly Core Producer Price Index (PPI), Producer Price Index (PPI), and Preliminary University of Michigan Consumer Sentiment data.​


GBP – Retail Sales m/m​

The monthly release of Retail Sales data, typically made available approximately 20 days after the close of the respective month, quantifies fluctuations in the aggregate value of sales within the retail sector, adjusted for inflation. This indicator assumes a paramount role as the primary barometer of consumer spending, which constitutes a substantial component of the broader economic landscape. It is also referred to as "Sales Volume" or "All Retailers Sales."

In December 2023, the UK experienced a significant 3.2% decrease in retail sales, a sharp contrast to the 1.4% rise seen in the previous month and surpassing predictions of a mere 0.5% decline. This drop was the steepest since January 2021. A notable factor was the 3.9% plunge in non-food store sales, attributed to consumers opting to buy gifts earlier in November. Specific sectors saw varying declines: department stores faced a 7.1% reduction, household goods stores decreased by 3.0%, clothing stores fell by 1.5%, and other non-food stores saw a 4.5% drop. Food sales also decreased by 3.1%, and non-store retailing, impacted by inflation, went down by 2.1%. Additionally, sales in automotive fuel reduced by 1.9%. On an annual basis, there was a 2.4% downturn in trade, deviating from the expected 1.1% growth. Overall, 2023 witnessed a 2.8% decline in retail sales, marking the lowest point since 2018.

TL;DR
GBP – Retail Sales m.m.png
The forecast is indicating an increase to 1.2% from the previous outcome of -3.2%.

The upcoming Retail Sales m/m data release is slated for Friday the 16th at 7:00 AM GMT.

The last time, British Retail Sales m/m data was announced on the 19th of January, 2024. You may find the market reaction chat (EURGBP M5) below:
19-01-2024-Retail-Sales-mm-GBP.jpg


USD - Core PPI m/m​

The Core Producer Price Index (PPI) month-to-month (m/m) metric gauges fluctuations in the prices of completed goods and services offered by producers, with food and energy components excluded. This data is typically published on a monthly basis, approximately 13 days after the conclusion of the respective month. It is important to note that the methodology for calculating this series was altered in February 2014. It should also be acknowledged that food and energy prices constitute a substantial 40% of the overall PPI, which has the effect of diminishing the significance of the Core PPI data. This specific metric is alternatively referred to as the Core Finished Goods PPI or the Core PPI for Final Demand.

In December 2023, the Core Producer Prices in the United States, which exclude volatile items such as food and energy, remained unchanged, continuing a trend seen in the previous two months of October and November. This stability contradicted market expectations, which had anticipated a 0.2% increase. When examining the data on an annual basis, the US core Producer Price Index (PPI) recorded a 1.8% increase in December. This represents a slight slowdown compared to the 2% growth observed in the preceding month and is notably below market forecasts, which had predicted a 0.9% increase. This trajectory in core PPI suggests a nuanced economic landscape, deviating from market projections and hinting at a more intricate economic environment.

TL;DR
USD - Core PPI m.m.png
The Core PPI m/m forecast suggests a marginal uptick, moving from the previous reading of 0.0% to 0.1%.

The upcoming release of the PPI m/m data is scheduled for Friday the 16th at 1:30 PM GMT.

The last time, the US Core PPI m/m was announced on the 12th of January, 2024. You may find the market reaction chart (GBPUSD M5) below:
12-01-2024-Core-PPI-mm-USD.jpg

USD - PPI m/m​

The Producer Price Index (PPI) for finished goods and services represents a monthly measurement of price fluctuations in products and services offered by producers. This economic indicator is typically released approximately 13 days after the conclusion of the respective month. It serves as a leading gauge for consumer inflation, as an increase in producer prices often leads to higher costs for consumers. The PPI encompasses various components, including Finished Goods PPI, Wholesale Prices, and PPI for Final Demand.

In December of 2023, there was an unexpected 0.1% decline in producer prices in the United States compared to the previous month. This decline followed a similar trend observed in November, defying forecasts that had predicted a 0.1% increase. The decrease in prices was primarily driven by a 0.4% drop in the cost of goods, marking the third consecutive monthly decline. The significant factor contributing to this decrease was a notable 12.4% fall in diesel fuel prices, even though gasoline prices did increase by 2.1%. In contrast, service prices remained stable, consistent with the trend seen in the previous two months. Notable fluctuations within the services sector included a 3.3% increase in costs related to securities brokerage, dealing, and investment advice, but there was a 5.5% decrease in margins for machinery and vehicle wholesaling. Additionally, the core Producer Price Index (PPI), which excludes food and energy costs, remained unchanged, contrary to expectations of a 0.2% rise. On an annual basis, the headline PPI rate increased slightly to 1% from 0.8%, which was lower than the anticipated 1.3%. Meanwhile, the core rate experienced a decrease, dropping to 1.8% from 2%, in contrast to market expectations of a 1.9% increase.

TL;DR
USD - PPI m.m.png
According to the PPI m/m forecast, there is an expected increase to 0.1% from the previous -0.1%.

The upcoming release of the PPI m/m data is scheduled for this Friday the 16th at 1:30 PM GMT.

The last time, the US PPI m/m was announced on the 12th of January, 2024. You may find the market reaction chart (GBPUSD M5) below:
12-01-2024-PPI-mm-USD.jpg

USD - Prelim UoM Consumer Sentiment​

The Preliminary University of Michigan (UoM) Consumer Sentiment Index is a composite measure derived from surveys of consumers and is released on a monthly basis, typically around the middle of the month. Two versions of this data are published, with a 14-day gap between them - the Preliminary and Revised releases. The Preliminary release, being the earlier of the two, tends to exert the most significant influence on market sentiment. This index serves as a leading indicator for consumer spending, a crucial component of overall economic activity. The survey involves approximately 500 respondents who are asked to assess the current and future economic conditions, providing valuable insights into consumer sentiment.

In January 2024, the University of Michigan consumer sentiment index for the United States was adjusted upward to 79, surpassing the preliminary figure of 78.9 and marking its highest level since July 2021. The expectations component of the index also saw an upward revision, rising to 77.1 from the previous 75.9, while the sub-index measuring current conditions was slightly revised downward to 81.9 from its earlier reading of 83.3. Meanwhile, the inflation expectations for the year remained steady at 2.9%, representing the lowest level since December 2020. Additionally, the 5-year inflation outlook was revised upward to 2.9% from its prior figure of 2.8%.

TL;DR
USD - Prelim UoM Consumer Sentiment.png
The Preliminary UoM Consumer Sentiment report is expected to show a modest rise to 79.5, up from the previous reading of 79.

The upcoming Preliminary UoM Consumer Sentiment report is set to be released on Friday the 16th at 3:00 PM GMT.

The last time, the US Preliminary UoM Consumer Sentiment report was announced on the 19th of January, 2024. You may find the market reaction chart (USDJPY M5) below:


19-01-2024-Prelim-UoM-Consumer-Sentiment-USD.jpg


Disclaimer: The market news provided herein is for informational purposes only and should not be considered trading advice.
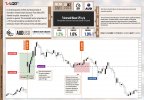
 

Daniel LQDFX

Trader
Jul 21, 2023
126
0
22
43

Daily News Update


21 February 2024​

Wednesday​

Key news releases are anticipated on Wednesday from Australia and the US. Australia is set to unveil its Wage Price Index quarter-over-quarter, while the US will publish its FOMC Meeting Minutes.​


AUD - Wage Price Index q/q​

The Wage Cost Index, also known as the Labour Price Index, quantifies the change in labor costs that businesses and the government incur, exclusive of bonuses. This data is disseminated quarterly, approximately 45 days following the end of the quarter. Serving as a precursor to consumer inflation, this index reflects the principle that increased labor expenses borne by businesses tend to be transferred to consumers through higher prices.

Australia's wage price index surged by 4.0% year-on-year in Q3 2023, surpassing market expectations of 3.9%. This marked the highest reading since Q1 2009, with private sector wages growing at 4.2%, the highest since Q4 2008, and public sector wages reaching their peak since Q2 2011 at 3.5%. Key contributors to this growth included accommodation, healthcare, arts, manufacturing, and more. Quarterly wage prices also rose significantly by 1.3%, matching forecasts and indicating robust economic performance.

In the third quarter of 2023, Australia witnessed a 4.0% year-on-year increase in its seasonally adjusted wage price index, surpassing the 3.6% rise observed in the second quarter and slightly exceeding the anticipated 3.9%. This marked the highest level since the first quarter of 2009, with private sector wages having climbed by 4.2%, the highest since the fourth quarter of 2008, and public sector wages reaching a peak not seen since the second quarter of 2011 at 3.5%. Breaking it down by industry, the largest gains were noted in accommodation (5.5%), healthcare and social assistance (4.9%), arts and recreation services (4.6%), along with consistent growth in manufacturing, transport, postal and warehousing, retail trade, construction, administrative and support services, mining, and utilities, all having contributed significantly to the overall increase. On a quarter-over-quarter basis, wages had advanced by 1.3%, a notable jump from a revised 0.9% in the previous quarter, representing the most significant quarterly increase since at least the third quarter of 1997, aligning with projections.

TL;DR
AUD - Wage Price Index q.q.png
The projected change for the Wage Price Index q/q stands at 1%, down from the previous figure of 1.3%.

The upcoming Wage Price Index q/q is scheduled to be released this Wednesday at 1:30 AM GMT.

The last time, Australian Wage Price Index was announced on the 15th of November, 2023. You may find the market reaction chart (AUDUSD M5) below:

15-11-2023-Wage-Price-Index-qq-AUD.jpg

USD - FOMC Meeting Minutes​

A more hawkish outcome than anticipated typically benefits the currency. The minutes of the Federal Open Market Committee (FOMC) meeting are released eight times a year, three weeks following the announcement of the Federal Funds Rate. These minutes offer a comprehensive examination of the economic and financial circumstances that guided the FOMC's decision on setting interest rates.

In December 2023, the Federal Reserve maintained the federal funds rate at 5.25%-5.5% for the third consecutive meeting, matching expectations. However, it signaled potential 75bps reductions in 2024. Policymakers noted a slowdown in economic growth and moderated yet strong job gains, with a consistently low unemployment rate. Although inflation has declined over the past year, it remains high. The Fed's updated forecasts show an increase in GDP growth for the current year to 2.6% (up from the previous 2.1%) but a slight decrease to 1.4% for 2024. PCE inflation estimates for 2023 and 2024 were revised downwards to 2.8% and 2.4%, respectively, with core PCE inflation projected at 3.2% for 2023 and 2.4% for 2024. Unemployment rate projections are stable at 3.8% for 2023 and 4.1% for the next year. The median federal funds rate projection for the end of 2024 dropped to 4.6%, from September's projection of 5.1%.

TL;DR
USD - FOMC Meeting Minutes.png
The upcoming FOMC Meeting Minutes are scheduled for Wednesday at 7:00 PM GMT.


Disclaimer: The market news provided herein is for informational purposes only and should not be considered trading advice.

 

Daniel LQDFX

Trader
Jul 21, 2023
126
0
22
43

Daily News Update


22 February 2024​

Thursday​

Thursday is anticipated to be a pivotal day for financial markets due to a series of consequential news releases. The schedule includes the release of the French Flash Manufacturing and Services PMI, followed by the German Flash Manufacturing and Services PMI. Additionally, Great Britain is set to release its Flash Manufacturing and Services PMI, culminating with the United States announcing its Unemployment Claims along with its own Flash Manufacturing and Services PMI.​


EUR - French Flash Manufacturing PMI​

The Purchasing Managers' Index (PMI) serves as a key monthly economic gauge, originating from surveys conducted among purchasing managers in the manufacturing sector to capture the state of the industry. An index value exceeding 50 signifies industry expansion, whereas a value below 50 denotes contraction. The PMI is released in two phases: the preliminary 'Flash' PMI, which often exerts greater influence due to its early release, and the subsequent 'Final' PMI. As a forward-looking indicator, the PMI offers valuable insights into the economic outlook and business climate, drawing on the perspectives of approximately 750 respondents on critical business variables such as employment and production levels.

In a recent update from the economic sector, the HCOB France Manufacturing Purchasing Managers' Index (PMI) showed a modest uptick to 43.1 in January 2024, recovering slightly from a more than three-year low of 42.1 recorded in the previous month. This slight improvement, albeit revised down from a preliminary estimate of 43.2, marks the highest PMI reading since September 2023. The easing in the rate of decline in new orders, noted as the slowest in seven months, contributed to this uptick. However, the manufacturing sector's output growth marginally decelerated from the previous month's peak, which was the most rapid since May 2020, primarily affected by the performance of intermediate and investment goods sectors. The report also highlighted a significant increase in suppliers' delivery times, the largest in nearly a year, alongside a more pronounced decrease in purchasing volumes. Inventories of raw materials and other manufacturing necessities saw their most substantial decline since April 2020, mainly due to diminished demand. On a positive note, input costs witnessed a continued decrease for the second consecutive month, the most significant drop since September 2023, largely driven by falling oil and energy prices. Despite these developments, the outlook among French manufacturers remains cautious, with prevailing concerns over a sustained downturn in demand.

TL;DR
MetricJanuary 2024 DataContext/RemarksMetric
PMI Reading43.1Modest uptick from 42.1 in Dec; highest since Sep 2023PMI Reading
Preliminary Estimate RevisionRevised down from 43.2Slight adjustment in final figurePreliminary Estimate Revision
New Orders Rate of DeclineSlowest in 7 monthsContributed to PMI improvementNew Orders Rate of Decline
Output GrowthMarginally deceleratedSlower than Dec's peak, the fastest since May 2020Output Growth
Affected SectorsIntermediate and investment goods sectorsPrimarily influenced output decelerationAffected Sectors
Suppliers' Delivery TimesLargest increase in nearly a yearSignifies supply chain pressuresSuppliers' Delivery Times
Purchasing VolumesMore pronounced decreaseReflects cautious demand outlookPurchasing Volumes
Inventory DeclineMost substantial since April 2020Driven by diminished demandInventory Decline
Input CostsSignificant decrease for the second monthLargest drop since Sep 2023, influenced by lower oil pricesInput Costs
Manufacturers' OutlookCautiousConcerns over sustained downturn in demandManufacturers' Outlook

The forecast is showing a rise to 44.0 from the previous outcome of 43.1.

The upcoming Flash Manufacturing PMI is scheduled for Thursday at 8:15 AM GMT.

The last time, the French Flash Manufacturing PMI was announced on the 24th of January,2024. You may find the market reaction chart (EURUSD M5) below:

24-01-24-French-Flash-Manufacturing-PMI-EUR.jpg


EUR – French Flash Services PMI​

The Services Purchasing Managers' Index (PMI) is a diffusion index compiled from monthly surveys of service sector purchasing managers, providing insights into the sector's performance. A PMI score above 50 indicates growth, while a score below 50 suggests decline. The index includes both "Flash" and "Final" versions, with the "Flash" version, launched in March 2008, typically having a more significant influence. Serving as an important indicator of economic health, the PMI reflects the opinions and conditions reported by approximately 750 participating managers, encompassing various factors such as employment levels, order volumes, and pricing.

In January 2024, the HCOB France Services PMI was adjusted upwards to 45.4 from an initial estimate of 45, a slight decrease from December's 45.7. This figure indicated that the French services sector experienced contraction for the eighth consecutive month, primarily due to client reluctance and overall weak demand affecting business activity and the influx of new work. Additionally, the sector faced increased inflationary pressures, particularly from rising wages. Despite these challenges, the survey highlighted some optimistic trends, including an improvement in business optimism to the highest level in five months and the continuation of employment growth.

TL;DR
MetricJanuary 2024 DataContext/RemarksMetricJanuary 2024 Data
PMI Reading45.4Adjusted from initial 45; slight decrease from Dec's 45.7PMI Reading45.4
Contraction Duration8th consecutive monthIndicative of ongoing sector challengesContraction Duration8th consecutive month
Primary ChallengesClient reluctance, weak demandAffecting business activity and new work influxPrimary ChallengesClient reluctance, weak demand
Inflationary PressuresNoted, particularly from rising wagesContributing to sector's challengesInflationary PressuresNoted, particularly from rising wages
Business OptimismHighest in five monthsDespite challenges, outlook is improvingBusiness OptimismHighest in five months
Employment GrowthContinuedPositive trend in employment despite sector contractionEmployment GrowthContinued
The forecast suggests a modest increase to 45.7 from the previous figure of 45.4.

The upcoming Flash Services PMI is scheduled for Thursday at 8:15 AM GMT.

The last time, the French Flash Services PMI was announced on the 24th of January,2024. You may find the market reaction chart (EURUSD M5) below:

24-01-24-French-Flash-Services-PMI-EUR.jpg


EUR - German Flash Manufacturing PMI​

The Manufacturing Purchasing Managers' Index (PMI) is a key monthly indicator, derived from surveys of 800 purchasing managers, reflecting the health of the manufacturing sector. A PMI above 50 indicates expansion, below 50 contraction. The index is released in two versions, "Flash" and "Final," approximately a week apart, with the "Flash" release, introduced in March 2008, often having more influence. As a leading indicator, it offers insights into economic conditions by assessing factors like employment, production, and new orders from the perspective of those directly involved in industry procurement.

The HCOB Germany Manufacturing PMI for January 2024 was reported at 45.5, an increase from December's 43.3 and slightly above the anticipated 45.4. This marks the highest level since February, despite the index still indicating a contraction phase. The slowdown in new order declines was the most moderate since April 2023, with a less steep drop in export orders as well. Production declines were at their mildest in eight months, and the reduction in purchasing activity was the smallest since March of the previous year. German manufacturers continued to reduce staff numbers for the seventh consecutive month, with the rate of job cuts remaining significant and similar to the previous month's. In terms of pricing, the fall in input costs eased to its lowest in nine months, and the decrease in output prices was the second least severe in the ongoing downturn. However, business optimism weakened from December and remained substantially below the long-term average.

TL;DR
MetricJanuary 2024 DataContext/RemarksMetric
PMI Reading45.5Increase from Dec's 43.3; highest since Feb but indicates contractionPMI Reading
New Order DeclineMost moderate since April 2023Slowdown in decline pace, including less steep drop in export ordersNew Order Decline
Production DeclinesMildest in eight monthsShows easing in production contractionProduction Declines
Purchasing ActivitySmallest reduction since March 2023Indicates improvement in purchasing trendsPurchasing Activity
EmploymentContinued reductionSeventh consecutive month of job cuts, rate similar to previous monthEmployment
Input CostsEased fall, lowest in nine monthsReduction in input price pressuresInput Costs
Output PricesSecond least severe decreaseIndicates some stabilization in pricingOutput Prices
Business OptimismWeakened from DecemberRemains below long-term average despite some positive indicatorsBusiness Optimism
The forecast for the Flash Manufacturing PMI suggests an increase to 46.6 from the previous outcome of 45.5.

The Flash Manufacturing PMI is set to be released this Thursday at 8:30 AM GMT.

The last time, the German Flash Manufacturing PMI was announced on the 24th of January,2024. You may find the market reaction chart (EURJPY M5) below:

24-01-24-German-Flash-Manufacturing-PMI-EUR.jpg


EUR - German Flash Services PMI​

The Services Purchasing Managers' Index (PMI) is a vital monthly diffusion index from surveys of 800 purchasing managers, gauging the services sector's performance. A PMI above 50 signals expansion, while below 50 indicates contraction. The index is issued in "Flash" and "Final" versions, roughly a week apart, with the "Flash" release typically having greater significance since its inception in March 2008. Serving as a leading economic indicator, the PMI reflects the sector's response to market conditions through purchasing managers' assessments of various business aspects such as employment, orders, and pricing.

In January 2024, the HCOB Germany Services Purchasing Managers' Index (PMI) saw a minor adjustment to 47.7, up from an initial estimate of 47.6 but down from December's 49.3. This marked the most rapid contraction in the services sector witnessed in five months, attributed to sustained demand weaknesses amidst political and economic uncertainties, along with elevated borrowing costs. Inflation pressures persisted, with cost increases hitting an eight-month high due to rising wages, while the inflation rate for output prices remained stable compared to the previous month. Despite this, service companies avoided reducing their workforce, buoyed by a slight improvement in future activity expectations. Optimism improved for the second consecutive month, reaching its highest level since the previous May, driven by hopes for easing inflation, reduced interest rates, and a rebound in demand. However, fears of a recession and geopolitical concerns continued to dampen confidence levels.

TL;DR
MetricJanuary 2024 DataContext/Remarks
PMI Reading47.7Minor adjustment from 47.6, down from Dec's 49.3
Rate of ContractionMost rapid in five monthsIndicative of increased sector challenges
Demand WeaknessSustainedDue to political, economic uncertainties, high borrowing costs
Inflation PressuresCost increases at eight-month highDriven by rising wages
Output Price InflationStable compared to previous monthDespite cost pressures
EmploymentMaintainedSupported by slight optimism in future activity expectations
Business OptimismImproved, highest since last MayHopes for easing inflation, lower interest rates, demand rebound
Recession & Geopolitical ConcernsContinued impact on confidenceDespite optimism, concerns remain significant
Predictions for the upcoming Flash Services PMI suggest a slight improvement to 48.4, up from the previous figure of 47.7.

The upcoming Flash Services PMI is scheduled for release on Thursday at 8:30 AM GMT.

The last time, the German Flash Services PMI was announced on the 24th of January,2024. You may find the market reaction chart (EURJPY M5) below:

24-01-24-German-Flash-Services-PMI-EUR.jpg

GBP – Flash Manufacturing PMI​

The Manufacturing Purchasing Managers' Index (PMI) is a critical diffusion index, collected from around 650 purchasing managers' surveys, that evaluates the manufacturing sector's state each month. Scores above 50 denote expansion, while those below 50 suggest contraction. The index is released in two editions, "Flash" and "Final," with the "Flash" version, first reported in November 2019, generally exerting more influence due to its earlier release. As a leading economic indicator, the PMI quickly reflects changes in market conditions through detailed insights from purchasing managers on various business aspects like employment, production, and new orders.

In January 2024, the S&P Global UK Manufacturing PMI was adjusted downwards to 47, falling from an initial estimate of 47.3. This period saw ongoing reductions in both production and new orders, leading to further job losses, decreased purchasing, and lower inventory levels. The manufacturing sector also encountered disruptions in supply chains, largely due to the crisis in the Red Sea, which necessitated the rerouting of input deliveries away from the Suez Canal. Nonetheless, amidst these challenges, the optimism among UK manufacturers improved, with business confidence hitting its highest level in four months.

TL;DR
MetricJanuary 2024 DataContext/Remarks
PMI Reading47.0Adjusted from initial 47.3
Production & New OrdersContinued reductionsLeading to further industry contraction
EmploymentFurther job lossesResulting from decreased production and orders
Purchasing & Inventory LevelsDecreasedReflecting reduced demand and production needs
Supply Chain DisruptionsDue to Red Sea crisisNecessitated rerouting away from Suez Canal
Business OptimismImproved, highest in four monthsDespite ongoing sector challenges
Predictions for the upcoming Flash Manufacturing PMI point to a slight increase to 47.3, from the previous result of 47.

The next Flash Manufacturing PMI is set to be unveiled this Thursday at 9:30 AM GMT.

The last time, the British Flash Manufacturing PMI was announced on the 24th of January,2024. You may find the market reaction chart (GBPJPY M5) below:

24-01-24-Flash-Manufacturing-PMI-GBP.jpg


GBP – Flash Services PMI​

The Services Purchasing Managers' Index (PMI) is a monthly diffusion index derived from the surveys of approximately 650 purchasing managers, indicating the services sector's health. A PMI above 50 suggests expansion, below 50 contraction. The index is published in "Flash" and "Final" versions, with the "Flash" release, introduced in November 2019, typically having more impact due to its timeliness. As a leading indicator, the PMI provides early insights into economic conditions by capturing purchasing managers' perspectives on key business variables such as employment, order volumes, and pricing.

In January 2024, the S&P Global UK Services PMI climbed to 54.3, up from 53.4 the month before, surpassing the initial estimates of 53.8. This marked the most rapid expansion in UK services activity in eight months. The surge was driven by a notable rise in new business, fueled by improved economic conditions and increased confidence among clients, spurred by anticipated interest rate reductions by the Bank of England and a surge in orders from the US and Asia. This uptick in business led to a significant increase in employment within the service sector, reaching the fastest rate of job creation since July 2023. However, rising staff wages contributed to an acceleration in input costs, leading to higher charges for services. Future outlooks are positive, bolstered by expectations of stronger client demand, strategic business investments, and a more favorable economic environment.

TL;DR
MetricJanuary 2024 DataContext/Remarks
PMI Reading54.3Up from 53.4 in December, highest in 8 months
New BusinessNotable riseDriven by improved economic conditions, client confidence
InfluencesAnticipated interest rate reductions, orders from the US and AsiaContributed to increased business activity
EmploymentFastest rate of job creation since July 2023Resulting from the uptick in business
Input CostsAcceleratedRising staff wages contributing to higher service charges
Future OutlookPositiveSupported by expectations of stronger client demand and favorable economic conditions
The anticipated forecast for the Flash Services PMI suggests a minor uptick to 54.5, from the earlier figure of 54.3.

The upcoming Flash Services PMI will be released on Thursday at 9:30 AM GMT.

The last time, the British Flash Services PMI was announced on the 24th of January,2024. You may find the market reaction chart (GBPJPY M5) below:

24-01-24-Flash-Services-PMI-GBP.jpg


USD - Unemployment Claims​

The Initial Jobless Claims report, also known as Jobless or Initial Claims, tracks weekly first-time unemployment insurance filings. Issued every Thursday, it represents the most immediate economic data available. Its influence on markets can vary, often gaining attention during periods of significant economic shifts or unusual data readings. Though considered a lagging indicator, the report is key for gauging economic health, as unemployment levels are closely linked to consumer spending and are vital for shaping monetary policy.

The number of people claiming unemployment benefits in the United States decreased by 8,000 from the previous week's upwardly revised figure, reaching 212,000 for the period ending February 9th, significantly lower than the market estimates of 220,000. This marked the lowest level in nearly a month, complementing a recent jobs report that highlighted the historic tightness of the US labor market, thereby providing the Federal Reserve with continued justification for its hawkish stance. The four-week moving average, aimed at smoothing week-to-week fluctuations, experienced an increase of 5,750, settling at 218,500 for the period. The non-seasonally adjusted initial claim count witnessed a decline of 12,565, dropping to 222,164, with notable decreases in Missouri (-3,594) and Pennsylvania (-1,517) offsetting rises in Kentucky (3,264) and California (2,578). Conversely, continuing claims saw an uptick of 30,000, reaching 1,895,000 in the week prior, indicating an increased challenge for the unemployed population in securing suitable employment.

TL;DR
MetricDataContext/Remarks
Initial Claims212,000Decreased by 8,000 from the previous week, lowest in nearly a month
Market Estimates220,000Actual claims were significantly below estimates
Four-Week Moving Average218,500Increased by 5,750, smoothing week-to-week fluctuations
Non-Seasonally Adjusted Claims222,164Decreased by 12,565; notable decreases in Missouri and Pennsylvania
Continuing Claims1,895,000Increased by 30,000 from the week prior, indicating challenges in job market
The projected figures for Unemployment Claims show a modest rise to 215,000, up from the prior result of 212,000.

The upcoming Unemployment Claims report is scheduled for Thursday at 1:30 PM GMT.

The last time, the US Unemployment Claims report was announced on the 15th of February, 2024. You may find the market reaction chart (GBPUSD M5) below:

15-02-2024-Unemployment-Claims-USD.jpg


USD - Flash Manufacturing PMI​

This is a key measure of economic vitality, highlighting how businesses promptly adapt to changes in the market. The viewpoints of purchasing managers in these companies are often the most timely and significant in reflecting the company's economic perspective. It includes a survey of around 800 purchasing managers, who are asked to give their assessment of various business aspects, including employment, production, new orders, prices, supplier deliveries, and inventory levels.

The S&P Global US Manufacturing PMI for January 2024 was revised upward to 50.7 from the initial estimate of 50.3, indicating a more significant improvement in manufacturing conditions than previously anticipated. This marks the highest reading since September 2022. While growth remains modest, it was supported by a rebound in new orders and a slower decline in output. However, production was hindered by worsening supplier performance and longer delivery times for inputs. Increased transportation costs led to higher input prices, reaching a nine-month peak in cost inflation. Consequently, firms raised their selling prices at the quickest pace since April 2023. Expectations of stronger output and a rise in new orders prompted firms to increase hiring, resulting in employment growth for the first time since September of the previous year.

TL;DR
MetricJanuary 2024 DataContext/Remarks
PMI Reading50.7Revised from 50.3; highest since September 2022
New OrdersReboundContributing to the improvement in manufacturing conditions
Output DeclineSlowerDespite challenges, a less steep decline observed
Supplier PerformanceWorsenedLeading to longer delivery times for inputs
Input PricesNine-month peakDriven by increased transportation costs
Selling PricesQuickest pace since April 2023Firms responding to higher input costs
EmploymentGrowthFirst increase since September of the previous year
The prediction for Flash Manufacturing PMI suggests a minor uptick to 50.8 from the earlier result of 50.7.

The upcoming Flash Manufacturing report is scheduled for Thursday at 2:45 PM GMT.

The last time, the US Flash Manufacturing PMI was announced on the 24th of January, 2024. You may find the market reaction chart (GBPUSD M5) below:

24-01-24-Flash-Manufacturing-PMI-USD.jpg

USD - Flash Services PMI​

This index measures the economic health of the service sector through a diffusion index derived from a survey of approximately 400 purchasing managers, conducted monthly around the third week. A score above 50 signals expansion, while below 50 indicates contraction. The report is issued in two versions, Flash and Final, with the Flash version, first introduced in November 2013, generally having more impact due to its early release. Serving as a leading economic indicator, the index reflects the quick response of businesses to market conditions, with purchasing managers providing vital, up-to-date insights into various business conditions such as employment, production, new orders, prices, deliveries, and inventories.

The S&P Global US Services PMI for January 2024 was adjusted downward to 52.5 from an initial estimate of 52.9. Nonetheless, it still indicates robust growth in the services sector, marking the strongest expansion in seven months. Accelerated growth in new orders, driven by improved domestic demand and a notable increase in new export orders since August 2023, contributed to this trend. Consequently, firms expressed heightened optimism about future output and continued to expand their workforce. This expansion was partly prompted by renewed capacity pressure, evidenced by the first increase in backlogs of work in seven months. Inflationary pressures eased, leading services providers to raise output charges at the slowest rate since June 2020, supported by slower growth in input costs. Input prices in the service sector increased at the second-slowest pace since October 2020.

TL;DR
MetricJanuary 2024 DataContext/Remarks
PMI Reading52.5Adjusted from 52.9; strongest expansion in 7 months
New OrdersAccelerated growthDriven by improved domestic demand and increased export orders
Future Output OptimismHeightenedFirms optimistic about future growth
EmploymentExpandedExpansion in response to renewed capacity pressure
Backlogs of WorkIncreaseFirst rise in 7 months, indicating growing demand
Inflationary PressuresEasedLeading to slower rise in output charges
Input PricesSecond-slowest pace since Oct 2020Reflecting easing cost pressures in the sector

The forecast for Flash Services PMI indicates a slight drop to 52.3 from the prior result of 52.5.

The upcoming Flash Services PMI is scheduled for Thursday at 2:45 PM GMT.

The last time, the US Flash Services PMI was announced on the 24th of January, 2024. You may find the market reaction chart (GBPUSD M5) below:

24-01-24-Flash-Services-PMI-USD.jpg


Disclaimer: The market news provided herein is for informational purposes only and should not be considered trading advice.
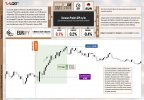
 

Daniel LQDFX

Trader
Jul 21, 2023
126
0
22
43

Daily News Update


27 February 2024​

Tuesday​

The United States is set to unveil its Consumer Confidence Index on February 27th, marking a significant announcement that could impact markets and economic forecasts nationwide. Meanwhile, Germany is set to announce its Consumer Climate report.​


USD – CB Consumer Confidence​

This composite index, gauging financial confidence, is derived from a survey of approximately 3,000 households and serves as a pivotal leading indicator of consumer spending, a major component of overall economic activity. Released monthly on the last Tuesday, it assesses respondents’ perceptions of both current and future economic conditions, including labor market dynamics, business environment, and the broader economic landscape.

In a notable uptick, the Conference Board Consumer Confidence Index had climbed to 114.8 in January, marking its highest level since December 2021 and continuing a three-month streak of increases from a revised 108.0 in December. This surge had reflected an optimistic shift in consumer sentiment, particularly evident in the Present Situation Index, which had leaped to 161.3 from 147.2, indicating a more positive view of current business and labor market conditions. Similarly, the Expectations Index, which gauges short-term economic prospects, had risen to 83.8 from 81.9.

Dana Peterson, Chief Economist at The Conference Board, had attributed the January boost in consumer confidence to a combination of slowing inflation, the anticipation of reduced interest rates, and strong employment conditions, despite companies’ tendency to retain labor. The uplift in sentiment had spanned all age demographics, with the most significant increase among consumers aged 55 and above, and was observed across all income brackets except for the highest earners, with households making over $125,000 experiencing a minor decline.

Despite ongoing concerns about inflation, as indicated by write-in responses, consumer inflation expectations had dropped to a three-year low. While there had been a slight decrease in buying intentions in January, overall assessments of income and personal financial situations had remained strong for the present and the upcoming six months. Furthermore, the perceived likelihood of a U.S. recession in the next 12 months had continued to diminish, aligning with the rise in the Expectations Index above 80, signaling a cautiously optimistic economic outlook among consumers.

TL;DR.

  • Consumer Confidence Index rose to 114.8 in January, highest since December 2021.
  • Present Situation Index jumped to 161.3, reflecting positive views on business and labor.
  • Expectations Index increased to 83.8, indicating better short-term economic prospects.
  • Confidence boost due to slowing inflation, potential for lower interest rates, and strong employment.
  • Sentiment improved across all ages, especially among those 55+, but dipped for highest earners (> $125,000).
  • Inflation concerns persist, but consumer inflation expectations at a three-year low.
  • Slight decrease in buying intentions, but strong income and financial situation assessments.
  • Reduced perceived likelihood of a U.S. recession in the next 12 months.

The CB Consumer Confidence projection is set at 114, slightly lower than the previous figure of 114.8.

The forthcoming release of the CB Consumer Confidence report is set for Tuesday at 3:00 PM GMT.

The last time, the US CB Consumer Confidence report was announced on the 30th of January, 2024. You may find the market reaction chart (GBPUSD M5) below:

30-01-2024-CB-Consumer-Confidence-USD-N.jpg

USD – Durable Goods Orders​

The durable goods orders announcement in the US is a key economic indicator that reflects new orders placed with domestic manufacturers for delivery of factory hard goods in the near term or future. Durable goods are items intended to last more than three years, such as vehicles, appliances, and machinery. This data provides insights into manufacturing activity, business investment, and consumer confidence. A rise in durable goods orders often suggests an uptick in economic activity, indicating that businesses and consumers are spending more on equipment and high-value items, while a decline may signal a slowdown. The report is closely watched by economists, investors, and policymakers as it can influence monetary policy decisions and market trends.

In December 2023, the United States saw no significant change in its manufactured durable goods orders, following a notable 5.5 percent increase in November. This was contrary to the anticipated 1.1 percent growth expected by the market. When transportation items are excluded, there was a modest rise of 0.6 percent in new orders, and a 0.5 percent increase when defense orders are removed from the calculation. The growth was primarily fueled by the primary metals sector, which has seen gains in three of the past four months, climbing by $0.4 billion or 1.4 percent to reach $27.1 billion.

TL;DR

The forecast for US Durable Goods Orders data is reading a decrease of 4.5%, from the previous 0% change compared to the last time.

The data is set to be released at 03:30 PM GMT on the 27th of February, 2024.

The last time, the US Durable Goods Orders data was released on the 30th of January, 2024. You may find the market reaction chart (USOil M5) below:

25-01-2024-Durable-Goods-Orders-mm-USD-N.jpg

EUR – GfK Consumer Climate​

The GfK Consumer Climate Indicator derives from a survey conducted with over 2,000 participants aged 14 and older. This survey assesses their outlook on income, propensity to purchase, and inclination towards saving. The indicator's components are determined by subtracting the count of negative responses from the positive ones for each question posed. These components can range from -100 to +100 points, with the zero-point marking the historical average.

Heading into February 2024, the GfK Consumer Climate Indicator for Germany saw an unexpected drop to -29.7 from a revised January figure of -25.4. This latest reading, significantly below the anticipated -24.5, marks the lowest point in nearly a year, driven by decreases in income expectations (falling to -20.0 from January's -6.9), buying willingness (-14.8 from -8.8), and economic outlook (-6.6 from -0.4). Concurrently, the saving inclination soared to its highest level since August 2008, reaching 14.0 compared to the previous 7.3. Rolf Bürkl, a consumer expert at NIM, commented on the findings: "These outcomes delay any expectations of an imminent revival in the consumer climate." He also noted that the combination of ongoing crises, conflicts, and sustained high inflation levels continues to disrupt consumer confidence and hinder any improvement in consumer sentiment.

TL;DR

The forecast for the German GfK Consumer Climate Indicator report is reading an increase to -28, from the previous -29.7.

The announcement for the GfK Consumer Climate Indicator report is set to be released at 9:00 am GMT on Tuesday the 26th of February, 2024.


Disclaimer: The market news provided herein is for informational purposes only and should not be considered trading advice.
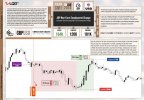
 

Daniel LQDFX

Trader
Jul 21, 2023
126
0
22
43

Daily News Update


28 February 2024​

Wednesday​

This Wednesday, the financial calendar is marked by significant announcements from three major economies. Australia is set to unveil its year-over-year Consumer Price Index (CPI), a key indicator of inflationary pressures within the economy. In parallel, New Zealand will disclose its Official Cash Rate, a critical decision that will provide insights into the central bank's monetary policy stance. Meanwhile, the United States will release its preliminary quarterly Gross Domestic Product (GDP) figures, offering a snapshot of economic growth and health. These releases are poised to capture the attention of investors and policymakers worldwide, given their potential implications for global financial markets.​



AUD – CPI y/y​

This measure tracks the monthly change in consumer prices for goods and services, a key indicator of inflation that significantly influences overall economic conditions. Released approximately 25 days following the end of each month, it reflects the average price changes of a diverse set of products and services when compared to their previous assessments. Given inflation's critical role in currency valuation, increases in consumer prices prompt central banks to adjust interest rates in line with their mandate to manage inflation.

The monthly Consumer Price Index (CPI) indicator in Australia had increased by 3.4% in the year to December 2023, down from 4.3% in November and below market forecasts of 3.7%. It marked the third consecutive month of moderation in annual inflation, with the latest reading being the lowest since November 2021, amid a slowdown in food prices (4.0% vs 4.6% in November) and housing (5.2% vs 6.6%), particularly electricity, gas, and other household fuels. Additionally, the cost had slowed for health (4.7% vs 5.2%), while transport inflation remained steady (at 3.6%) amid faster rises in automotive fuel. At the same time, prices had fallen for recreation and culture (-2.4% vs 1.2%), furnishings, household equipment & services (-0.3% vs -0.3%), and clothing and footwear (-0.8% vs -0.9%). The monthly CPI indicator, excluding volatile items and travel, had risen by 4.2% in December, down from a 4.8% gain in November. Inflation was outside the RBA's target range of 2-3%.

TL;DR
AUD – CPI y.y.png
The forecast for the CPI y/y suggests a modest rise to 3.5% from the earlier figure of 3.4%.

The upcoming announcement for the CPI y/y is set to be released at 12:30 AM GMT on Wednesday the 28th.

The last time, Australian CPI y/y was announced on the 31st of January, 2024. You may find the market reaction chart (AUDNZD M5) below:
31-01-2024-CPI-yy-AUD-N.jpg

NZD - Official Cash Rate​

This measure reflects the interest rate at which banks lend balances maintained at the Reserve Bank of New Zealand (RBNZ) to other banks overnight, with decisions on the rate made seven times annually. Although the rate decision often gets anticipated by the market, its significance is generally eclipsed by the RBNZ Rate Statement, which offers insights into future monetary policy. Short-term interest rates are crucial for currency valuation, with traders primarily analyzing various indicators to forecast potential rate adjustments. The RBNZ Governor, in consultation with senior bank staff and external advisors, determines the setting of this rate.
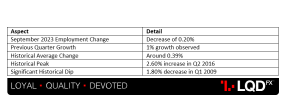
During its November meeting, the Reserve Bank of New Zealand had kept its official cash rate (OCR) unchanged at 5.5%, maintaining the rate pause for the fourth consecutive meeting and aligning with market expectations. The board had remained confident that the prevailing OCR level was restrictive enough to curb demand. Despite this, concerns were raised over persistent excess demand and cost pressures amidst high core inflation. The committee had concurred that interest rates would need to remain at a restrictive level for an extended period to return inflation to the target range of 1 to 3% and to support sustainable employment. While predicting a peak cash rate of 5.7%, policymakers had indicated the need to await further data to gauge the pace and magnitude of the reduction in domestic capacity pressures. The RBNZ had acknowledged a slowdown in parts of the economy, yet noted a smaller decline in total demand growth than had been anticipated earlier in the year. Meanwhile, members had considered that monetary policy was conducive to sustaining house prices.
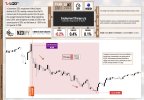
TL;DR
NZD - Official Cash Rate.png
The projection for the Official Cash Rate suggests it will hold steady, matching the prior rate of 5.5%.

The decision on the Official Cash Rate is scheduled to be announced at 1:00 AM GMT on Wednesday the 28th.

The last time, the New Zealand Official Cash Rate was announced on the 29th of November, 2023. You may find the market reaction chart (NZDJPY M5) below:

29-11-2023-Official-Cash-Rate-NZD-N.jpg

USD - Prelim GDP q/q​

This indicator represents the annualized change in the total value of all goods and services produced by the economy, disclosed quarterly approximately 60 days following the quarter's conclusion. Although the data is quarter-over-quarter, it is presented in an annualized format by multiplying the quarterly change by four. The 'Previous' value corresponds to the 'Actual' figure from the Advance release, leading to seemingly disconnected 'History' data. The GDP data is released in three stages—Advance, Preliminary, and Final—spaced a month apart, with the Advance release typically having the greatest market impact. As the most comprehensive measure of economic activity, it serves as the primary indicator of the economy's health and is also referred to as the GDP Second Release.

In the fourth quarter of 2023, the United States economy experienced a robust expansion, with an annualized growth rate of 3.3%, significantly surpassing the anticipated 2% increase and following a 4.9% growth in the third quarter, as per the advance estimate. Despite a deceleration in consumer spending to 2.8% from 3.1% in the previous quarter, with a notable slowdown in goods consumption to 3.8% from 4.9%, the services sector saw a marginal uptick in growth to 2.4% from 2.2%, propelled by enhanced activity in food services, accommodations, and healthcare. The contribution of private inventories to the overall growth diminished to 0.07 percentage points, down from 1.27 percentage points in the third quarter, while government expenditure grew at a reduced rate of 3.3% compared to 5.8% previously. In contrast, exports experienced an acceleration to 6.3% from 5.4%, and the increase in imports moderated to 1.9% from 4.2%. Delving deeper, non-residential investment witnessed a more substantial rise of 1.9% versus 1.4%, buoyed by a rebound in equipment investment to 1% from a previous decline of 4.4%, and an advancement in intellectual property products investment to 2.1% from 1.8%, although investment in structures saw a tempering to 3.2% from 11.2%. Meanwhile, residential investment maintained its growth trajectory, albeit at a diminished pace. For the entirety of 2023, the US economy expanded by 2.5%, a slight improvement over the 1.9% growth observed in 2022 and marginally below the Federal Reserve's forecast of 2.6%.

TL;DR
USD - Prelim GDP q.q.png
The preliminary forecast for the Preliminary GDP q/q is projected at 3.3%.

The upcoming Preliminary GDP q/q is scheduled for release at 1:30 PM GMT on Wednesday the 28th.

The last time, the US Preliminary GDP q/q was announced on the 29th of November, 2023. You may find the market reaction chart (USDJPY M5) below:


29-11-2023-Prelim-GDP-qq-USD-N.jpg


Disclaimer: The market news provided herein is for informational purposes only and should not be considered trading advice.