1st November 2024
Friday
Friday
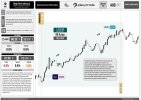
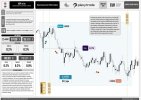
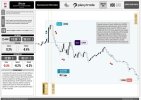
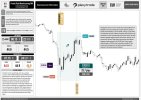
On November 1st, several high-impact news releases are scheduled. Switzerland will kick off with the release of its monthly Consumer Price Index (CPI). Following this, the United States will release several key economic indicators, including Average Hourly Earnings (month-over-month), Non-Farm Employment Change, Unemployment Rate, and ISM Manufacturing PMI. Each of these announcements is expected to significantly influence market movements.
CHF – CPI m/m
The Consumer Price Index (CPI) measures the change in the price of goods and services purchased by consumers, with its monthly release occurring approximately three days after the end of the month. This indicator is crucial for currency valuation, as a CPI reading that exceeds forecasts typically signals favorable conditions for the currency. Consumer prices are a significant component of overall inflation, which in turn influences central bank policies; rising inflation often prompts the central bank to increase interest rates to maintain price stability. CPI is derived by sampling and comparing the average prices of a variety of goods and services from one period to the next.
In September 2024, Switzerland's consumer price index (CPI) fell by 0.3% compared to the previous month, reaching 107.2 points, according to the Swiss Federal Statistical Office (FSO). This marks a +0.8% increase compared to the same month in 2023. The decline in prices was largely driven by reductions in international package holidays, air transport, and fuel costs such as petrol, heating oil, and diesel. On the other hand, prices for clothing, footwear, and certain fresh produce, like berries and fruiting vegetables, saw an increase. Core inflation, which excludes volatile components like fresh products and energy, decreased by 0.2% from the previous month but rose by 1.0% year-over-year.
In September 2024, Switzerland's consumer price index (CPI) fell by 0.3% compared to the previous month, reaching 107.2 points, according to the Swiss Federal Statistical Office (FSO). This marks a +0.8% increase compared to the same month in 2023. The decline in prices was largely driven by reductions in international package holidays, air transport, and fuel costs such as petrol, heating oil, and diesel. On the other hand, prices for clothing, footwear, and certain fresh produce, like berries and fruiting vegetables, saw an increase. Core inflation, which excludes volatile components like fresh products and energy, decreased by 0.2% from the previous month but rose by 1.0% year-over-year.
TL;DR
- Switzerland's Consumer Price Index (CPI) for September 2024:
- Monthly change: -0.3%
- Yearly change: +0.8%
- CPI Value: 107.2 points
- Main drivers of price decline:
- Lower costs for international package holidays, air transport, and fuel (petrol, heating oil, diesel)
- Price increases observed in:
- Clothing, footwear, and certain fresh produce (berries, fruiting vegetables)
- Core Inflation:
- Monthly change: -0.2%
- Yearly change: +1.0%
- Excludes volatile items such as fresh produce and energy
The forecast shows 0.0%, an improvement from the previous -0.3% result.
The upcoming CPI m/m is set to be released on Friday at 7:30 AM GMT.

USD - Average Hourly Earnings m/m
The Average Hourly Earnings m/m indicator measures the change in wages that businesses pay for labor, excluding the farming sector. If the 'Actual' figure exceeds the 'Forecast,' it generally benefits the currency. Traders pay close attention to this indicator because it acts as a leading indicator of consumer inflation; when businesses face higher labor costs, these increased expenses are often passed on to consumers in the form of higher prices.
In September, average hourly earnings for all employees on private nonfarm payrolls rose by 13 cents, or 0.4%, reaching $35.36, according to the U.S. Bureau of Labor Statistics. Over the past year, wages have increased by 4.0%, reflecting steady growth in earnings amid broader job gains. Average hourly earnings for private-sector production and nonsupervisory employees also saw a rise of 8 cents, or 0.3%, bringing the average to $30.33. These wage increases come as total nonfarm payroll employment grew by 254,000, and the labor market remained resilient.
In September, average hourly earnings for all employees on private nonfarm payrolls rose by 13 cents, or 0.4%, reaching $35.36, according to the U.S. Bureau of Labor Statistics. Over the past year, wages have increased by 4.0%, reflecting steady growth in earnings amid broader job gains. Average hourly earnings for private-sector production and nonsupervisory employees also saw a rise of 8 cents, or 0.3%, bringing the average to $30.33. These wage increases come as total nonfarm payroll employment grew by 254,000, and the labor market remained resilient.
TL;DR
- Average hourly earnings for all private nonfarm employees rose by 13 cents (0.4%) to $35.36.
- Wages for all employees have increased by 4.0% over the past year.
- Average hourly earnings for private-sector production and nonsupervisory employees increased by 8 cents (0.3%) to $30.33.
- Total nonfarm payroll employment grew by 254,000 jobs.
- The labor market remains resilient amid these gains.
The forecast indicates 0.3%, slightly down from the previous 0.4% result.

USD - Non-Farm Employment Change
The Non-Farm Employment Change measures the change in the number of employed individuals in the economy during the previous month, excluding those in the farming sector. This indicator is crucial for currency traders because a higher-than-expected 'actual' figure compared to the 'forecast' typically signals a positive economic outlook, leading to currency appreciation. Job creation is a key leading indicator of consumer spending, which drives a significant portion of overall economic activity. Thus, strong employment figures often suggest a robust economy and can influence currency values accordingly.
In September, the U.S. added 254,000 jobs, surpassing economist expectations of 140,000, and the unemployment rate fell to 4.1%. The Labor Department’s report, released just weeks before the election, was touted by President Biden as evidence of a strong economy, with 16 million jobs created under his administration. Wages were also reported to be growing faster than prices, while inflation and interest rates continued to decline. The report followed the Federal Reserve's first interest rate cut in over two years, with economists predicting a measured approach to future cuts. Additionally, revisions showed upward adjustments to July and August job figures. Despite earlier signs of labor market weakening, analysts noted the job market was "firming up," calming fears of an economic downturn.
In September, the U.S. added 254,000 jobs, surpassing economist expectations of 140,000, and the unemployment rate fell to 4.1%. The Labor Department’s report, released just weeks before the election, was touted by President Biden as evidence of a strong economy, with 16 million jobs created under his administration. Wages were also reported to be growing faster than prices, while inflation and interest rates continued to decline. The report followed the Federal Reserve's first interest rate cut in over two years, with economists predicting a measured approach to future cuts. Additionally, revisions showed upward adjustments to July and August job figures. Despite earlier signs of labor market weakening, analysts noted the job market was "firming up," calming fears of an economic downturn.
TL;DR
| Key Metric | Details |
|---|
| Jobs Added (September) | 254,000 (exceeded expectation of 140,000) |
| Unemployment Rate | 4.1% |
| Jobs Created (under Biden) | 16 million |
| Wage Growth | Growing faster than prices |
| Inflation | Declining |
| Interest Rates | Declining, with recent Federal Reserve cut |
| Federal Reserve's Rate Cut | First in over two years |
| Job Revisions (July & August) | Upward adjustments |
| Labor Market Commentary | "Firming up," calming recession concerns |
| Analysts' Outlook | Measured approach to future rate cuts |
The forecast predicts 108,000, down from the previous outcome of 254,000.

USD - Unemployment Rate
The unemployment rate measures the percentage of the workforce that is unemployed and actively seeking employment over the previous month. When the actual rate is lower than the forecasted rate, it is generally positive for the currency. Traders pay close attention to this figure because, despite being a lagging indicator, it reflects overall economic health and is closely linked to consumer spending. Additionally, the unemployment rate is crucial for shaping monetary policy, making it a key concern for policymakers and investors alike.
In September, the U.S. unemployment rate remained steady at 4.1%, with 6.8 million people unemployed, reflecting little change from the previous month. However, these figures are higher than a year ago when the unemployment rate was 3.8% and 6.3 million were unemployed. The unemployment rate for adult men decreased to 3.7%, while rates for adult women, teenagers, and various racial and ethnic groups showed little or no change. Additionally, the number of people unemployed for less than five weeks decreased by 322,000, while long-term unemployment remained steady at 1.6 million, accounting for 23.7% of the unemployed population. Labor force participation and the employment-population ratio also showed minimal movement.
In September, the U.S. unemployment rate remained steady at 4.1%, with 6.8 million people unemployed, reflecting little change from the previous month. However, these figures are higher than a year ago when the unemployment rate was 3.8% and 6.3 million were unemployed. The unemployment rate for adult men decreased to 3.7%, while rates for adult women, teenagers, and various racial and ethnic groups showed little or no change. Additionally, the number of people unemployed for less than five weeks decreased by 322,000, while long-term unemployment remained steady at 1.6 million, accounting for 23.7% of the unemployed population. Labor force participation and the employment-population ratio also showed minimal movement.
TL;DR
- Unemployment Rate: 4.1% in September, unchanged from the previous month but higher than 3.8% a year ago.
- Total Unemployed: 6.8 million people, similar to the previous month but up from 6.3 million a year ago.
- Adult Men Unemployment Rate: Decreased to 3.7%.
- Other Groups (Women, Teens, Racial/Ethnic Groups): Little or no change in unemployment rates.
- Short-term Unemployed (<5 weeks): Decreased by 322,000.
- Long-term Unemployed (≥27 weeks): Remained steady at 1.6 million, representing 23.7% of the unemployed.
- Labor Force Participation & Employment-Population Ratio: Showed minimal movement.
The forecast indicates 4.1%, matching the previous result.
The upcoming Average Hourly Earnings m/m, Non-Farm Employment Change & Unemployment Rate is set to be released on Friday at 12:30 PM GMT.

USD - ISM Manufacturing PMI
The ISM Manufacturing PMI, also known as the Manufacturing ISM Report On Business, is a diffusion index based on a survey of approximately 300 purchasing managers in the manufacturing sector, and it measures the level of business conditions such as employment, production, new orders, prices, supplier deliveries, and inventories; a reading above 50.0 indicates industry expansion and is favorable for currency if it surpasses forecasts, as it serves as a leading indicator of economic health due to the purchasing managers' up-to-date insights into their company's view of the economy.
In September 2024, U.S. manufacturing continued to contract for the sixth consecutive month, with the Manufacturing PMI holding steady at 47.2%, unchanged from August, according to the ISM report. Key indicators such as new orders, production, employment, & order backlogs remained in negative territory. The New Orders Index rose slightly to 46.1%, while production improved but stayed below the 50% growth threshold at 49.8%. Employment saw a sharper decline, dropping to 43.9%, as companies adjusted staffing to match reduced demand. Inventories shrank significantly, with the Inventories Index falling to 43.9%, down 6.4 percentage points from August. Supplier deliveries slowed, while exports & imports both contracted, reflecting continued weakness in international markets, with the New Export Orders Index declining to 45.3%. Notably, input costs decreased for the first time in eight months, as the Prices Index dropped to 48.3%, signaling lower prices for key commodities like steel, aluminum, & crude oil. The report highlighted economic uncertainty due to high interest rates & the upcoming U.S. elections, which discouraged companies from making significant investments in capital or inventory. Only the Food, Beverage & Tobacco Products sector showed growth, while other industries, including chemical products, machinery, & fabricated metals, remained in contraction. Overall, 77% of the manufacturing GDP saw a decline, with the share of GDP registering a PMI below 45% increasing from 33% in August to 41% in September, underscoring widespread challenges in the sector.
In September 2024, U.S. manufacturing continued to contract for the sixth consecutive month, with the Manufacturing PMI holding steady at 47.2%, unchanged from August, according to the ISM report. Key indicators such as new orders, production, employment, & order backlogs remained in negative territory. The New Orders Index rose slightly to 46.1%, while production improved but stayed below the 50% growth threshold at 49.8%. Employment saw a sharper decline, dropping to 43.9%, as companies adjusted staffing to match reduced demand. Inventories shrank significantly, with the Inventories Index falling to 43.9%, down 6.4 percentage points from August. Supplier deliveries slowed, while exports & imports both contracted, reflecting continued weakness in international markets, with the New Export Orders Index declining to 45.3%. Notably, input costs decreased for the first time in eight months, as the Prices Index dropped to 48.3%, signaling lower prices for key commodities like steel, aluminum, & crude oil. The report highlighted economic uncertainty due to high interest rates & the upcoming U.S. elections, which discouraged companies from making significant investments in capital or inventory. Only the Food, Beverage & Tobacco Products sector showed growth, while other industries, including chemical products, machinery, & fabricated metals, remained in contraction. Overall, 77% of the manufacturing GDP saw a decline, with the share of GDP registering a PMI below 45% increasing from 33% in August to 41% in September, underscoring widespread challenges in the sector.
TL;DR
- Manufacturing PMI: Held steady at 47.2%, marking six consecutive months of contraction.
- New Orders Index: Rose slightly to 46.1% but remained in contraction.
- Production Index: Improved to 49.8% yet stayed below the growth threshold (50%).
- Employment Index: Dropped to 43.9%, indicating sharper reductions in staffing due to lower demand.
- Inventories Index: Fell significantly to 43.9%, down 6.4 points from August, showing reduced stock levels.
- Supplier Deliveries: Slowed, pointing to reduced demand.
- New Export Orders Index: Declined to 45.3%, reflecting ongoing weakness in international markets.
- Imports: Contracted, reinforcing global demand challenges.
- Prices Index: Decreased to 48.3%, marking the first drop in input costs in eight months, notably for steel, aluminum, and crude oil.
- Economic Uncertainty: High interest rates and the upcoming U.S. elections deterred investment in capital and inventory.
- Growing Sector: Only the Food, Beverage & Tobacco sector showed growth.
- Sectors in Contraction: Chemical products, machinery, and fabricated metals remained in contraction.
- Manufacturing GDP Impact: 77% of manufacturing GDP was in decline, with the share of GDP under a PMI of 45% rising from 33% in August to 41% in September.
The forecast indicates 47.6 compared to previous 47.2 outcome.
The next ISM Manufacturing PMI is scheduled for release on Friday at 2:00 PM GMT.


