News Announcement & Chart Analysis by PlexyTrade

Apr 16, 2024
94
0
7
44
25th September 2024

Wednesday


Australia is set to release its year-over-year Consumer Price Index (CPI) on Wednesday. This key economic indicator will provide insights into the country's inflation rate, which has been a major concern for policymakers and consumers alike. Investors and analysts will be closely watching the CPI data to gauge the effectiveness of the Reserve Bank of Australia's monetary policy measures.


AUD - CPI y/y

The Consumer Price Index (CPI) Year-over-Year measures the change in the price of goods and services purchased by consumers. When the actual CPI figure exceeds the forecasted value, it is generally advantageous for the currency. This is because consumer prices significantly impact overall inflation, which in turn affects currency valuation. Rising inflation typically prompts the central bank to raise interest rates to manage inflationary pressures. The CPI is calculated by sampling the average prices of a range of goods and services and comparing these to prices from a previous period.


In July 2024, Australia's annual Consumer Price Index (CPI) growth moderated to 3.5%, down from 3.8% in June and slightly above forecasts of 3.4%. This marks the lowest inflation rate since March, primarily influenced by substantial reductions in electricity costs due to the new Commonwealth and state energy rebates. Notably, the annual rise in housing prices slowed to 4.0%, with significant impacts from the reduced electricity prices. While food inflation saw an uptick to 3.8%, driven by sharp increases in fruit and vegetable prices, other sectors like transport showed a deceleration in cost increases. Excluding volatile items and holiday travel, the CPI rose by 3.7%, the smallest increase since January 2022, signaling a mild easing in underlying inflation pressures yet remaining above the Reserve Bank of Australia’s target range of 2-3%.​

TL;DR

CategoryDetails
Overall CPI Growth (July 2024)3.5% (down from 3.8% in June)
Forecasted CPI Growth3.4%
Lowest Inflation SinceMarch 2024
Main Driver of Inflation ReductionSubstantial reductions in electricity costs
Electricity Cost ImpactReduced due to Commonwealth and state energy rebates
Annual Housing Price Increase4.0% (impacted by reduced electricity costs)
Food Inflation3.8% (driven by increases in fruit and vegetable prices)
Transport Cost GrowthDecelerated
Underlying CPI (Excluding Volatile Items)3.7% (smallest increase since January 2022)
RBA Target CPI Range2-3%

The forecast for Australia’s CPI y/y stands at 2.7% compared to previous 3.5% outcome.

The next CPI year-over-year (y/y) data will be released on Wednesday at 1:30 AM GMT.
 
Apr 16, 2024
94
0
7
44
26th September 2024

Thursday


A significant economic data release day is on the horizon. On Thursday, both Switzerland and the United States will unveil crucial figures. Switzerland's National Bank will announce its policy interest rate, which could have a major impact on the country's financial markets. Meanwhile, the United States will release its final GDP growth rate for the previous quarter and the latest unemployment claims data. These figures will provide valuable insights into the health of both economies and are likely to influence investor sentiment and market movements.


CHF – SNB Policy Rate

Traders closely watch the Swiss National Bank's (SNB) policy rate, as short-term interest rates are crucial for currency valuation. If the actual rate is higher than forecasted, it's positive for the currency. The SNB Governing Board sets the policy rate based on consensus, which is why traders focus on it to predict future rate changes.


The Swiss National Bank (SNB) announced on June 20, 2024, a reduction in its policy rate by 0.25 percentage points, bringing it down to 1.25%, effective June 21. This move is aimed at maintaining appropriate monetary conditions amidst decreasing inflationary pressure. The SNB will also remunerate banks’ sight deposits at this new rate up to a certain threshold, with excess deposits earning 0.75% more. The decision follows a slight rise in inflation to 1.4% in May, driven by higher rents, tourism services, and oil prices, although overall inflation remains within the stability range. The SNB forecasts average annual inflation at 1.3% for 2024, 1.1% for 2025, and 1.0% for 2026, assuming the policy rate stays at 1.25%. Despite solid global economic growth in early 2024, inflation remains above targets in many countries, prompting some central banks to ease monetary policies while maintaining restrictive stances. The SNB expects moderate Swiss GDP growth of around 1% in 2024, rising to 1.5% in 2025, with slight increases in unemployment and normal production capacity utilization. However, significant global economic risks persist, including prolonged inflation and geopolitical tensions, which could impact economic activity. The real estate market shows weaker momentum, yet vulnerabilities remain.​

TL;DR

CategoryDetails
SNB Policy RateReduced by 0.25 percentage points to 1.25%, effective June 21, 2024.
PurposeMaintain appropriate monetary conditions amidst decreasing inflationary pressure.
Remuneration on DepositsBanks’ sight deposits remunerated at 1.25% (up to a threshold), excess deposits earn 0.75% more.
Inflation (May 2024)Increased to 1.4%, driven by higher rents, tourism services, and oil prices.
Inflation Forecasts2024: 1.3%, 2025: 1.1%, 2026: 1.0%. Assumes policy rate remains at 1.25%.
Global Economic GrowthSolid in early 2024, but inflation remains above targets in many countries.
Swiss GDP Growth Forecast2024: ~1%, 2025: 1.5%.
UnemploymentExpected slight increases.
Production CapacityNormal utilization expected.
Global Economic RisksProlonged inflation and geopolitical tensions could impact global economic activity.
Real Estate MarketWeaker momentum, but vulnerabilities remain.

The SNB Policy Rate forecast is projected at 1.00%, down from the previous rate of 1.25%.

The upcoming Interest Rate decision is set to be released on Thursday at 7:30 AM GMT.
26-09-20-06-SNB-Policy-Rate-CHF.jpg


CHF - SNB Press Conference

The Swiss National Bank (SNB) press conference, led by the SNB Chairman and Governing Board members, is held quarterly and is a key communication tool for conveying monetary policy and economic outlook. A more hawkish stance than expected is generally positive for the currency, making the conference a critical event for traders assessing future policy direction.

The SNB Press Conference is scheduled to start on Thursday at 8:00 AM GMT.


USD - Final GDP q/q

The Final GDP q/q measures the annualized change in the inflation-adjusted value of all goods and services produced by the economy. Traders monitor this indicator closely as it is the broadest measure of economic activity and serves as the primary gauge of the economy's health.


In the second quarter of 2024, the U.S. real GDP grew at an annual rate of 3.0%, a rise from the previously estimated 2.8% and a notable increase from the 1.4% recorded in the first quarter. The revision up was largely attributed to stronger consumer spending, which was adjusted to 2.9% from 2.3%. Other factors contributing to growth included private inventory investment, which surged to 7.5% from 4.4%, and nonresidential fixed investment, which increased to 4.6% from 4.4%. Despite these gains, the revised figures also showed downward adjustments: nonresidential fixed investment was lowered to 4.6% from 5.2%, exports decreased to 1.6% from 2%, and private inventory investment was revised down to 7.5% from 8.4%. Government spending at both federal and local levels also saw reductions, while residential fixed investment was adjusted to -2% from -1.4%. Imports were increased to 7% from 6.9%, impacting the overall GDP revision.​

TL;DR
  • Real GDP grew at an annual rate of 3.0% (up from the previous estimate of 2.8%, and a rise from 1.4% in Q1).
  • Consumer spending was revised up to 2.9% (from 2.3%).
  • Private inventory investment surged to 7.5% (from 4.4%).
  • Nonresidential fixed investment revised down slightly to 4.6% (from 5.2%).
  • Exports decreased to 1.6% (from 2.0%).
  • Government spending saw reductions at both federal and local levels.
  • Residential fixed investment was adjusted to -2.0% (from -1.4%).
  • Imports increased to 7.0% (from 6.9%), slightly impacting the overall GDP revision.

The projected quarter-on-quarter GDP growth remains at 3.0%, matching the previous result.

26-09-27-06-Final-GDP-qq-USD.jpg


USD - Unemployment Claims

Initial Jobless Claims track the number of people filing for unemployment benefits for the first time in a week, serving as an early indicator of U.S. economic health. While the impact on the market can vary, a higher than expected number is usually seen as negative for the USD, and a lower than expected number as positive. Traders monitor these figures closely as they reflect labor market conditions, which are directly linked to consumer spending and are crucial for shaping monetary policy.


United States initial jobless claims for the week ending September 14 fell by 12,000 to 219,000, according to a report from the Department of Labor. This figure came in lower than analysts' predictions. The 4-week moving average also decreased by 3,500 to 227,500. The insured unemployment rate stood at 1.2% for the week ending September 7, with insured unemployment dropping by 14,000 to 1,829,000. The 4-week moving average of insured unemployment also declined by 6,500, reaching 1,844,250.​

TL;DR

MetricValue
Initial Jobless Claims (Week Ending Sept 14)219,000 (down 12,000)
Analysts' PredictionsHigher than 219,000
4-Week Moving Average (Initial Claims)227,500 (down 3,500)
Insured Unemployment Rate (Week Ending Sept 7)1.2%
Insured Unemployment (Week Ending Sept 7)1,829,000 (down 14,000)
4-Week Moving Average (Insured Unemployment)1,844,250 (down 6,500)

The forecast for Unemployment Claims is projected at 224,000, up from the previous figure of 219,000.

The upcoming Final GDP q/q & Unemployment Claims is scheduled for release on Thursday at 12:30 PM GMT.

26-09-19-09-Unemployment-Claims-USD.jpg


USD - Fed Chair Powell Speaks

Federal Reserve Chair Jerome Powell is set to deliver pre-recorded opening remarks at the U.S. Treasury Market Conference in New York. As the head of the central bank, Powell holds significant influence over short-term interest rates and the nation's currency value, making his speeches closely watched by traders and financial markets. Market participants will scrutinize his remarks for subtle hints about future monetary policy direction. Should Powell adopt a more hawkish tone than expected, it could boost the U.S. dollar, as traders often interpret such signals as an indication of potential tightening in monetary policy.

The speech is scheduled for Thursday at 1:20 PM GMT.

 
Apr 16, 2024
94
0
7
44
27th September 2024

Friday


Canada and the United States are preparing to release key economic data that could influence market sentiment. Canada will publish its monthly Gross Domestic Product (GDP) figures, providing insight into the country's economic growth. Meanwhile, the U.S. will unveil its Core Personal Consumption Expenditures (PCE) Price Index for the month, a closely watched inflation indicator. Both releases are expected to offer valuable information on the economic conditions in their respective countries.


CAD - GDP m/m

The GDP month-over-month (m/m) measures reflect the change in the inflation-adjusted value of all goods and services produced by the economy. An 'Actual' value that exceeds the 'Forecast' is generally seen as favorable for the currency. Traders pay close attention to this indicator because it is the broadest measure of economic activity and serves as the primary gauge of the overall health of the economy.


Canada's GDP is expected to remain unchanged in July 2024, as gains in the finance, insurance, and retail trade sectors were counterbalanced by declines in construction, mining, quarrying, oil and gas extraction, and wholesale trade. In June 2024, the economy also remained essentially flat, falling short of preliminary estimates and market expectations of a 0.1% growth. Goods-producing industries contracted by 0.4%, driven by notable declines in manufacturing and construction, though this was partially offset by gains in utilities and agriculture. Manufacturing saw its steepest decline since December 2023, with durable goods manufacturing dropping 2.4% due to retooling in the auto sector. The construction sector shrank for the third consecutive month, hitting its lowest point since January 2021, while utilities saw a 2.3% rise, spurred by increased electricity and natural gas distribution. Meanwhile, services-producing industries recorded a modest 0.1% growth, marking their third consecutive month of expansion, supported by real estate, finance, and the public sector.​

TL;DR
  • July 2024 GDP Growth
    • Expected to remain unchanged.
    • Gains in finance, insurance, and retail trade sectors.
    • Declines in construction, mining, quarrying, oil and gas extraction, and wholesale trade.
  • June 2024 GDP Growth
    • Essentially flat; fell short of preliminary estimates (0.1% growth).
  • Goods-Producing Industries
    • Contracted by 0.4%.
    • Notable declines in manufacturing and construction.
    • Gains in utilities and agriculture partially offset losses.
  • Manufacturing Sector
    • Experienced steepest decline since December 2023.
    • Durable goods manufacturing dropped by 2.4% due to retooling in the auto sector.
  • Construction Sector
    • Shrinkage for the third consecutive month.
    • Hit lowest point since January 2021.
  • Utilities Sector
    • Increased by 2.3%, spurred by higher electricity and natural gas distribution.
  • Services-Producing Industries
    • Recorded modest 0.1% growth; third consecutive month of expansion.
    • Supported by real estate, finance, and the public sector.

The forecast for Canada's month-over-month GDP growth is 0.1%, an improvement from the previous result of 0.0%.

The upcoming month-over-month GDP data will be released on Friday at 12:30 PM GMT.

27-09-30-08-GDP-mm-CAD.jpg


USD - Core PCE Price Index m/m

The Core PCE Price Index, excluding food and energy, is the Federal Reserve's main measure of inflation. An increase above forecasts typically strengthens the currency as it prompts the Fed to raise interest rates to control inflation, affecting economic and currency stability. This index is crucial for traders monitoring potential shifts in monetary policy.


In July 2024, the U.S. Core PCE Price Index, the Federal Reserve’s preferred measure for tracking underlying inflation, rose by 0.2% from the previous month, aligning with market expectations and consistent with the increase observed in June. On a year-over-year basis, core PCE climbed by 2.6%, slightly below the forecasted 2.7%, reflecting a continued moderation in inflationary pressures. This trend reinforced the possibility of forthcoming rate cuts by the Federal Reserve, which had been closely monitoring these figures along with other economic indicators ahead of its meeting scheduled for September 17th and 18th.​

TL;DR
  • Core PCE Price Index (July 2024):
    • Increased by 0.2% from the previous month.
    • Growth aligned with market expectations.
  • Year-over-Year Change:
    • Core PCE rose by 2.6%.
    • Slightly below the forecasted 2.7%.
  • Inflationary Pressures:
    • Continued moderation observed in inflation.
  • Federal Reserve Implications:
    • Potential for forthcoming rate cuts.
    • Fed closely monitoring economic indicators.
  • Upcoming Meeting:
    • Scheduled for September 17th and 18th, 2024.

The forecast for Core PCE Price Index m/m stands at 0.2% the same as previous outcome.

The upcoming month-over-month Core PCE Price Index data will be released on Friday at 12:30 PM GMT.

27-09-30-08-Core-PCE-Price-Index-mm-USD.jpg
 
Apr 16, 2024
94
0
7
44
30th September 2024

Monday

On September 30, China is set to release its latest Manufacturing PMI, a key indicator of the country's industrial performance. This data will be followed by the release of Germany's preliminary Consumer Price Index (CPI) for September, measuring inflation on a month-over-month basis. Later in the day, global markets will turn their attention to the United States, where Federal Reserve Chair Jerome Powell is scheduled to speak, with his remarks expected to provide insights into the Fed's stance on monetary policy amid ongoing economic uncertainties.


CNY – Manufacturing PMI

The Manufacturing PMI, based on surveys of 3,000 purchasing managers, measures industry conditions such as employment, production, and new orders. An 'Actual' figure higher than the 'Forecast' benefits the currency, with values above 50 indicating expansion and below 50 indicating contraction. This measure significantly impacts currency markets, especially if released before the Caixin Manufacturing PMI, due to China's global economic influence. Traders use this index as a leading economic indicator since purchasing managers have the most current insights into business conditions.


China's manufacturing sector recorded a decline for the fourth consecutive month in August, with the official manufacturing purchasing managers' index (PMI) falling to 49.1 from 49.4 in July, signaling a persistent contraction in factory activity. This downturn reflects broader economic challenges in the $17 trillion economy, which has been hampered by a prolonged property slump and weak consumer and business spending. Despite efforts by the government, including interest rate cuts, to revitalize economic sentiment, analysts from major financial institutions like UBS and JPMorgan Chase anticipate that China will likely miss its target of approximately 5% GDP growth for the year. Trade tensions, particularly with the US and the European Union, have exacerbated the situation, with new tariffs impacting sectors like the automotive industry. The combination of domestic economic struggles and increasing global trade barriers underscores the need for more aggressive fiscal policies to stabilize China's economic trajectory.​

TL;DR

CategoryDetails
China's Manufacturing PMIDeclined to 49.1 in August from 49.4 in July, indicating a contraction for the fourth consecutive month.
Economic ChallengesImpacted by a prolonged property slump, weak consumer and business spending.
Government EffortsMeasures include interest rate cuts to stimulate economic growth.
Analyst ProjectionsUBS and JPMorgan Chase predict China will miss its target of ~5% GDP growth for the year.
Trade TensionsOngoing tensions with the US and EU, with new tariffs affecting sectors such as the automotive industry.
Global & Domestic ImpactThe combination of domestic economic issues and global trade barriers highlights the need for more aggressive fiscal policies to stabilize the economy.

The forecast for the Manufacturing PMI is 49.5, up from the previous figure of 49.1.

China
is set to release its Manufacturing PMI on September 30th at 1:30 AM GMT.

30-09-31-08-Manufacturing-PMI-CNY.jpg


EUR - German Prelim CPI m/m

The German Preliminary CPI m/m, issued monthly by Destatis, tracks the change in consumer prices for household goods and services. This measure is crucial for assessing inflation and shifts in consumer spending. A rise in the CPI suggests increasing prices, which can prompt the central bank to hike interest rates to control inflation. Such increases are generally seen as positive for the Euro, as they indicate economic stability and growth, with a higher CPI being bullish for the currency and a lower one being bearish.


In August 2024, Germany's annual inflation rate dropped to 1.9%, marking its lowest level since March 2021 and falling below the anticipated 2.1%. This decline from July's rate of 2.3% was highlighted in preliminary estimates. The Consumer Price Index (CPI) saw a slight reduction of 0.1% from the previous month, defying expectations of a 0.0% rise. The EU-harmonised CPI also decreased to 2.0% year-on-year, falling short of the forecasted 2.3%, and dipped by 0.2% on a monthly basis. Historically, Germany's monthly inflation rate has averaged 0.21%, with significant fluctuations over the years.​

TL;DR
  • Germany's annual inflation rate dropped to 1.9% in August 2024, the lowest since March 2021.
  • The inflation rate was lower than the anticipated 2.1%.
  • The rate fell from 2.3% in July 2024.
  • Preliminary estimates showed the Consumer Price Index (CPI) declined by 0.1% from the previous month, while a 0.0% rise was expected.
  • The EU-harmonised CPI decreased to 2.0% year-on-year, below the forecast of 2.3%.
  • The EU-harmonised CPI also dropped by 0.2% on a monthly basis.
  • Historically, Germany's monthly inflation rate has averaged 0.21% with fluctuations.

The projected CPI month-over-month is -0.1%, matching the previous result.

The upcoming CPI m/m will be released on Monday at 12:00 PM GMT.

30-09-29-08-German-Prelim-CPI-mm-EUR.jpg


USD - Fed Chair Powell Speaks

Federal Reserve Chair Jerome Powell is scheduled to participate in a moderated discussion titled "A View from the Federal Reserve Board" at the National Association for Business Economics Annual Meeting in Nashville. As the head of the central bank, which controls short-term interest rates, Powell has more influence over the nation's currency value than any other individual. Traders closely follow his public engagements, as they often provide subtle clues about future monetary policy. A more hawkish tone than expected in his remarks is generally positive for the currency.​

Fed Chair Jerome Powell's speech is scheduled for Monday at 5:00 PM GMT.
 
Apr 16, 2024
94
0
7
44
1st October

Tuesday


This coming Tuesday, the Eurozone will release its Core CPI flash estimate (y/y) and CPI flash estimate (y/y). Later, key data from the U.S. will follow, including the ISM Manufacturing PMI and JOLTS job openings figures, both of which are expected to have a significant market impact.


EUR - Core CPI Flash Estimate y/y

The Core CPI Flash Estimate y/y tracks changes in the prices of goods and services, excluding food, energy, alcohol, and tobacco. If the actual data exceeds forecasts, it is typically favorable for the currency. Traders closely monitor this measure because it reflects underlying inflation trends. Rising consumer prices can lead central banks to raise interest rates to combat inflation, which in turn can impact currency valuation.


Euro zone inflation, measured by the CPI Flash Estimate, dropped to 2.2% in August, its lowest in three years, down from 2.6% in July. This decline, driven by lower energy costs, aligns with expectations and moves inflation closer to the ECB's 2% target after years of exceeding it. Despite this, core inflation, excluding volatile food and energy prices, only slightly eased to 2.8%, with services inflation rising to 4.2%. The impact of the Paris Olympics on services costs, particularly in France, contributed to this increase. The 2.2% outcome strengthens the case for a widely expected ECB interest rate cut in September, although concerns over wage growth, especially in the services sector, remain a key issue for policymakers.​

The forecast for Core CPI Flash Estimate stands at 2.7% compared to previous 2.8% outcome.


EUR - CPI Flash Estimate y/y

The CPI Flash Estimate (y/y) measures the annual change in consumer prices for goods and services. If the actual CPI figure exceeds forecasts, it is typically seen as favorable for the currency. Traders focus on this indicator because rising consumer prices can lead to higher inflation, which often prompts central banks to raise interest rates to manage inflation. Consequently, higher interest rates can strengthen the currency, making this data crucial for currency valuation.


Euro zone core inflation, measured by the Core CPI Flash Estimate, eased slightly to 2.8% in August from 2.9% in July, aligning with expectations. While this drop reflects muted imported goods prices, services inflation surged to 4.2%, partly due to the temporary impact of the Paris Olympics on French services costs. This rise in services inflation underscores ongoing concerns among European Central Bank (ECB) policymakers about rapid wage growth in the sector, despite overall inflation slowing to 2.2%. The persistent strength in core inflation, particularly in services, supports the case for an anticipated ECB interest rate cut in September, although further easing may depend on how wage pressures evolve.​

The projected CPI Flash Estimate year-over-year stands at 1.9%, down from the previous result of 2.2%.

The upcoming Core CPI Flash Estimate year-over-year and CPI Flash Estimate year-over-year will be released on Tuesday at 9:00 AM GMT.


USD - ISM Manufacturing PMI

The ISM Manufacturing PMI, also known as the Manufacturing ISM Report On Business, is a diffusion index based on a survey of approximately 300 purchasing managers in the manufacturing sector, and it measures the level of business conditions such as employment, production, new orders, prices, supplier deliveries, and inventories; a reading above 50.0 indicates industry expansion and is favorable for currency if it surpasses forecasts, as it serves as a leading indicator of economic health due to the purchasing managers' up-to-date insights into their company's view of the economy.


In August 2024, U.S. manufacturing activity contracted for the fifth consecutive month, with the Manufacturing PMI slightly rising to 47.2 percent, according to the ISM Report On Business. New orders and production continued to decline, with the New Orders Index falling to 44.6 percent, its lowest in several months. Supplier deliveries slowed, and inventories increased, indicating ongoing challenges in the supply chain. Despite the overall contraction, some sectors such as Food, Beverage & Tobacco Products, and Computer & Electronic Products reported growth. Economic concerns, influenced by federal monetary policy and election uncertainty, continued to restrain new investments in capital and inventory. Additionally, prices for raw materials rose, contributing to ongoing inflation pressures in the sector.​

TL;DR

CategoryDetails
Manufacturing PMI47.2% (Contraction for the fifth consecutive month)
New Orders Index44.6% (Declining, lowest in several months)
ProductionContinued decline
Supplier DeliveriesSlowed
InventoriesIncreased
Sectors with GrowthFood, Beverage & Tobacco Products; Computer & Electronic Products
Economic ConcernsFederal monetary policy, election uncertainty affecting investment
Raw Material PricesIncreased, contributing to inflation pressures

The forecast for the upcoming ISM Manufacturing PMI stands at 48.3, indicating a potential improvement compared to the previous reading of 47.2.

01-10-03-09-ISM-Manufacturing-PMI-USD.jpg


USD - JOLTS Job Openings

The JOLTS Job Openings report measures the number of job openings during the reported month, excluding the farming industry; an 'Actual' figure greater than the 'Forecast' is positive for the currency because job creation is a crucial leading indicator of consumer spending, which constitutes a significant portion of overall economic activity.


In July, the U.S. job market remained robust with 7.7 million job openings and 5.5 million hires, as reported by the Bureau of Labor Statistics. While the figures were largely unchanged from the previous month, they reflect a slight annual decline in job openings. Total separations rose to 5.4 million, an increase driven notably by the health care sector. The quit rate stayed constant at 3.3 million, suggesting steady employee confidence in job mobility. Layoffs and discharges were also consistent with previous reports. Noteworthy fluctuations included a drop in openings within transportation and gains in professional services and federal jobs. Additionally, revisions for June saw job openings decrease to 7.9 million, hires to 5.2 million, and quits reduced to 3.2 million, indicating slight recalibrations in the labor market's recovery trajectory.​

TL;DR

· U.S. job market in July remained strong with 7.7 million job openings and 5.5 million hires.

· Job openings showed a slight annual decline, despite being stable month-over-month.

· Total separations rose to 5.4 million, driven by increases in the health care sector.

· The quit rate remained constant at 3.3 million, indicating steady worker confidence in job mobility.

· Layoffs and discharges were consistent with previous months.

· Notable fluctuations:
  • Decline in job openings in transportation.
  • Increase in professional services and federal jobs.
· Revisions for June:
  • Job openings adjusted down to 7.9 million.
  • Hires revised to 5.2 million.
  • Quits reduced to 3.2 million, showing minor recalibrations in labor market recovery.

The JOLTS Job Openings forecast is 7.65 million, slightly down from the previous figure of 7.673 million.

The ISM Manufacturing report and JOLTS Job Openings data are scheduled for release on Tuesday at 2:00 PM GMT.

01-10-04-09-JOLTS-Job-Openings-USD.jpg
 
Apr 16, 2024
94
0
7
44
2nd October 2024

Wednesday


On October 2nd, the U.S. will release its ADP Non-Farm Employment Change report, a key indicator of private sector employment growth. This report, which tracks changes in the number of employed people in the U.S. private sector, excluding farms, is highly anticipated by market analysts and investors. The data is expected to influence financial markets, as it provides insights into the state of the labor market and broader economic health. Any significant deviation from expectations could lead to volatility in stocks, bonds, and currency markets, as traders adjust their strategies in response to the employment data.


USD - ADP - Non - Farm Employment Change

The ADP Non-Farm Employment Change estimates the monthly change in employment numbers, excluding the agriculture sector and government employees. Generally, if the actual data surpasses the forecast, it positively influences the currency. This metric is closely watched by traders because job creation serves as a vital indicator of consumer spending, which significantly drives overall economic activity. The data is derived by analyzing payroll information from over 25 million workers to estimate employment growth.​


In August, U.S. private payrolls rose by just 99,000, the slowest gain since January 2021 and well below the expected 144,000, according to ADP's latest report. This marks a sharp deceleration from July's downwardly revised 111,000 increase and highlights a broader trend of weakening hiring momentum. The labor market, which had surged in the aftermath of the pandemic, is now showing signs of fatigue, with sectors like professional and business services, manufacturing, and information services shedding jobs. In contrast, education and health services, construction, and financial activities posted modest employment gains. Smaller companies (fewer than 50 workers) lost 9,000 jobs, while midsize firms added 68,000. Wage growth slowed slightly, with annual pay rising 4.8%, maintaining the same level as July. The data reinforces expectations that the Federal Reserve may respond by cutting interest rates at its upcoming September meeting, as the labor market slowdown could increase downside risks to the broader economy.​

TL;DR

CategoryDetails
August Private Payrolls99,000 (slowest gain since January 2021)
Expected Payrolls144,000
July Payrolls111,000 (downwardly revised)
Sector Performance- Job Losses: Professional & business services, manufacturing, information services
- Job Gains: Education & health services, construction, financial activities
Company Size Performance- Small companies (<50 workers): -9,000 jobs
- Midsize firms: +68,000 jobs
Wage Growth4.8% annual increase (same as July)
Federal Reserve ImplicationsPotential interest rate cut due to labor market slowdown
Broader Trend
Weakening hiring momentum since post-pandemic surge​

The ADP Non-Farm Employment Change forecast is set at 124,000, up from the previous figure of 99,000.

The upcoming ADP Non-Farm Employment Change is set to be released on Wednesday at 12:15 PM GMT.

02-10-05-09-ADP-Non-Farm-Employment-Change-USD.jpg
 
Apr 16, 2024
94
0
7
44
3rd October 2024

Thursday


This Thursday, market watchers will be focused on key economic data releases, starting with Switzerland's Consumer Price Index (CPI) for the month, which will provide insight into inflationary trends within the Swiss economy. Following that, the United States will release its weekly Unemployment Claims report, shedding light on the state of the labor market. In addition, the ISM Services PMI, a critical measure of the health of the U.S. service sector, will be published, offering further insights into the broader economic outlook. These reports are expected to have a significant impact on market sentiment and economic forecasts.


CHF - CPI m/m

The Consumer Price Index (CPI) measures the change in the price of goods and services purchased by consumers, with its monthly release occurring approximately three days after the end of the month. This indicator is crucial for currency valuation, as a CPI reading that exceeds forecasts typically signals favorable conditions for the currency. Consumer prices are a significant component of overall inflation, which in turn influences central bank policies; rising inflation often prompts the central bank to increase interest rates to maintain price stability. CPI is derived by sampling and comparing the average prices of a variety of goods and services from one period to the next.


In August 2024, the consumer price index (CPI) in Switzerland remained unchanged from the previous month, holding steady at 107.5 points, the Federal Statistical Office (FSO) reported. This stagnation was due to a balance between rising costs for housing rentals and clothing and footwear and falling prices in sectors such as private transport hire, air transport, heating oil, international package holidays, and hotel accommodations. Year-on-year, inflation registered a modest increase of 1.1%. This performance deviated from market expectations, which had anticipated a slight rise of 0.1%, especially following a 0.2% decline in July. Historical data show that since 1950, Switzerland's monthly inflation rate has averaged 0.18%, reaching a peak of 2.10% in November 1973 and a low of -1% in July 2004.​

TL;DR

· August 2024 CPI: Held steady at 107.5 points (unchanged from July).

· Contributing factors:
  • Rising costs: Housing rentals, clothing, and footwear.
  • Falling prices: Private transport hire, air transport, heating oil, international package holidays, and hotel accommodations.
· Year-on-year inflation: Increased by 1.1%.

· Market expectations: A slight rise of 0.1% was expected, but inflation remained unchanged.

· July 2024 CPI: Decreased by 0.2%.

· Historical average inflation rate: 0.18% monthly since 1950.

· Historical peak inflation: 2.10% in November 1973.

· Historical low inflation: -1% in July 2004.


The forecast for CPI m/m stands at -0.1% compared to previous 0.0% outcome.

Switzerland will be releasing its monthly inflation figures on Thursday at 6:30 AM GMT.


USD - Unemployment Claims

Initial Jobless Claims track the number of people filing for unemployment benefits for the first time in a week, serving as an early indicator of U.S. economic health. While the impact on the market can vary, a higher than expected number is usually seen as negative for the USD, and a lower than expected number as positive. Traders monitor these figures closely as they reflect labor market conditions, which are directly linked to consumer spending and are crucial for shaping monetary policy.


The number of Americans filing new applications for unemployment benefits unexpectedly fell by 4,000 last week to a seasonally adjusted 218,000, according to the Labor Department's report for the week ending September 21. Economists had predicted 224,000 claims, but the actual drop signaled continued low layoffs despite a slowdown in the labor market due to declining job openings and a reduction in hiring. Initial claims had largely stabilized after reaching a high of 250,000 in July, although Boeing’s machinists' strike was expected to disrupt employment in the weeks that followed, leading to temporary furloughs across the aerospace giant’s supply chain. Striking workers were ineligible for benefits, but the broader impact on employment remained uncertain. Continuing claims, which served as a proxy for hiring, had risen by 13,000 to 1.834 million for the week ending September 14, though they remained below the 2-1/2-year highs seen in July, which were inflated by temporary policy changes in Minnesota. Despite an increase in the unemployment rate from 3.4% in April to 4.2% in August, the Federal Reserve responded by cutting interest rates by 50 basis points, aiming to maintain labor market stability.​

TL;DR

CategoryDetails
New Unemployment ClaimsFell by 4,000 to 218,000 (week ending Sept 21)
Economists' Prediction224,000 claims
Layoffs TrendContinued low layoffs despite labor market slowdown
July Claims Peak250,000 claims
Boeing Machinists' Strike ImpactExpected to disrupt employment, with temporary furloughs; striking workers ineligible for benefits
Continuing ClaimsRose by 13,000 to 1.834 million (week ending Sept 14)
July Continuing Claims Peak2-1/2-year highs due to Minnesota’s temporary policy changes
Unemployment RateRose from 3.4% (April) to 4.2% (August)
Federal Reserve Response
Cut interest rates by 50 basis points to maintain labor market stability​

The forecast for Unemployment Claims stands at 221,000, up from the previous figure of 218,000.

The upcoming Unemployment Claims will be released on Thursday at 12:30 PM GMT.

03-10-26-09-Unemployment-Claims-USD.jpg


USD - ISM Services PMI

The Non-Manufacturing ISM Report On Business is a monthly index based on surveys from approximately 300 purchasing and supply executives nationwide. It tracks changes in indicators such as Business Activity, New Orders, and Employment, with readings above 50% signaling expansion and below 50% indicating contraction. Given that service orders account for about 90% of the US economy, the report provides crucial insights into economic health and business sentiment, making it a key leading indicator for traders.


In August 2024, the ISM Services PMI recorded a slight increase to 51.5, marking a continuation of growth in the U.S. services sector and indicating expansion for the sixth time within the year. This increment, albeit modest by 0.1 % point from July’s figure of 51.4, underscores ongoing economic resilience across service industries. Key components of the PMI reflected varied performance: the Business Activity Index showed a decrease yet sustained expansion at 53.3 %, while the New Orders Index rose to 53 %, suggesting a solid demand backdrop. Employment growth slightly decelerated as evidenced by a drop in the Employment Index to 50.2 %, although it still pointed to an expanding job market. Contrarily, the Supplier Deliveries Index at 49.6 %t indicated faster deliveries, continuing in contraction. Additionally, the Prices Index ticked up to 57.3 %, and the Inventories Index returned to expansion at 52.9 %, reflecting adjustments in stock levels to align with current business needs. Collectively, these indices portray a services sector that is managing to navigate through economic uncertainties, balancing operational demands with cost and supply chain dynamics.​

TL;DR

· Services PMI: Increased to 51.5 in August from 51.4 in July, marking continued growth in the U.S. services sector for the sixth time this year.

· Business Activity Index: Decreased but remains in expansion at 53.3%.

· New Orders Index: Rose to 53.0%, indicating solid demand.

· Employment Index: Dropped to 50.2%, reflecting slower but still expanding employment growth.

· Supplier Deliveries Index: Fell to 49.6%, indicating faster deliveries and ongoing contraction.

· Prices Index: Increased to 57.3%, reflecting rising prices.

· Inventories Index: Returned to expansion at 52.9%, with adjustments in stock levels to meet business demands.​


The ISM Services PMI forecast is 51.6, slightly lower than the previous result of 51.6.

The upcoming ISM Services PMI is set to be released on Thursday at 2:00 PM GMT.

03-10-05-09-ISM-Services-PMI-USD.jpg
 

Attachments

  • 03-10-03-09-CPI-mm-CHF.jpg
    03-10-03-09-CPI-mm-CHF.jpg
    238 KB · Views: 0
Apr 16, 2024
94
0
7
44
4th October 2024

Friday


On October 4th, the United States is set to release several key economic indicators that are closely watched by markets and policymakers. The data will include the Average Hourly Earnings month-over-month (m/m), Non-Farm Employment Change, and the Unemployment Rate. These figures are critical in assessing the health of the U.S. labor market, with potential implications for monetary policy decisions, inflation, and overall economic growth. Investors and analysts will be paying close attention to these reports as they provide insight into wage growth, job creation, and the broader economic outlook.


USD - Average Hourly Earnings m/m

The Average Hourly Earnings m/m indicator measures the change in wages that businesses pay for labor, excluding the farming sector. If the 'Actual' figure exceeds the 'Forecast,' it generally benefits the currency. Traders pay close attention to this indicator because it acts as a leading indicator of consumer inflation; when businesses face higher labor costs, these increased expenses are often passed on to consumers in the form of higher prices.


In August, average hourly earnings for all private nonfarm employees increased by 14 cents, or 0.4 percent, reaching $35.21, reflecting a 3.8 percent rise over the past year. Private-sector production and nonsupervisory employees saw a similar 0.4 percent increase, with earnings reaching $30.27. The average workweek for all private nonfarm employees edged up to 34.3 hours, while manufacturing overtime increased slightly. These wage and workweek gains came amid slower job growth and an unchanged unemployment rate of 4.2 percent.​

TL;DR

MetricValue
Average Hourly Earnings (All Private Nonfarm Employees)$35.21
Monthly Increase in Hourly Earnings+$0.14 (0.4%)
Year-over-Year Increase in Hourly Earnings+3.8%
Average Hourly Earnings (Private-Sector Production & Nonsupervisory Employees)$30.27
Monthly Increase for Production & Nonsupervisory Employees+0.4%
Average Workweek (All Private Nonfarm Employees)34.3 hours
Manufacturing OvertimeSlight increase
Unemployment Rate4.2% (unchanged)
Job GrowthSlower

The forecast for month-over-month Average Hourly Earnings is 0.1%, compared to the previous outcome of 0.4%.

04-10-06-09-Average-Hourly-Earnings-mm-USD.jpg

USD - Non-Farm Employment Change

The Non-Farm Employment Change measures the change in the number of employed individuals in the economy during the previous month, excluding those in the farming sector. This indicator is crucial for currency traders because a higher-than-expected 'actual' figure compared to the 'forecast' typically signals a positive economic outlook, leading to currency appreciation. Job creation is a key leading indicator of consumer spending, which drives a significant portion of overall economic activity. Thus, strong employment figures often suggest a robust economy and can influence currency values accordingly.


In August, nonfarm payroll employment increased by 142,000, marking slower growth compared to the 12-month average of 202,000. Significant job gains were seen in construction (+34,000) and health care (+31,000), particularly in ambulatory health care services and hospitals. Social assistance also added 13,000 jobs, though at a slower rate. However, manufacturing employment fell by 24,000, largely due to declines in durable goods industries. Employment in other major sectors, including mining, retail, and transportation, showed little change. Additionally, job growth for June and July was revised down by a combined 86,000, reflecting weaker-than-previously-reported performance.​

TL;DR

  • Nonfarm payroll employment increased by 142,000 in August, lower than the 12-month average of 202,000.
  • Construction added 34,000 jobs.
  • Health care saw gains of 31,000 jobs, particularly in ambulatory health care services and hospitals.
  • Social assistance added 13,000 jobs, but at a slower rate.
  • Manufacturing employment fell by 24,000, mainly due to declines in durable goods industries.
  • Employment in mining, retail, and transportation showed little change.
  • Job growth for June and July was revised down by a combined 86,000, indicating weaker-than-previously-reported performance.

The forecast for Non-Farm Employment Changes is 130,000, compared to the previous figure of 142,000.

04-10-06-09-Non-Farm-Employment-Change-USD.jpg

USD - Unemployment Rate

The unemployment rate represents the proportion of the labor force that is without a job but actively looking for work over the past month. When the reported figure comes in below expectations, it typically boosts the currency's value. Although it’s considered a lagging indicator, traders monitor it closely as it provides insights into the economy’s overall condition and is strongly tied to consumer expenditure. Moreover, the unemployment rate plays a pivotal role in influencing monetary policy, making it a vital factor for both policymakers and market participants.


In August, the U.S. unemployment rate remained steady at 4.2%, reflecting little change from the previous month, according to the Bureau of Labor Statistics. The number of unemployed people stood at 7.1 million, higher than the 6.3 million recorded a year ago when the jobless rate was 3.8%. Unemployment rates across major demographic groups, including adult men, women, teenagers, and racial and ethnic groups, showed little variation. Despite modest job gains in sectors like construction and health care, manufacturing saw a decline, and overall job growth slowed, with nonfarm payroll employment increasing by just 142,000.​

TL;DR

  • U.S. unemployment rate: 4.2% in August, unchanged from the previous month.
  • Number of unemployed people: 7.1 million, higher than the 6.3 million a year ago.
  • Unemployment rate last year: 3.8% in August.
  • Little variation in unemployment rates across major demographic groups (adult men, women, teenagers, racial and ethnic groups).
  • Modest job gains in sectors like construction and health care.
  • Decline in manufacturing sector jobs.
  • Overall job growth slowed, with nonfarm payroll employment increasing by 142,000.

The Unemployment Rate is projected to be 4.3%, slightly higher than the previous figure of 4.2%.

The upcoming release of Average Hourly Earnings (m/m), Non-Farm Employment Change, and the Unemployment Rate is set for Friday at 12:30 PM GMT.

04-10-06-09-Unemployment-Rate-USD.jpg
 
Apr 16, 2024
94
0
7
44
9th October 2024

Wednesday


On October 9th, New Zealand is set to announce its Official Cash Rate, a key indicator of the country's monetary policy and economic direction. Shortly after, the United States will release the Federal Open Market Committee (FOMC) Meeting Minutes, offering insights into the Federal Reserve's recent policy discussions and decisions. These events will be closely watched by global markets, as they provide critical updates on the monetary policies of two significant economies.


NZD - Official Cash Rate

The Official Cash Rate (OCR) is the interest rate that banks use to borrow from the Reserve Bank of New Zealand (RBNZ) overnight. When the OCR is higher than expected, it generally strengthens the currency, as short-term interest rates play a crucial role in determining currency value. Traders closely monitor this rate to anticipate future currency trends, often using other economic indicators to predict potential changes in interest rates. The OCR is determined by the RBNZ Governor, in collaboration with senior bank officials and external advisers.


The Reserve Bank of New Zealand lowered the Official Cash Rate (OCR) by 25 basis points to 5.25%, marking its first rate cut in over four years amid cooling inflationary pressures. Consumer price inflation was expected to realign with the target range of 1 to 3% by the September quarter, and the decision reflected a broader trend of easing inflation across advanced economies as well as a downturn in imported inflation to pre-pandemic levels. The cut prompted a modest drop in the New Zealand dollar and led local banks, including Kiwibank and ASB, to reduce their lending rates. The Reserve Bank noted that future rate adjustments would depend on the consistency of pricing behavior and inflation expectations with its 2% target, suggesting the possibility of further cuts if economic indicators supported such a move.


The forecast for New Zealand's Official Cash Rate is 5.00%, down from the previous rate of 5.25%.


The Official Cash Rate is set to be announced on Wednesday at 1:00 AM GMT.

09-10-14-08-Official-Cash-Rate-NZD.jpg
 
Apr 16, 2024
94
0
7
44
10th October 2024

Thursday

On October 10, the United States is set to release key economic data, including the latest inflation figures and unemployment claims. These metrics are closely watched by economists, investors, and policymakers as they provide crucial insights into the health of the U.S. economy. The inflation report will shed light on price pressures and cost of living trends, while the unemployment claims data will offer an updated view of the labor market's strength, both of which are critical in shaping future monetary and fiscal policy decisions.

USD - Core CPI m/m

The Core Consumer Price Index year-over-year measure indicates how the prices of goods and services purchased by consumers change, excluding volatile items like food, energy, alcohol, and tobacco. This data is released monthly, roughly 16 days after the end of the month. Generally, if the 'Actual' figure exceeds the 'Forecast,' it is considered positive for the currency. However, in this context, Core CPI data has a relatively minor impact compared to other countries because the central bank primarily focuses on the overall CPI for its inflation target.

In August 2024, the Core Consumer Price Index (CPI), which excludes the volatile categories of food and energy, increased by 0.3% from the previous month. This rise was slightly above the anticipated 0.2% increase and marked a slight acceleration from the 0.2% gain in July. The increase was primarily driven by a notable uptick in transportation services, which rose by 0.9% compared to 0.4% in July. Shelter costs continued to climb, rising by 0.5%, up from a 0.4% increase in the previous month, indicating sustained pressure in the housing market. Additionally, apparel prices rebounded by 0.3% after a decline of 0.4% in July. On an annual basis, core consumer prices grew by 3.2%, the slowest rate since April 2021, matching the annual increase in July and aligning with market forecasts. This steady year-over-year rise reflects ongoing inflationary pressures, though at a moderated pace compared to earlier in the inflationary cycle.

The forecast for Core CPI m/m stands at 0.1% compared to previous 0.3% outcome.

10-10-11-09-Core-CPI-mm-USD.jpg


USD - CPI m/m

The Consumer Price Index (CPI) measures the monthly change in the prices of goods and services purchased by consumers. Typically, if the 'actual' CPI exceeds the 'forecast,' it is considered beneficial for the currency. This is because consumer prices make up a significant portion of overall inflation. Inflation, in turn, plays a crucial role in currency valuation, as increasing prices often prompt the central bank to raise interest rates to control inflation. The CPI is derived by sampling the average prices of various goods and services and comparing them to the previous month's data.

In August 2024, the Consumer Price Index for All Urban Consumers (CPI-U) rose 0.2% month-over-month, consistent with July's increase. The shelter index, up 0.5%, was the primary driver. Food prices edged up 0.1%, with a 0.3% rise in food away from home, while the energy index fell 0.8%. Excluding food and energy, the CPI rose 0.3%, driven by increases in shelter, airline fares, motor vehicle insurance, education, and apparel.

The forecast for the CPI month-over-month (m/m) is 0.2%, matching the previous result.

10-10-11-09-CPI-mm-USD.jpg

USD - CPI y/y

The Consumer Price Index (CPI) year-over-year (y/y) tracks the annual change in the cost of goods and services purchased by consumers. When the actual CPI is higher than expected, it is generally seen as favorable for the currency. This is because consumer prices make up a large part of overall inflation, which plays a key role in determining currency value. Rising inflation often leads central banks to increase interest rates to control it. The CPI is calculated by sampling the average prices of various goods and services and comparing them to previous data.

In August 2024, the US annual inflation rate slowed to 2.5%, the lowest since February 2021, down from 2.9% in July and below the forecast of 2.6%. This decline was driven by a 4.0% drop in energy costs, including a 10.3% fall in gasoline prices and a 12.1% decrease in fuel oil. Food prices rose by 2.1%, with increases in dining out and meat products. Core inflation, excluding food and energy, edged up to 3.2% from 3.1%, with shelter costs, which surged 5.2%, contributing significantly to this rise. Monthly CPI increased by 0.2%, matching July’s pace, with shelter costs being a primary driver. Core inflation for the month rose slightly to 0.3%, surpassing forecasts.

The CPI year-over-year forecast is expected to be 2.4%, down from the previous outcome of 2.5%.

10-10-11-09-CPI-yy-USD.jpg

USD - Unemployment Claims

Unemployment claims measure the number of individuals filing for unemployment insurance for the first time in the previous week. While typically considered a lagging indicator, this data is crucial for assessing economic health because consumer spending closely tracks labor market conditions.Moreover, unemployment figures significantly influence monetary policy decisions, making them pivotal for policymakers. Traders closely monitor these statistics, as actual numbers differing from forecasts can impact currency valuations—lower actual claims relative to forecasts are generally favorable for a currency's strength.

Unemployment claims in the US rose to 225,000 for the week ending September 28, slightly above market expectations of 220,000 and up from the previous week's revised 219,000. The seasonally adjusted insured unemployment rate held steady at 1.2%, while the 4-week moving average decreased slightly to 224,250. Additionally, seasonally adjusted insured unemployment fell by 1,000 to 1,826,000 for the week ending September 21.

The Unemployment Claims forecast is set at 231,000, with the previous figure being 225,000.

The upcoming U.S. inflation and Unemployment Claims data will be released on Thursday at 12:30 PM GMT.

10-10-03-10-Unemployment-Claims-USD.jpg
 
Apr 16, 2024
94
0
7
44
11th October

Friday

GBP - GDP m/m

Following the UK's GDP report, which showed no growth for the second consecutive month in July, the EUR/GBP pair reacted with a bullish movement. Opening at 0.84267, the pair steadily climbed throughout the day. Despite the flatlining economy, strength in the services sector and market expectations of unchanged interest rates helped maintain momentum. Later, the release of US inflation figures further influenced the EUR/GBP's rise, pushing the pair to a peak of 0.84635, resulting in a 36.8-pip gain since the initial news release.
11-10-11-09-GDP-mm-GBP.jpg

CAD – Employment Change & Unemployment Rate

In response to the latest employment announcement, the Canadian Dollar to Japanese Yen (CADJPY) exchange rate exhibited volatile trading behavior. At the moment the news was released, the currency pair opened at 106.112, quickly surging to a peak of 106.480, marking a bullish movement of 36.8 pips. However, this upward momentum was short-lived as the pair then reversed direction, descending sharply to a low of 104.660, translating to a significant drop of 182.0 pips. This sequence of movements underscores the market's mixed reactions to the nuances of Canada's current economic conditions.

11-10-06-09-Employment-Change-CAD.jpg

11-10-06-09-Unemployment-Rate-CAD.jpg

USD - Core PPI m/m & PPI m/m

Following the latest economic data release, the US500 experienced a significant volatility. Initially, the index opened at 5572.05 and dropped to a low of 5541.18, a decline of 3,087 ticks. This bearish movement likely stemmed from concerns over persistent inflation pressures and potential for the federal reserve to adopt a more cautious approach to interest rate cuts, as indicated by the 0.3% rise in core PPI and mixed signals from the job market. However, the sentiment shifted as the index rebounded to a peak of 5607.93, marking a 6,675 tick increase from its lowest point. This bullish turn reflects market expectations that the Fed might implement a more measured quarter-point interest rate cut, despite ongoing economic adjustments and resilient job market.

11-10-12-09-Core-PPI-mm-USD.jpg

11-10-12-09-PPI-mm-USD.jpg
 
Apr 16, 2024
94
0
7
44
15th October 2024

Tuesday


GBP - Claimant Count Change

Following the announcement of the UK’s rising Claimant Count and the ongoing challenges in the labor market, the GBP/JPY currency pair experienced notable volatility. Initially, the pair opened at 187.153 and surged to a peak of 188.097, gaining 94.4 pips in a bullish movement. However, this was followed by a significant bearish reversal, with the pair plummeting to a low of 185.727, marking a sharp decline of 237.0 pips. This movement reflects the market’s mixed reaction to the concerning rise in unemployment benefits claims and the decline in job vacancies, underscoring the pressures on the UK economy and the uncertainty surrounding future economic stability.

15-10-10-09-Claimant-Count-Change-GBP.jpg

CAD - CPI m/m, Median CPI y/y & Trimmed CPI y/y

Following the August 2024 CPI announcement, the CADCHF currency pair initially experienced a bearish reaction, with the exchange rate dropping from 0.62144 to 0.62045—a decline of 9.9 pips within the first five minutes of the release. However, this downward movement was short-lived, as the pair reversed course and demonstrated a strong bullish trend throughout the remainder of the day. By the end of trading, the CADCHF had surged to a peak of 0.62326, marking a notable 28.1-pip gain from its earlier low.

15-10-17-09-CPI-mm-CAD.jpg

15-10-17-09-Median-CPI-yy-CAD.jpg

15-10-17-09-Trimmed-CPI-yy-CAD.jpg

NZD - CPI q/q

Following the release of New Zealand's second-quarter CPI report, which showed a lower-than-expected increase, the financial markets responded with a noticeable bearish trend. Initially, the currency opened at 1.11263, but quickly fell to a low of 1.10725, a decline of 53.8 pips in the first two hours following the announcement. After reaching this low point, the market partially recovered, climbing back to 1.11062 within four hours, yet it still remained below the opening point by 33.7 pips. The announcement triggered a significant downward shift, underscoring the market's reaction. This decline illustrates how sensitive the market is to new information, as investors promptly adjusted their positions in response to the news.

15-10-16-07-CPI-qq-NZD.jpg
 
Apr 16, 2024
94
0
7
44
16th October 2024

Wednesday


GBP - CPI y/y

The GBP/USD currency pair experienced significant volatility following the release of the UK's Consumer Price Index (CPI) year-over-year figures and the subsequent U.S. Federal Funds Rate announcement. At the time of the UK CPI release, the pair opened at 1.31575 and surged to a peak of 1.32540 within the first eight hours, marking a sharp 96.5-pip bullish movement. However, as anticipation grew ahead of the U.S. Federal Reserve's rate decision, the pair entered a bearish phase. Upon the release of the Fed's decision, the GBP/USD pair responded with renewed bullish momentum, climbing to a second peak of 1.32980—a 140.5-pip increase from its opening level. As the U.S. press conference commenced, the pair once again transitioned into a bearish trend.

16-10-18-09-CPI-yy-GBP.jpg
 
Apr 16, 2024
94
0
7
44
17th October

Thursday


AUD - Employment Change & Unemployment Rate

Following the release of Australia's August 2024 employment figures, the AUD/USD pair experienced a bullish surge. Opening at 0.67427 at the time of the news, the pair quickly gained momentum as the positive employment data, surpassing market expectations, boosted market confidence. Over the next nine hours, the currency pair climbed steadily, reaching a peak of 0.68391, marking a significant increase of 96.4 pips. This upward movement reflects optimism in the market, driven by robust job growth and a stable unemployment rate, signaling resilience in the Australian economy despite underlying challenges.

17-10-19-09-Employment-Change-AUD.jpg17-10-19-09-Unemployment-Rate-AUD.jpg

EUR - Main Refinancing Rate

The EUR/USD pair saw a bullish movement following the European Central Bank's interest rate announcement, which reduced the deposit facility rate to 3.50% and lowered the main refinancing operations rate to 3.65%, effective from 18 September 2024. Opening at 1.10126, the Euro surged to a peak of 1.10751, achieving a 62.5-pip gain. This uptick was also fueled by U.S. economic data released shortly after, including Core PPI, PPI, and Unemployment Claims, which showed slightly higher inflationary pressures but a stable labor market. These combined factors contributed to the Euro's strong performance against the Dollar.

17-10-12-09-Main-Refinancing-Rate-EUR.jpg

USD - Core Retail Sales m/m & Retail Sales m/m

Following the release of the U.S. retail sales figures, the USDJPY pair exhibited a notable bullish movement. Opening at 140.746, the pair surged to a peak of 142.467 within eight hours, marking an impressive increase of 172.1 pips by the close of the trading day. This strong ascent highlights the market's positive reaction to the retail data, reflecting increased confidence in the U.S. economic outlook and its influence on the yen.

17-10-17-09-Core-Retail-Sales-mm-USD.jpg17-10-17-09-Retail-Sales-mm-USD.jpg

USD - Unemployment Claims

The market experienced a significant bullish movement in the price of XAU/USD (Gold) following a key announcement at 12:30 GMT. Within a 5-minute volatility window, the market saw 2,303 ticks, with the price opening at 2612.14 and spiking to a high of 2624.05, after reaching a low of 2601.02. This movement suggests a strong bullish reaction to the news announcement, pushing the price sharply upward.

17-10-10-10-Unemployment-Claims-USD.jpg
 
Apr 16, 2024
94
0
7
44
23rd October 2024

Wednesday


On October 23rd, Canada is set to announce its latest Overnight Rate, followed by a press conference from the Bank of Canada. This highly anticipated release will be closely monitored by financial markets, economists, and policy makers, as it may provide key insights into the country's economic direction, inflation control, and future monetary policy. The decision will likely have broad implications for lending rates, consumer spending, and overall economic growth in the months ahead.


CAD - Overnight Rate

The overnight rate refers to the interest rate at which major financial institutions borrow and lend funds to each other for a single night. Generally, when the actual overnight rate exceeds the forecast, it is seen as positive for the currency. This is because short-term interest rates play a crucial role in determining currency value. Most traders focus on other economic indicators primarily to anticipate potential changes in these rates.


The Bank of Canada has lowered its policy interest rate by 25 basis points, bringing the target for the overnight rate to 4.25%, as part of its ongoing effort to normalize its balance sheet. The global economy grew by 2.5% in the second quarter, with stronger-than-expected growth in the U.S. and moderate inflation in key regions. In Canada, economic growth reached 2.1%, driven by government spending and business investment, though preliminary indicators suggest softer activity in June and July. Inflation has eased to 2.5%, but high shelter costs remain a significant contributor. The Bank's decision reflects easing inflationary pressures and its commitment to restoring price stability.​

TL;DR

CategoryDetails
Bank of Canada DecisionLowered policy interest rate by 25 basis points to 4.25%.
Purpose of Rate AdjustmentPart of an ongoing effort to normalize the balance sheet.
Global Economic Growth (Q2)2.5% growth, with stronger-than-expected U.S. growth and moderate inflation in key regions.
Canadian Economic Growth (Q2)2.1% growth, driven by government spending and business investment.
Preliminary Indicators (June/July)Softer economic activity observed.
Inflation Rate in CanadaEased to 2.5%, though high shelter costs remain a key contributor.
Bank’s Decision RationaleReflects easing inflationary pressures and commitment to restoring price stability.

The projected interest rate decision for Canada is anticipated to be 3.75%.

The next Overnight Rate decision is set to be released on Wednesday at 1:45 PM GMT.

23-10-04-09-Overnight-Rate-CAD.jpg


CAD - BOC Press Conference

The Bank of Canada (BOC) press conference, led by the Governor and Senior Deputy Governor, is a critical event for market watchers and traders. It provides detailed insights into the factors influencing the BOC's latest interest rate decision, including the overall economic outlook and inflation trends. The conference begins with a prepared statement, followed by a Q&A session with the press, where unscripted responses can trigger significant market volatility. This event is a key communication channel for the BOC to signal its monetary policy direction, and traders closely monitor it for hints about future rate changes. The press conference is broadcast live on the BOC’s website.​

The upcoming press conference is set to take place on Wednesday at 2:30 PM GMT.
 
Apr 16, 2024
94
0
7
44
24th October 2024

Thursday


On Thursday, major economic reports are set to be released, with significant attention on the flash manufacturing and services PMI figures from France, Germany, the UK, and the US. These reports will provide critical insights into the health of key sectors in each economy. Additionally, the US will release its latest unemployment claims data, which will be closely watched for signs of labor market strength or weakness. These reports are expected to have a notable impact on global financial markets as investors assess the state of economic recovery in these major economies.


EUR - French Flash Manufacturing PMI

The Manufacturing Purchasing Managers Index (PMI), provided by S&P Global and Hamburg Commercial Bank (HCOB), is an essential indicator for France's manufacturing sector, which plays a significant role in the national GDP. This index reflects the business conditions within the sector, with a PMI score above 50 signaling optimistic economic prospects and bullish market conditions for the Euro, while a score below 50 indicates bearish conditions potentially harmful to the currency. Traders closely monitor the PMI because it acts as a leading economic health indicator, with purchasing managers offering timely and pertinent insights into market conditions and the company's economic expectations.


In September 2024, the S&P Global France Manufacturing PMI rose to 44.6 from 43.9 in August, slightly higher than the preliminary reading of 44. Despite this improvement, it marked the 20th consecutive month of contraction, although the decline was the mildest since May. Output and new orders continued to decrease sharply due to weak demand, but the pace of contraction eased slightly. The consumer goods sector neared stabilization, while the intermediate and capital goods sectors remained in steep decline. Purchasing activity was reduced, and pre-production stocks fell at the fastest rate in nearly four-and-a-half years. Employment also declined, though at the slowest rate in five months. On the price front, input cost pressures eased, partly due to lower metal prices, while selling prices showed only a slight increase. French manufacturers were the most pessimistic they had been since January, driven in part by ongoing political uncertainty in the country.​

TL;DR
CategorySeptember 2024Comparison with August 2024
PMI Index44.6Increased from 43.9 (August)
Preliminary PMI Reading44Final slightly higher than prelim
Consecutive Months of Contraction20 monthsContinued contraction
Output and New OrdersDecreased sharplyEased slightly in pace
Consumer Goods SectorNearing stabilizationImproved over prior month
Intermediate & Capital GoodsSteep declineNo improvement
Purchasing ActivityReducedContinued reduction
Pre-production StocksFell at fastest rate in 4.5 yearsSignificant drop
EmploymentDeclinedSlowest decline in 5 months
Input Cost PressuresEasedDue to lower metal prices
Selling PricesSlight increaseMinimal change
Business SentimentMost pessimistic since January 2024Driven by political uncertainty

The forecast is indicating 44.9 compared to previous 44.6 outcome.

24-10-23-09-French-Flash-Manufacturing-PMI-EUR.jpg

EUR - French Flash Services PMI

The French Flash Services PMI is a key measure of economic health, derived from a survey of around 750 purchasing managers in the services sector. It provides a diffusion index based on their assessment of business conditions, including factors like employment, production, new orders, prices, supplier deliveries, and inventories. Traders pay close attention to this indicator because it reflects current market conditions and business sentiment. A result higher than the forecast is typically viewed as positive for the currency, as purchasing managers often have the most up-to-date insights into their company's economic outlook.


In September 2024, the HCOB France Services PMI dropped to 49.6, exceeding preliminary estimates of 48.3 but marking a significant decline from 55 in August. The sharp contraction was largely attributed to a decrease in visitor and customer numbers following the temporary boost from the Paris Olympic Games. New business volumes continued to shrink, with demand weakening in overseas markets, marking the third decline in four months. Output also decreased, though only marginally. Despite these setbacks, employment rose for the 48th consecutive month, albeit at a slower pace. Input cost inflation eased significantly, hitting its lowest level in over three years, while output prices stabilized, ending a 40-month streak of increases. Despite these challenges, service providers remained optimistic, expecting stronger demand by the end of the year and into early 2025.​

TL;DR

MetricSeptember 2024Comments
PMI49.6Exceeded preliminary estimate of 48.3, but down from 55 in August.
Visitor & Customer NumbersDecreaseDrop attributed to the post-Olympic Games effect.
New Business VolumesShrinkThird decline in four months; weaker overseas demand.
OutputMarginal decreaseThough output decreased, the decline was slight.
EmploymentRose for 48th consecutive monthGrowth at a slower pace.
Input Cost InflationEased significantlyLowest level in over three years.
Output PricesStabilizedEnded a 40-month streak of increases.
Business OutlookOptimisticService providers expect stronger demand by late 2024 and early 2025.

The forecast predicts a slight improvement, with a projected figure of 49.8, up from the previous outcome of 49.6.

The French Flash Manufacturing & Services PMI is set to be released on Thursday at 7:15 AM GMT.

24-10-23-09-French-Flash-Services-PMI-EUR.jpg

EUR - German Flash Manufacturing PMI

The German Flash Manufacturing PMI measures the performance of the manufacturing sector through a survey of about 800 purchasing managers, assessing business conditions such as employment, production, and new orders. A reading above 50 indicates expansion, while below 50 signals contraction. Traders monitor this as a key economic indicator, as purchasing managers offer real-time insights into market conditions. A result higher than the forecast is positive for the currency, reflecting potential economic growth.


In September 2024, Germany's HCOB Manufacturing PMI dropped to 40.6, down from 42.4 in the previous month, marking its lowest point in a year. Although the final reading was revised slightly higher than the preliminary estimate of 40.3, it remained significantly below initial expectations of 42.3. The data highlighted a deepening contraction in the country's manufacturing sector, a critical factor in the Eurozone's overall sluggish output. New orders saw a sharp decline, with companies citing market uncertainty, reduced investment, customer destocking, and notable weakness in the auto manufacturing industry. As a result, production fell despite a reduction in work backlogs, while lower demand led to a continued drop in purchasing activity and employment levels, which sank at the fastest rate in four years. Meanwhile, decreased input demand caused both purchasing prices and output charges to decline.​

TL;DR
CategoryDetails
HCOB Manufacturing PMI (Sept 2024)40.6 (down from 42.4 in August 2024)
Lowest Point in1 year
Final Reading40.6 (revised up from preliminary estimate of 40.3)
Initial Expectations42.3
Sector ImpactDeepening contraction in Germany's manufacturing sector
New OrdersSharp decline due to market uncertainty, reduced investment, customer destocking, and weakness in the auto industry
ProductionDeclined despite reduced work backlogs
Purchasing ActivityContinued decline due to lower demand
Employment LevelsDeclined at the fastest rate in 4 years
Purchasing Prices & Output ChargesBoth declined due to decreased input demand

The forecast indicates a slight rise to 40.7, compared to the previous outcome of 40.6.

The German Flash Manufacturing & Services PMI is scheduled for release on Thursday at 7:30 AM GMT.

24-10-23-09-German-Flash-Manufacturing-PMI-EUR.jpg

EUR - German Flash Services PMI

The German Flash Services PMI measures the level of business activity in the services sector through a diffusion index based on a survey of around 800 purchasing managers. A reading above 50 indicates expansion, while below 50 signals contraction. If the 'Actual' figure exceeds the forecast, it's positive for the currency. This index is a leading indicator of economic health, as purchasing managers provide current insights into business conditions such as employment, production, new orders, prices, and supplier deliveries.


Germany's services sector saw a slowdown in September 2024, with the HCOB Flash Services PMI Business Activity Index dropping to 50.6 from 51.2 in August, marking a six-month low and the fourth consecutive month of decline. The report, compiled by S&P Global, indicated a sharp contraction in the country’s private sector, with a notable drop in manufacturing production and a near-stall in services growth. New business orders, including exports, fell at their fastest rate in nearly a year, and workforce numbers were cut for the third month. Inflationary pressures eased significantly, with input and output price increases in services at their slowest since April 2021. Despite remaining positive, business sentiment for the year ahead hit a 12-month low, as concerns over the economy and key sectors like automotive and construction weighed heavily on expectations.​

TL;DR

AspectDetails
EventSlowdown in Germany's services sector
MonthSeptember 2024
PMI Business Activity IndexDropped to 50.6 (from 51.2 in August)
Key IndicatorsSix-month low, fourth consecutive month of decline
Private Sector ImpactSharp contraction in manufacturing, near-stall in services growth
New Business OrdersFell at fastest rate in nearly a year
WorkforceCut for the third consecutive month
Inflationary PressuresEased significantly, slowest price increases since April 2021
Business Sentiment12-month low
Sector-Specific ConcernsAutomotive and construction

The forecast shows 50.6, remaining unchanged from the previous outcome.

24-10-23-09-German-Flash-Services-PMI-EUR.jpg

GBP - Flash Manufacturing PMI

The Manufacturing Purchasing Managers Index (PMI) from the Chartered Institute of Procurement & Supply and S&P Global is a crucial monthly indicator for the UK's manufacturing sector, derived from surveys of senior executives. It gauges changes in business activity, predicting shifts in GDP, industrial production, employment, and inflation. The index operates on a 0-100 scale; readings above 50 indicate sector expansion (positive for the Pound Sterling), while below 50 suggests contraction (negative for the currency). Traders value the PMI for its immediate insights into economic health provided by purchasing managers.


In September 2024, the S&P Global Flash UK Manufacturing PMI dropped to 51.5, a three-month low from August's 52.5, signaling slower growth in the sector. The decline reflects a cautious approach by clients ahead of the Autumn Budget, subdued export orders—particularly from the EU—and renewed job cuts in manufacturing. Despite weaker demand, supply chain disruptions, notably ocean freight delays due to the Red Sea crisis, extended delivery times. Inflationary pressures persisted, with purchase price inflation reaching its highest level since January 2023, driven by rising wages and shipping costs. However, private sector prices charged for goods and services saw their slowest increase since February 2021, suggesting cooling inflation. Overall, the UK private sector continued its expansion for the 11th consecutive month, but growth in both manufacturing and services slowed.​

TL;DR
Key AspectDetails
S&P Global Flash UK Manufacturing PMIDropped to 51.5 in September 2024, down from 52.5 in August (3-month low)
Sector GrowthSlower growth in manufacturing
Client ApproachCautious approach ahead of the Autumn Budget
Export OrdersSubdued, particularly from the EU
Job MarketRenewed job cuts in manufacturing
Supply Chain DisruptionsOcean freight delays, especially due to the Red Sea crisis
Delivery TimesExtended due to supply chain issues
Purchase Price InflationHighest level since January 2023, driven by rising wages and shipping costs
Private Sector Prices (Goods & Services)Slowest increase in prices since February 2021, indicating cooling inflation
UK Private Sector Expansion
Continued expansion for 11th consecutive month, but growth slowed in both manufacturing and services​

The forecast remains unchanged at 51.5, the same as the previous figure.
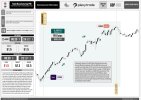
24-10-23-09-Flash-Manufacturing-PMI-GBP.jpg

GBP - Flash Services PMI

The Services Purchasing Managers Index (PMI), issued monthly by the Chartered Institute of Procurement & Supply and S&P Global, is a vital indicator of the UK's services sector health. Ranging from 0 to 100, a PMI above 50 indicates sector expansion, boosting the Pound Sterling (GBP), while below 50 suggests contraction, negatively impacting GBP. This index is closely watched by traders as it provides real-time insights into economic conditions from the perspective of purchasing managers.


In September 2024, the S&P Global UK Services PMI dropped to 52.4, down from 53.7 in August and revised lower from an initial estimate of 52.8. While the pace of growth moderated, business activity remained robust, supported by strong domestic demand, particularly in sectors such as technology, real estate, and leisure services. New business volumes continued to expand, approaching the 14-month peak seen in July. However, export orders grew at a slower rate than overall new business, highlighting weaker overseas demand as a persistent issue. Employment gains also slowed, with hiring activity falling significantly to a three-month low. On the pricing front, cost pressures increased, largely driven by rising wages, but competitive forces limited price hikes, leading to the slowest rise in output charges since February 2021. Despite these challenges, business outlook for the year ahead remained positive.

TL;DR

MetricDetails
S&P Global UK Services PMI (Sep 2024)52.4 (down from 53.7 in August)
Initial Estimate (Sep 2024)Revised lower from 52.8
Business ActivityRemained robust, supported by strong domestic demand
Key SectorsTechnology, real estate, leisure services
New Business VolumesExpanded, nearing the 14-month peak seen in July
Export OrdersGrew slower than overall new business, indicating weaker overseas demand
Employment GainsSlowed significantly, reaching a three-month low
Hiring ActivityFell significantly
Cost PressuresIncreased, mainly due to rising wages
Output ChargesSlowest rise since February 2021 due to competitive pressures limiting price hikes
Business OutlookRemained positive despite challenges

The forecast suggests a slight decrease to 52.3, compared to the previous outcome of 52.4.

The Flash Manufacturing & Services PMI is set to be released on Thursday at 8:30 AM GMT.

24-10-23-09-Flash-Services-PMI-GBP.jpg

USD - Unemployment Claims

Unemployment claims measure the number of people who filed for unemployment benefits for the first time in the past week. If the actual figure is lower than the forecast, it is generally positive for the currency. Although seen as a lagging indicator, unemployment is an important reflection of economic health since consumer spending is closely linked to labor conditions. Additionally, unemployment levels play a crucial role in influencing the country's monetary policy decisions.


In the week ending October 12, U.S. unemployment claims dropped by 19,000 to 241,000, the largest decrease in three months after reaching a 14-month high the previous week. This figure came in below market expectations of 260,000, with the decline following disruptions caused by Hurricanes Helene and Milton. Despite the decrease, claims remain elevated compared to earlier in the year, signaling a cooling labor market after its post-pandemic peak. Continuing claims for the week ending October 5 rose by 9,000 to 1,867,000, while the four-week moving average for initial claims increased by 4,750 to 236,250. Non-seasonally adjusted claims fell by 11,416, with notable decreases in Michigan and Florida.​

TL;DR

MetricValueNotes
Initial Unemployment Claims (Week Ending Oct 12)241,000Decreased by 19,000, largest decrease in three months
Market Expectation for Initial Claims260,000Actual claims were below expectations
Initial Claims (Previous Week)14-month highAffected by Hurricanes Helene and Milton
Continuing Claims (Week Ending Oct 5)1,867,000Increased by 9,000
4-Week Moving Average for Initial Claims236,250Increased by 4,750
Non-Seasonally Adjusted Claims-11,416
Decrease in non-seasonally adjusted claims, particularly in Michigan and Florida​

The forecast projects 243,000, slightly higher than the previous outcome of 241,000.

The Unemployment Claims report is scheduled for release on Thursday at 12:30 PM GMT.

24-10-17-10-Unemployment-Claims-USD.jpg

USD - Flash Manufacturing PMI

The S&P Global Manufacturing Purchasing Managers Index (PMI) is a crucial monthly indicator for the US manufacturing sector, derived from surveys of senior executives. It measures business activity, with a score above 50 indicating expansion and below 50 signifying contraction. This data helps predict trends in GDP, industrial production, employment, and inflation, and significantly influences the US Dollar's value. Traders value it as a leading economic health indicator, reflecting immediate market conditions from a managerial perspective.


The S&P Global US Manufacturing PMI was revised upward to 47.3 in September 2024, slightly higher than the preliminary estimate of 47, but still marking the lowest level since June 2023. This reflects the third consecutive month of contraction in the sector, driven by sharp declines in both output and new orders amid weakened demand and ongoing political uncertainty. Employment levels also fell at the steepest rate since 2010, excluding the pandemic period. Despite these challenges, business confidence saw a modest improvement, with optimism focused on a potential demand recovery following the upcoming election. Input cost inflation eased, though it remained elevated, and companies raised prices at the fastest rate since April.​

TL;DR

IndicatorDetails for September 2024
S&P Global US Manufacturing PMI47.3 (Revised from 47, lowest since June 2023)
TrendThird consecutive month of contraction
OutputSharp decline due to weakened demand and political uncertainty
New OrdersSharp decline
Employment LevelsFell at the steepest rate since 2010 (excluding the pandemic period)
Business ConfidenceModest improvement, optimism due to potential recovery post-election
Input Cost InflationEased, but still elevated
Prices RaisedCompanies raised prices at the fastest rate since April

The forecast points to 47.5, slightly higher than the previous outcome of 47.3.

24-10-23-09-Flash-Manufacturing-PMI-USD.jpg

USD - Flash Services PMI

The S&P Global Services Purchasing Managers Index (PMI) is a crucial monthly indicator for the US services sector, which constitutes a significant portion of the economy. This index is derived from surveys of senior executives in private sector service companies, reflecting month-over-month changes in business activity. A PMI reading above 50 suggests expansion in the services sector, positively influencing the US Dollar, while a reading below 50 indicates contraction, which could negatively impact the currency. Traders value this data as it serves as a leading indicator of economic health, providing insights from purchasing managers who have timely and relevant perspectives on market conditions.


The S&P Global US Services PMI for September 2024 was revised down slightly to 55.2 from a preliminary 55.4, marking a modest decline from August's 55.7 but still reflecting robust growth in the services sector. Despite solid increases in new business, companies were cautious about hiring due to rising input costs, which surged at the joint-fastest rate in a year, contributing to faster selling price inflation. Business confidence dropped to its lowest point since October 2022, as concerns about an economic slowdown mounted. Employment fell for the second consecutive month, exacerbating staff shortages, while backlogs of work grew at the fastest rate since January, driven by strong new orders and understaffing challenges.​

TL;DR

IndicatorValue/Comment
US Services PMI (Sep 2024, Revised)55.2 (Revised from 55.4)
US Services PMI (Aug 2024)55.7
New BusinessSolid increases
Input CostsSurged (Joint-fastest rate in a year)
Selling Price InflationFaster
Business ConfidenceLowest since October 2022
EmploymentFell for second consecutive month
Backlogs of WorkGrew at fastest rate since January

The forecast suggests a slight decrease to 55.0, compared to the previous outcome of 55.2.

The Flash Manufacturing and Services PMI is scheduled for release on Thursday at 1:45 PM GMT.

24-10-23-09-Flash-Services-PMI-USD.jpg
 
Apr 16, 2024
94
0
7
44
25th October 2024

Friday


On October 25, Canada is set to release its Core Retail Sales and Retail Sales data, providing key insights into consumer spending trends. The Core Retail Sales report, excluding the automobile sector, offers a focused view, while the overall Retail Sales data gives a broader perspective. These reports are closely monitored by economists and analysts for assessing the health of the Canadian economy and potential impacts on monetary policy.


CAD - Core Retail Sales m/m

The Core Retail Sales measure, excluding automobiles, tracks monthly changes in the total retail sales value, offering a clearer view of spending trends by removing the volatility of auto sales, which constitute about 20% of total sales. Released monthly by Statistics Canada, this measure is a key indicator of consumer spending. A higher-than-forecast reading is typically bullish for the Canadian Dollar (CAD), while a lower reading is bearish. The month-over-month (MoM) percentage change compares sales values between consecutive months.

Retail sales excluding autos in Canada increased by 0.4% month-over-month in July 2024, slightly above the 0.3% growth seen in June and the forecasted 0.3%. On average, retail sales excluding autos have grown by 0.37% from 1991 to 2024, with a record high of 14.1% in June 2020 and a record low of -18.8% in April 2020. In July 2024, core retail sales, which exclude gasoline stations, fuel vendors, and motor vehicle and parts dealers, rose by 0.6%, marking a second consecutive monthly increase. This growth was led by a 0.8% rise in food and beverage sales, particularly at supermarkets and grocery stores (+1.2%), specialty food retailers (+2.1%), and convenience stores (+0.4%). General merchandise retailers also saw a 0.8% sales increase, while health and personal care retailers posted a 1.2% gain. However, these increases were partially offset by a 1.4% drop in sales at building material and garden equipment suppliers. Retail sales rose in eight provinces, with Quebec leading at +1.5%, while Ontario saw a 0.2% decline, driven by weaker food and beverage sales.​

TL;DR
  • Retail sales excluding autos: Increased by 0.4% month-over-month (MoM).
  • Retail sales excluding autos in June: Rose by 0.3%.
  • Forecasted retail sales growth: Expected to be 0.3%.
  • Core retail sales (excluding gasoline, fuel, motor vehicles, and parts): Increased by 0.6% MoM.
  • Food and beverage sales: Grew by 0.8%, led by:
    • Supermarkets and grocery stores: +1.2%
    • Specialty food retailers: +2.1%
    • Convenience stores: +0.4%
  • General merchandise retailers: Sales increased by 0.8%.
  • Health and personal care retailers: Posted a 1.2% sales gain.
  • Building material and garden equipment suppliers: Sales dropped by 1.4%.
  • Retail sales by province:
    • Quebec: +1.5%
    • Ontario: -0.2% (weaker food and beverage sales).

The forecast indicates 0.3%, down from the previous result of 0.4%.

25-10-20-09-Core-Retail-Sales-mm-CAD.jpg

CAD - Retail Sales m/m

The Retail Sales m/m measure, released monthly by Statistics Canada about 50 days after the month ends, tracks the change in the total value of goods sold by Canadian retailers. This measure is a key indicator of consumer spending, which significantly impacts overall economic activity. A higher-than-expected reading is seen as positive for the Canadian Dollar (CAD), while a lower-than-expected result is viewed as negative. The report is closely monitored by traders as it provides insights into the health of the economy and consumer behavior.

In August 2024, Canadian retail sales are projected to have risen by 0.5% month-over-month, according to a flash estimate, extending the 0.9% surge in July, which was revised higher from an initial estimate of 0.5%. This rebound from a 0.2% drop in June marks the sharpest increase in retail turnover since April 2023. July's strong performance was driven by higher demand at motor vehicle and parts dealers (+2.2%), food and beverage retailers (+0.8%), general merchandise retailers (+0.8%), and health and personal care retailers (+1.2%). Retail sales volumes rose 1.0% in July, underscoring the increased consumer demand. Year-over-year, retail turnover in July was 0.9% higher. Regionally, eight provinces saw retail sales growth, with Quebec leading at +1.5%, while Ontario experienced a 0.2% decline. Additionally, retail e-commerce sales grew 3.4% to $4.1 billion, representing 6.1% of total retail trade in July. An advance estimate for August 2024 suggests a further 0.5% increase, though this figure is subject to revision.​

TL;DR
  • June 2024:
    • Retail sales declined by 0.2%.
  • July 2024:
    • Retail sales increased by 0.9% (revised from an initial estimate of 0.5%).
    • Key drivers:
      • Motor vehicle and parts dealers (+2.2%)
      • Food and beverage retailers (+0.8%)
      • General merchandise retailers (+0.8%)
      • Health and personal care retailers (+1.2%)
    • Retail sales volume grew by 1.0%.
    • Year-over-year growth: 0.9%.
    • Regional performance:
      • Quebec led with +1.5% growth.
      • Ontario saw a 0.2% decline.
      • Eight provinces experienced retail sales growth.
    • E-commerce sales increased by 3.4%, totaling CAD 4.1 billion, accounting for 6.1% of total retail trade.
  • August 2024 (Flash Estimate):
    • Retail sales are projected to rise by 0.5%, subject to revision.

The forecast shows 0.5%, a decrease from the previous outcome of 0.9%.

The upcoming Core Retail Sales m/m and Retail Sales m/m reports are scheduled for release on Friday at 12:30 PM GMT.

25-10-20-09-Retail-Sales-mm-CAD.jpg
 
Apr 16, 2024
94
0
7
44
29th October 2024

Tuesday


On October 29, the United States is set to release two significant economic indicators: the CB Consumer Confidence report and the JOLTS Job Openings data. These announcements are highly anticipated by economists and market analysts as they provide key insights into the health of the U.S. economy. The Consumer Confidence report, a measure of consumer sentiment toward the economy, can signal potential shifts in consumer spending behavior, while the JOLTS data reveals the number of job openings, offering a snapshot of labor market demand. Both releases are expected to influence financial markets and may impact monetary policy outlooks.


USD - CB Consumer Confidence

In September 2024, the Conference Board Consumer Confidence Index fell sharply to 98.7, down from 105.6 in August. This marks the largest decline since August 2021, driven by weakening consumer assessments across all components of the Index. The Present Situation Index, which reflects consumers' views of current business and labor market conditions, dropped by 10.3 points to 124.3, while the Expectations Index, which measures future economic outlooks, fell by 4.6 points to 81.7, staying just above the recession threshold of 80. Consumers aged 35 to 54 saw the steepest confidence drop, with those earning less than $50,000 experiencing the largest decrease across income groups. Despite low unemployment and healthy wages, consumers expressed growing concerns about fewer hours, slower payroll increases, and job availability. Inflation expectations rose to 5.2%, while mentions of inflation and interest rates dominated consumers' outlook. Although some planned purchases like homes and new cars improved slightly on a six-month average, there was a noticeable easing in plans to buy smartphones and laptops. While consumer assessments of their financial situations weakened, interest in travel, dining, and non-discretionary services like healthcare remained strong.​

TL;DR
  • Consumer Confidence Index: Dropped to 98.7 in September 2024 from 105.6 in August; largest decline since August 2021.
  • Present Situation Index: Fell by 10.3 points to 124.3, reflecting lower confidence in current business and labor markets.
  • Expectations Index: Decreased by 4.6 points to 81.7, remaining slightly above the recession threshold of 80.
  • Age Group Impact: Consumers aged 35-54 experienced the steepest confidence decline.
  • Income Group Impact: Households earning less than $50,000 saw the largest confidence drop.
  • Inflation Expectations: Increased to 5.2%; inflation and interest rates are top concerns for consumers.
  • Employment Concerns: Consumers worried about fewer work hours, slower payroll growth, and job availability.
  • Purchase Plans: Intentions to buy homes and new cars slightly improved, while interest in smartphones and laptops decreased.
  • Financial Situation: Consumers’ assessment of their financial health weakened.
  • Interest in Services: Strong demand remained for travel, dining, and non-discretionary services like healthcare.

The forecast predicts 99.2, up from the previous outcome of 98.7.

29-10-24-09-CB-Consumer-Confidence-USD.jpg

USD - JOLTS Job Openings

In August, the US labor market showed signs of resilience as job openings rose to 8.04 million, up from a revised 7.71 million in July, according to the Bureau of Labor Statistics. This figure, surpassing economists' expectations of 7.682 million, indicated 1.1 available jobs for every job seeker. While hiring remained sluggish, layoffs decreased, reflecting some underlying stability in the market. Sectors like construction, transportation, and government saw the largest increase in openings, while service industries experienced a decline. Despite the increase in openings, voluntary job quits fell to 3.084 million, the lowest since September 2020, signaling worker caution amid economic uncertainty. Economists emphasized that sustained improvement in job openings and a stable hires rate are needed to strengthen the labor market further.​

TL;DR
  • U.S. job openings rose to 8.04 million in August, up from a revised 7.71 million in July, surpassing the expected 7.682 million.
  • There were 1.1 available jobs for every job seeker, indicating a resilient labor market.
  • Hiring activity remained sluggish, though layoffs decreased, hinting at some market stability.
  • Sectors with the largest increase in job openings: construction, transportation, and government.
  • Job openings in service industries experienced a decline.
  • Voluntary job quits fell to 3.084 million, the lowest level since September 2020, reflecting worker caution amid uncertainty.
  • Economists suggest that consistent job openings and stable hiring are needed to further strengthen the labor market.

The forecast is at 7.92M, slightly down from the previous outcome of 8.04M.

The upcoming CB Consumer Confidence and JOLTS Job Openings is scheduled for release on Tuesday at 2:00 PM GMT

29-10-01-10-JOLTS-Job-Openings.jpg
 
Apr 16, 2024
94
0
7
44
30th October 2024

Tuesday


On October 30th, key economic reports are set for release from Australia, Germany, and the United States. Australia will kick off with its latest inflation figures, followed by Germany’s Preliminary CPI m/m report. Later, the US will announce its ADP Non-Farm Employment Change and Advance GDP q/q, providing critical insights into employment trends and economic growth. These high-impact reports are expected to influence market sentiment across global financial markets.


AUD - CPI q/q

The Consumer Price Index (CPI) measures the change in the price of goods and services purchased by consumers on a quarterly basis. An actual CPI reading greater than the forecasted figure is generally positive for a currency because it indicates higher inflation, which may prompt the central bank to raise interest rates to contain inflation. Since consumer prices are a significant component of overall inflation, this relationship is crucial for currency valuation. The CPI is derived by sampling the average prices of various goods and services and comparing these prices to those from previous samples.

On July 31st, Australia reported a 1.0% quarterly increase in the Consumer Price Index (CPI), with a 1% month-on-month rise observed in June. Historically, Australia's month-on-month inflation rate has averaged 1.20%, reaching a high of 7.55% and a low of -1.90%. This latest quarterly figure highlights a sustained trend of moderate inflation after a period marked by more volatile price fluctuations.​

TL;DR

Metric​
Value​
Quarterly CPI Increase (July 31)
1.0%​
Month-on-Month CPI Increase (June)
1.0%​
Historical Average MoM Inflation
1.20%​
Historical High MoM Inflation
7.55%​
Historical Low MoM Inflation
-1.90%​
Trend
Moderate inflation following volatile fluctuations​

The forecast projects a 0.3% rate, compared to the previous result of 1.0%.

30-10-31-07-CPI-qq-AUD.jpg

AUD - CPI y/y

The Consumer Price Index (CPI) Year-over-Year measures the change in the price of goods and services purchased by consumers. When the actual CPI figure exceeds the forecasted value, it is generally advantageous for the currency. This is because consumer prices significantly impact overall inflation, which in turn affects currency valuation. Rising inflation typically prompts the central bank to raise interest rates to manage inflationary pressures. The CPI is calculated by sampling the average prices of a range of goods and services and comparing these to prices from a previous period.


Australia’s Consumer Price Index (CPI) rose by 2.7% year-on-year in August 2024, slightly below market expectations of 2.8% and down from 3.5% in July, marking the lowest inflation rate since August 2021. This drop brings inflation within the central bank’s 2-3% target range for the first time in three years, driven largely by the Energy Bill Relief Fund rebate. Notably, electricity prices saw a record fall of 17.9% (down from a 5.1% decrease in July), while automotive fuel prices also declined for the first time in 13 months by 7.6% after a previous rise of 4%. Communication costs fell by 0.2%, reversing July’s 1.9% increase, while food, alcohol and tobacco, and education costs saw moderated rises of 3.4%, 6.6%, and 5.4%, respectively. However, recreation and culture costs accelerated to 2.5%, up from 1.1%. Excluding volatile items, CPI rose by 3.0% in August, a decrease from July’s 3.7% and the lowest since December 2021.​

TL;DR
  • Australia's Consumer Price Index (CPI) rose by 2.7% year-on-year in August 2024, down from 3.5% in July and below the market forecast of 2.8%.​
  • This marks the lowest inflation rate since August 2021 and places inflation within the central bank’s target range of 2-3% for the first time in three years.​
  • Significant factors include:
    • Electricity Prices: Fell by a record 17.9% (compared to a 5.1% drop in July) due to the Energy Bill Relief Fund rebate.​
    • Automotive Fuel Prices: Declined by 7.6%, the first drop in 13 months, following a previous increase of 4%.​
    • Communication Costs: Decreased by 0.2%, reversing a 1.9% rise in July.​
  • Other sectors saw moderate increases:
    • Food Costs: Rose by 3.4%.​
    • Alcohol and Tobacco Costs: Increased by 6.6%.​
    • Education Costs: Went up by 5.4%.​
    • Recreation and Culture Costs: Accelerated to a 2.5% rise, up from 1.1%.​
  • Core Inflation (excluding volatile items): Increased by 3.0%, down from 3.7% in July, reaching the lowest since December 2021.​

The forecast stands at 2.3%, down from the previous outcome of 2.7%.


AUD - Trimmed Mean CPI q/q

The Trimmed Mean CPI q/q measures changes in consumer prices, excluding the most volatile 30% of items. A higher-than-expected actual value is positive for the currency, as consumer prices significantly influence overall inflation. Inflation affects currency valuation because rising prices often lead the central bank to raise interest rates to manage inflation.


In the second quarter of 2024, Australia's Trimmed Mean CPI, a key measure of core inflation, increased by 0.8% quarter-on-quarter. This represents a slight slowdown from the 1% rise recorded in the previous quarter and fell short of market expectations, which had anticipated a 0.9% growth. The moderation in the Trimmed Mean CPI suggests a cooling in underlying inflation pressures.​

TL;DR
  • Australia's Trimmed Mean CPI increased by 0.8% quarter-on-quarter in Q2 2024.
  • This was a slowdown from the 1% rise recorded in Q1 2024.
  • The Q2 result fell below market expectations, which had anticipated a 0.9% increase.
  • The moderation suggests a cooling in underlying inflation pressures.

The forecast stands at 0.7% compared to previous 0.8% outcome.

Australia is set to release its inflation figures on Wednesday at 12:30 AM GMT.

30-10-31-07-Trimmed-Mean-CPI-qq-AUD.jpg

EUR – German Prelim CPI m/m

The German Preliminary CPI (Consumer Price Index) month-over-month measures changes in the prices of goods and services purchased by consumers. Typically, if the actual value exceeds the forecast, it benefits the currency. This is because consumer prices make up a large portion of overall inflation. Inflation plays a crucial role in currency valuation, as rising prices often prompt the central bank to raise interest rates to meet its inflation control mandate.


In September 2024, the Consumer Price Index (CPI) in Germany remained unchanged, with a 0% variation compared to the previous month. Historically, the country’s month-on-month inflation rate has averaged 0.21% from 1950 to 2024, reflecting both significant peaks and troughs. The highest recorded inflation rate was 3.10% in October 1951, while the lowest, -2.73%, occurred in January 1950. This steady CPI in September underscores the ongoing efforts to stabilize prices in the current economic climate.​

TL;DR

MetricValue
September 2024 CPI (MoM)0%
Historical MoM Average0.21%
Highest Recorded MoM Rate3.10% (October 1951)
Lowest Recorded MoM Rate-2.73% (January 1950)
ImplicationEfforts to stabilize prices

The forecast stands at 0.2% compared to previous 0.0% outcome.

The German Preliminary CPI month-over-month (m/m) will be released throughout the day.

30-10-30-09-German-Prelim-CPI-mm-EUR.jpg

USD - ADP Non-Farm Employment Change

The ADP Non-Farm Employment Change estimates the monthly change in employment numbers, excluding the agriculture sector and government employees. Generally, if the actual data surpasses the forecast, it positively influences the currency. This metric is closely watched by traders because job creation serves as a vital indicator of consumer spending, which significantly drives overall economic activity. The data is derived by analyzing payroll information from over 25 million workers to estimate employment growth.


In September 2024, the U.S. private sector added 143,000 jobs, reflecting a rebound in hiring after a five-month slowdown, according to the ADP National Employment Report, produced in collaboration with the Stanford Digital Economy Lab. While most sectors showed growth, the information sector was the only one to lose jobs, shedding 10,000 positions. Manufacturing also saw a modest increase of 2,000 jobs, its first gain since April. The report highlights that larger firms (500+ employees) contributed significantly to the growth, adding 86,000 jobs, while small establishments (1-19 employees) saw a decline of 13,000 jobs. Regionally, the South led job creation with 61,000 new positions, particularly in the West South Central region. Pay gains slowed slightly in September, with job-stayers seeing a 4.7% increase in annual pay, while job-changers experienced a larger decline in pay growth, from 7.3% in August to 6.6%. The report noted that industries like construction, education, health services, and leisure/hospitality saw the strongest wage increases. Despite the hiring rebound, wage growth for job-changers shrank to a level not seen since January, suggesting that stronger hiring did not require higher pay growth.​

TL;DR

MetricValue/Description
Total Jobs Added143,000
Hiring TrendRebound after a five-month slowdown
Sector Performance- Information: Lost 10,000 jobs
- Manufacturing: Gained 2,000 jobs (first gain since April)
Job Creation by Firm Size- Large Firms (500+ employees): +86,000 jobs
- Small Establishments (1-19 employees): -13,000 jobs
Regional Job Creation- South: +61,000 jobs (strongest in West South Central region)
Pay Gains (Annual)- Job-Stayers: 4.7% increase
- Job-Changers: Decreased from 7.3% in August to 6.6%
Wage Growth by IndustryStrongest in Construction, Education, Health Services, and Leisure/Hospitality
Implication of Hiring and Pay GrowthStronger hiring did not drive higher pay growth, especially for job-changers (lowest wage growth since January)

The forecast stands at 110K compared to previous 143K outcome.

The upcoming ADP Non – Farm Employment Change is set to be released on Wednesday at 12:15 PM GMT.

Your paragraph text (2).png

USD - Advance GDP q/q

The real Gross Domestic Product (GDP) Annualized, released quarterly by the US Bureau of Economic Analysis, quantifies the value of final goods and services produced in the United States during a specific period. As the most widely recognized indicator of national economic health, changes in GDP are closely monitored. The data is expressed at an annualized rate, projecting how GDP would change over a year if it continued to grow at the reported rate. A high GDP reading is generally considered bullish for the US Dollar (USD), while a low reading is deemed bearish. This metric is the broadest measure of economic activity and serves as the primary gauge of the economy's health, making it critically important for traders.

The U.S. economy expanded at an annualized rate of 3% in the second quarter of 2024, maintaining the pace seen in the previous estimate and outperforming a revised 1.6% growth in the first quarter. Private inventory investment saw an upward adjustment, growing 8.3% compared to 7.5% previously estimated. Federal government spending also increased more than expected, rising by 4.3% versus the earlier figure of 3.3%. Imports were revised upwards as well, climbing 7.6% compared to the earlier 7%. However, consumer spending grew slightly slower than initially thought, at 2.8% instead of 2.9%, and there were downward revisions in nonresidential fixed investment (3.9% versus 4.6%) and exports (1% compared to 1.6%). In conjunction with these figures, the Bureau of Economic Analysis released its regular annual updates, adjusting past data. Growth for the first quarter of 2024 was revised to 1.6% from the earlier 1.4%. Notably, GDP growth for 2023 was revised up to 2.9%, while 2022 growth was adjusted to 2.5%, stronger than the previous estimate of 1.9%.​

TL;DR
  • GDP Growth: Q2 2024 maintained a 3.0% annualized growth rate; Q1 2024 revised to 1.6% from 1.4%.
  • Private Inventory Investment: Revised up to 8.3% (previously 7.5%).
  • Federal Government Spending: Increased to 4.3% (from 3.3%).
  • Imports: Revised up to 7.6% (previously 7%).
  • Consumer Spending: Adjusted slightly down to 2.8% (from 2.9%).
  • Nonresidential Fixed Investment: Revised down to 3.9% (from 4.6%).
  • Exports: Revised down to 1.0% (from 1.6%).
  • Annual Growth Revisions:
    • 2023 GDP growth revised up to 2.9%.
    • 2022 GDP growth revised up to 2.5% (previously 1.9%).

The forecast indicates 3%, matching the previous outcome.

The Advance GDP q/q is set to be released on Wednesday at 12:30 PM GMT.

30-10-25-07-Advance-GDP-qq-USD.jpg
 

Attachments

  • 30-10-02-10-ADP-Non-Farm-Employment-Change-USD.jpg
    30-10-02-10-ADP-Non-Farm-Employment-Change-USD.jpg
    244.7 KB · Views: 0
Apr 16, 2024
94
0
7
44
31st October 2024

Thursday


On October 31st, important economic releases are scheduled from China, Japan, Canada, and the United States. Starting with China, the Manufacturing PMI will be announced, followed by a significant release from Japan with its Policy Rate decision. Later, Canada will report its monthly GDP, while the United States will release the Core PCE Price Index (m/m), the Employment Cost Index (q/q), and Unemployment Claims on the same day.


CNY - Manufacturing PMI

The Manufacturing PMI is a diffusion index based on surveyed purchasing managers in the manufacturing sector, where a reading above 50 indicates industry expansion and below 50 signals contraction. It’s a leading indicator of economic health, and when the 'Actual' result is higher than forecasted, it's generally positive for the currency. This index is particularly impactful when released before the Caixin Manufacturing PMI, reflecting its correlation with Chinese data, which has broad implications for global markets and investor sentiment.


China's factory activity contracted for the fifth consecutive month in September, though the decline was less severe than expected, with the official manufacturing Purchasing Managers' Index (PMI) rising to 49.8, up from 49.1 in August. This slight improvement beat economists' expectations of 49.5, despite ongoing headwinds like a prolonged economic slowdown, property crisis, and weak domestic demand. While high-tech and equipment manufacturing sectors showed resilience, a private Caixin PMI survey painted a bleaker picture, falling to 49.3 from 50.4 in August, marking the sharpest contraction in 14 months. This drop, driven by declining demand and labor market weaknesses, highlighted concerns over Western export restrictions and fierce price competition. China's government responded with stimulus measures, including cutting the reserve requirement ratio and urging stronger fiscal and monetary support, though analysts cautioned that economic recovery will take time.​

TL;DR
  • China’s factory activity contracted for the fifth consecutive month in September, though the decline was less severe than expected.​
  • The official manufacturing PMI rose to 49.8 in September, up from 49.1 in August, surpassing economists' predictions of 49.5.​
  • High-tech and equipment manufacturing sectors showed resilience despite challenges like economic slowdown, property crisis, and weak domestic demand.​
  • A separate Caixin PMI survey presented a bleaker view, falling to 49.3 from 50.4 in August, marking the sharpest contraction in 14 months.​
  • Declining demand, labor market issues, Western export restrictions, and intense price competition contributed to the Caixin PMI’s drop.​
  • In response, China implemented stimulus measures, including reducing the reserve requirement ratio and promoting stronger fiscal and monetary support.​
  • Analysts caution that economic recovery will be gradual despite these government interventions.​

The forecast matches the previous outcome, showing a figure of 49.8.

The Manufacturing PMI is set to be released on Thursday at 1:30 AM GMT.

31-10-30-09-Manufacturing-PMI-CNY.jpg

JPY – BOJ Policy Rate

The BOJ Policy Rate involves the interest rate applied to excess current account balances held at the Bank of Japan. When the actual rate exceeds the forecast, it is beneficial for the currency. Traders closely monitor short-term interest rates as they are vital for currency valuation, using other indicators mainly to anticipate future rate changes.


The Bank of Japan (BoJ) unanimously decided to retain its key short-term interest rate at approximately 0.25% during its September meeting, marking the highest level since 2008, in line with market expectations. The central bank’s decision highlighted that it was not in a rush to further raise rates after previous hikes in March and July of this year. The BoJ board emphasized the need for additional time to monitor financial markets, particularly amid hawkish sentiment from some members. The bank maintained its assessment that Japan's economy was on a path toward moderate recovery, though it acknowledged some areas of weakness. Private consumption had continued to improve, supported by rising corporate profits and increased business spending, while exports and industrial production remained relatively stagnant. In terms of inflation, year-on-year figures had ranged between 2.5% and 3.0%, primarily due to higher service prices, with inflation expectations showing a moderate rise. The underlying Consumer Price Index (CPI) was projected to increase gradually.​

TL;DR
TopicDetails
Interest Rate DecisionRetained at approximately 0.25%, highest since 2008, with no immediate plan to raise rates further
Previous Rate HikesRate hikes occurred in March and July 2024
Financial Market OutlookExtra time needed to monitor financial markets due to hawkish sentiment among some BoJ members
Economic AssessmentJapan's economy on a moderate recovery path, though with some noted weaknesses
Private ConsumptionContinued improvement, supported by higher corporate profits and increased business spending
Exports and ProductionRemained relatively stagnant
Inflation RateYear-on-year inflation ranged from 2.5% to 3.0%, primarily driven by higher service prices
Inflation ExpectationsModerate rise in inflation expectations
Consumer Price Index (CPI)Underlying CPI expected to increase gradually

The forecast indicates a 2.25% rate, consistent with the previous outcome.


The timing of the Bank of Japan's figure release remains unknown.

31-10-20-09-BOJ-Policy-Rate-JPY.jpg

CAD - GDP m/m

The GDP month-over-month (m/m) measures reflect the change in the inflation-adjusted value of all goods and services produced by the economy. An 'Actual' value that exceeds the 'Forecast' is generally seen as favorable for the currency. Traders pay close attention to this indicator because it is the broadest measure of economic activity and serves as the primary gauge of the overall health of the economy.


In July 2024, Canada's real GDP rose by 0.2%, following a stagnant June, with services-producing industries driving the growth despite disruptions caused by wildfires. Retail trade grew by 1.0%, marking its strongest performance since January, with motor vehicle and parts dealers contributing significantly, though tempered by a decline in gasoline sales. The public sector expanded for the seventh consecutive month, and the finance and insurance sector rose 0.5% for a second month, bolstered by increased financial market activity. Goods-producing industries grew by 0.1%, with utilities and non-durable manufacturing leading the way. However, wildfires impacted multiple sectors, notably transportation, warehousing, and accommodation services, while construction saw a 0.4% decline. Preliminary estimates suggest GDP remained flat in August, with gains in oil and gas extraction offset by declines in manufacturing and transportation.​

TL;DR

SectorJuly Growth (%)Highlights
Overall GDP+0.2Services-producing industries led growth despite wildfire disruptions.
Retail Trade+1.0Strongest performance since January, led by motor vehicle and parts dealers; gasoline sales down.
Public SectorGrowthExpanded for the seventh consecutive month.
Finance and Insurance+0.5Increase attributed to heightened financial market activity.
Goods-Producing Industries+0.1Growth led by utilities and non-durable manufacturing.
UtilitiesGrowthSignificant contributor within goods-producing industries.
Non-Durable ManufacturingGrowthNotable contributor in goods-producing industries.
Transportation and WarehousingDeclineNegatively impacted by wildfires.
Accommodation ServicesDeclineWildfire disruptions affected this sector.
Construction-0.4Decline in activity.
Preliminary August EstimateFlat (0.0%)Gains in oil and gas extraction offset by declines in manufacturing and transportation.

The forecast indicates a 0.0% change, down from the previous outcome of 0.2%.

The upcoming GDP m/m is set to be released on Thursday at 12:30 PM GMT.

31-10-27-09-GDP-mm-CAD (1).jpg

USD - Core PCE Price Index m/m

The Core PCE Price Index, excluding food and energy, is the Federal Reserve's main measure of inflation. An increase above forecasts typically strengthens the currency as it prompts the Fed to raise interest rates to control inflation, affecting economic and currency stability. This index is crucial for traders monitoring potential shifts in monetary policy.


In August 2024, personal income in the U.S. increased by $50.5 billion, or 0.2%, according to the Bureau of Economic Analysis. Disposable personal income (DPI), which accounts for personal income after taxes, rose by $34.2 billion (0.2%), while personal consumption expenditures (PCE) grew by $47.2 billion (0.2%). The PCE price index, which measures inflation, increased by 0.1% overall, with goods prices falling 0.2% and services prices rising 0.2%. Excluding food and energy, the core PCE price index also increased 0.1%. Notably, spending on services like housing and financial services increased, while spending on goods, especially new motor vehicles, declined. Real DPI and real PCE both grew by 0.1%, with a marginal rise in spending on goods and a 0.2% increase in services spending. Personal saving reached $1.05 trillion in August, with a saving rate of 4.8%. Year-over-year, the PCE price index climbed by 2.2%, with a notable decrease in energy prices but continued inflation in services. The release also includes revised data from earlier months as part of an annual update to national economic accounts.​

TL;DR
  • Personal Income: Rose by $50.5 billion (+0.2%).
  • Disposable Personal Income (DPI): Increased by $34.2 billion (+0.2%).
  • Personal Consumption Expenditures (PCE): Grew by $47.2 billion (+0.2%).
  • PCE Price Index (Inflation): Overall increase of 0.1%.
    • Goods Prices: Decreased by 0.2%.
    • Services Prices: Increased by 0.2%.
  • Core PCE Price Index (Excluding Food & Energy): Increased by 0.1%.
  • Real DPI (Adjusted for Inflation): Up by 0.1%.
  • Real PCE (Adjusted for Inflation): Grew by 0.1%.
    • Goods Spending: Marginal increase.
    • Services Spending: Increased by 0.2%.
  • Personal Savings: Reached $1.05 trillion.
    • Savings Rate: 4.8%.
  • Year-over-Year PCE Price Index: Rose by 2.2%.
    • Energy Prices: Declined notably.
    • Inflation in Services: Continued rise.
  • Additional Note: Revised data from prior months included as part of an annual update.

The forecast shows a 0.3% increase, up from the previous 0.1% outcome.

31-10-27-09-Core-PCE-Price-Index-mm-USD.jpg

USD - Employment Cost Index q/q

The Employment Cost Index (ECI) measures the change in the price businesses and the government pay for civilian labor, with a higher-than-forecast ECI generally being favorable for the currency because it signals potential consumer inflation, as increased labor costs are often passed on to consumers.


The U.S. Bureau of Labor Statistics reported that compensation costs for civilian workers rose by 0.9% for the three-month period ending in June 2024. This increase matches the 0.9% rise in wages and salaries and is slightly below the 1.0% increase in benefit costs observed during the same period. Over the past year, compensation costs grew by 4.1%, a slowdown from the 4.5% increase recorded in June 2023. Within private industry, compensation costs increased by 3.9% year-over-year, down from 4.5% the previous year. Notably, inflation-adjusted compensation costs for private industry rose by 0.9%, with wages and salaries up 1.1%. The data highlights a moderating pace in compensation growth amid varying trends in wages and benefits across different sectors.​

TL;DR
  • Quarterly Compensation Growth (Q2 2024)
    • Civilian workers' total compensation rose by 0.9%.
    • Wages and salaries for civilian workers increased by 0.9%.
    • Benefit costs for civilian workers increased slightly more at 1.0%.
  • Year-over-Year Compensation Growth (June 2024)
    • Overall civilian compensation grew by 4.1%, down from 4.5% in June 2023.
    • Private industry compensation rose by 3.9%, a decrease from 4.5% the previous year.
    • Inflation-adjusted private industry compensation increased by 0.9%.
    • Inflation-adjusted wages and salaries in private industry were up by 1.1%.
  • Trend Highlight: Compensation growth is moderating, with variations in wages and benefits across sectors.

The forecast is showing 0.9%, consistent with the previous result.

31-10-31-07-Employment-Cost-Index-qq-USD.jpg

USD - Unemployment Claims

Initial Jobless Claims track the number of people filing for unemployment benefits for the first time in a week, serving as an early indicator of U.S. economic health. While the impact on the market can vary, a higher than expected number is usually seen as negative for the USD, and a lower than expected number as positive. Traders monitor these figures closely as they reflect labor market conditions, which are directly linked to consumer spending and are crucial for shaping monetary policy.


The U.S. Department of Labor reported that initial jobless claims fell by 15,000 to 227,000 for the week ending October 19, marking a positive sign for the labor market. The 4-week moving average, a less volatile measure, also declined by 2,000 to 238,500. However, despite this drop, the insured unemployment rate for the week ending October 12 edged up by 0.1 percentage point to 1.3%, as insured unemployment rose by 28,000 to 1,897,000, the highest level since November 2021. The 4-week moving average for insured unemployment increased by 17,500 to 1,860,750, signaling potential softening in the job market despite the short-term dip in initial claims.​

TL;DR
MetricValueChangeRemarks
Initial Jobless Claims227,000Decreased by 15,000Positive sign for labor market
4-Week Moving Average (Jobless)238,500Decreased by 2,000Indicates less volatility
Insured Unemployment Rate1.3%Increased by 0.1 percentage pointSignals potential softening
Insured Unemployment1,897,000Increased by 28,000Highest level since November 2021
4-Week Moving Average (Insured)1,860,750Increased by 17,500Suggests weakening despite short-term dip
The forecast indicates 229,000, up from the previous outcome of 227,000.

The Core PCE Price Index (month-over-month), Employment Cost Index (quarter-over-quarter), and Unemployment Claims data are scheduled for release this Thursday at 12:30 PM GMT.

31-10-24-10-Unemployment-Claims-USD.jpg